Zilliqa Price Predictions 2023-2032
- Zilliqa Price Prediction 2023 – up to $0.027
- Zilliqa Price Prediction 2026 – up to $0.095
- Zilliqa Price Prediction 2029 – up to $0.307
- Zilliqa Price Prediction 2032 – up to $0.983
The short growth span has made relatively new coins like Zilliqa (ZIL) more interesting among crypto traders and investors. Will this growth be cut short by doubts about the safety of crypto exchanges? Are Zilliqa Price Predictions affected by crypto exchanges’ fiasco?
Noticeable are two immediate market responses that can affect crypto prices after the FTX fiasco:
- Roughly $3.7 billion in BTC and $2.5 billion in ETH withdrawn
- Over $2 billion in stablecoins was also taken off exchanges
From one perspective, less Bitcoin in circulation could be good as the prices rise with the scarcity of the coin, and when the BTC price goes up, prices of altcoins are pulled up with it, simple demand-and-supply economics. Ranting about BTC and the need for crypto regulation is tantamount to barking up the wrong tree because FTX is the extreme opposite of Bitcoin and decentralization.
The crypto community should pull in together to make their coins more popular and make others know how the crypto network is special. For one, users should rally around ZIL in the coming years. Some questions need answers and founders should strive to complete the roadmap for their startups.
Zil as a stablecoin is ranked as the Top 3 stablecoins by the proportion of the total supply of non-USD fiat-backed stablecoins. Zilliqa’s smart contracts are the backbone of the XSGD infrastructure.
How much is ZIL worth?
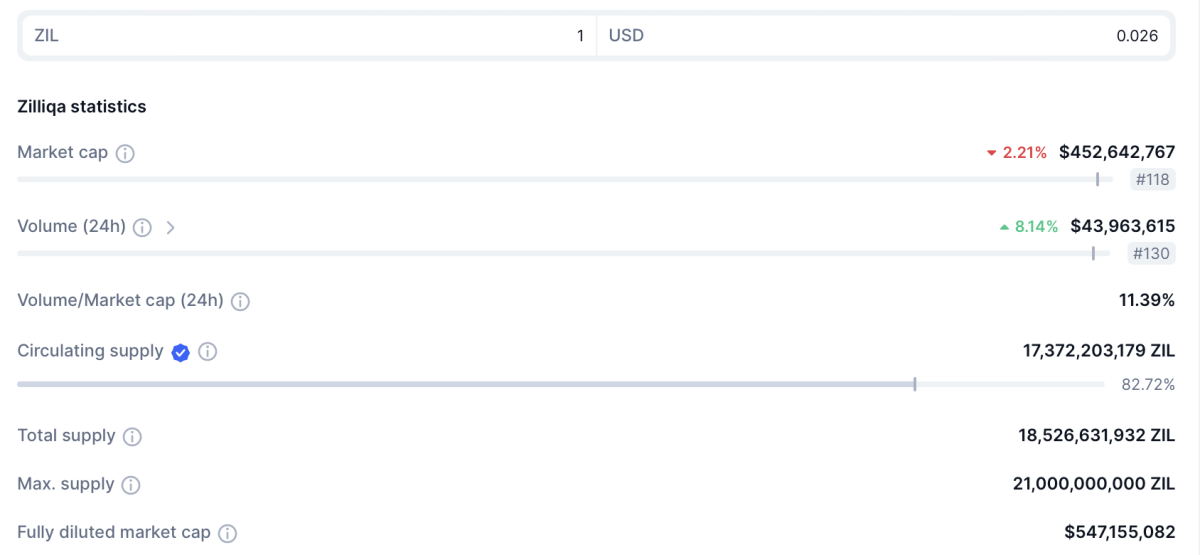
Today’s Zilliqa price is $0.0269 with a 24-hour trading volume of $40,431,642. Zilliqa is up 1.57% in the last 24 hours. The current CoinMarketCap ranking is #125, with a live market cap of $467,584,452. It has a circulating supply of 17,372,203,179 ZIL coins and a max. supply of 21,000,000,000 ZIL coins.
Also Read:
- How to Stake Zilliqa: Earn 6% APY based on 80% ZIL in Circulation
- A look at all the crypto people that would be behind bars in 2024
Zilliqa Technical Analysis: Widening Volatility and Overbought Conditions Suggest Potential Trend Shift
TL;DR Breakdown
- ZIL breaks $0.02753 resistance on the 4-hour chart
- Potential consolidation between $0.02753 and $0.02605
- Increased volatility on the 1-day chart
ZIL/USD 1-day price chart: Bearish Divergence Imminent?
The 1-day ZIL price chart shows widening Bollinger bands, which is an indication of increasing volatility. Also with the price trading on the upper band, ZIL may be overbought and a period of consolidation or correction might be imminent. A bearish divergence could provide more clarity on the likelihood of a price reversal.
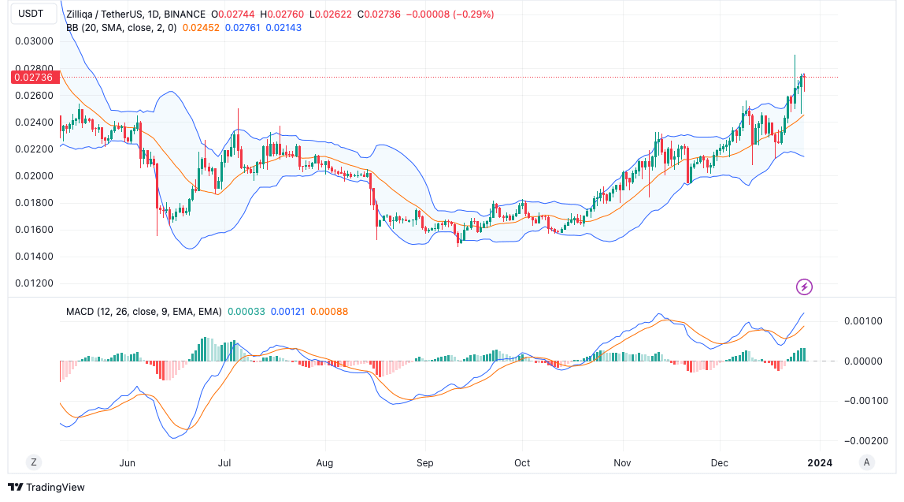
While the MACD crossover indicates positive momentum, the fact that the price is on the upper Bollinger Band suggests potential overbought conditions. If you are in a long position, this may present an opportunity for profit-taking. Finally, it’s important to watch for any divergence. If the price continues to make higher highs while the MACD doesn’t, it could signal weakening momentum and a potential trend reversal.
ZIL/USD 4-hour price chart: ZIL breaches resistance at $0.02753
Looking at the Zilliqa 4-hour price chart, the coin is currently exhibiting a bullish trend with prices heading higher and recently breaching the $0.02753 resistance level. In the event of a bearish turnaround, ZIL is expected to consolidate within $0.2605 and $0.02753. A breach of support within the consolidation zone could take ZIL down to $0.02536.
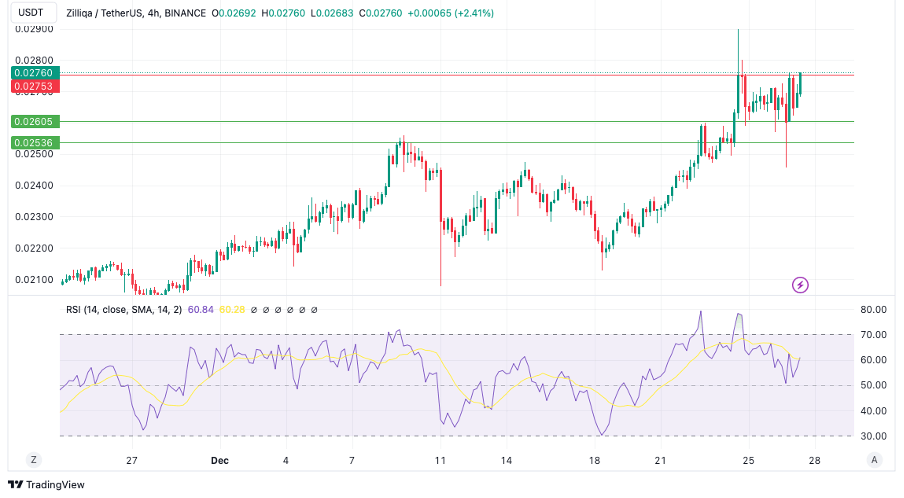
Volatility is increasing across the crypto market; the value of the RSI (60.84) corroborates this position. In other words, ZIL is approaching an overbought situation and a bearish wave could be next if the peak market price is reached. Hence, traders must monitor highs and lows before taking action.
Zilliqa (ZIL) is a blockchain platform that provides high throughput and low transaction fees for decentralized applications (dApps). Like most cryptocurrencies, Zilliqa’s value is prone to fluctuations and can be influenced by various factors, such as market trends, adoption rates, and regulatory developments. Market trends have been bullish in recent weeks, leading to a 22% price pump in the last month.
Investors may wonder what the future holds for Zilliqa and whether a recovery is imminent. To shed some light on this, we have analyzed the potential price trajectory for ZIL from 2023 to 2032. Our insights offer a glimpse into what investors may expect in the coming years.

| Year | Minimum Price ($) | Average Price ($) | Maximum Price ($) |
| 2023 | 0.024 | 0.026 | 0.027 |
| 2024 | 0.037 | 0.038 | 0.043 |
| 2025 | 0.054 | 0.056 | 0.064 |
| 2026 | 0.079 | 0.082 | 0.095 |
| 2027 | 0.121 | 0.125 | 0.139 |
| 2028 | 0.179 | 0.184 | 0.214 |
| 2029 | 0.266 | 0.273 | 0.307 |
| 2030 | 0.386 | 0.397 | 0.465 |
| 2031 | 0.557 | 0.577 | 0.666 |
| 2032 | 0.823 | 0.846 | 0.983 |
Based on our analysis of ZIL’s technical indicators, we predict that the token will experience bullish momentum throughout 2023, with a potential high of $0.027. The expected average price for the year is $0.026, with a minimum price of $0.024.
Zilliqa Price Prediction 2024
Our technical analysis suggests that Zilliqa is poised for continued growth in 2024, with the price expected to reach a maximum of $0.043. The average price for the year is predicted to be $0.038, with a minimum of $0.037.
Zilliqa Price Prediction 2025
Our analysis of Zilliqa’s technical indicators suggests a bullish market for ZIL in 2025, with the token expected to reach a maximum trading price of $0.064. The average trading price for the year is predicted to be $0.056, with a minimum price of $0.054.
Zilliqa Price Prediction 2026
Based on our Zilliqa price prediction for 2026, we predict a bullish market for ZIL with a maximum trading price of $0.095. The token is also expected to have an average trading price of $0.082 and a minimum price of $0.079.
Zilliqa Price Prediction 2027
According to our Zilliqa price prediction for 2027, we predict that the cryptocurrency will exhibit a bullish pattern, reaching a maximum price of $0.139, a minimum price of $0.125, and an average price of $0.121.
Zilliqa Price Prediction 2028
Based on our Zilliqa price prediction for 2028, we anticipate that the cryptocurrency will experience a bullish trend, increasing to a maximum price of $0.214, an average price of $0.184, and a minimum price of $0.179.
Zilliqa Price Prediction 2029
As per our analysis and Zilliqa (ZIL) price prediction for 2029, we anticipate a peak price of $0.307 for ZIL, an average of around $0.273, and a minimum price of $0.266.
Zilliqa Price Prediction 2030
Our Zilliqa price prediction for 2030 suggests that ZIL will experience a notable increase in value, with a projected trading range of $0.386-$0.465. Based on these figures, we expect the average price of ZIL to be around $0.397.
Zilliqa Price Prediction 2031
Zilliqa (ZIL) is predicted to reach a maximum market price of $0.666 by 2031, with an average price of $0.577 and a minimum price of $0.557.
Zilliqa Price Prediction 2032
Based on our ZIL price forecast for the year 2032, Zilliqa is anticipated to experience consistent price increases for the year. We project that the maximum price for ZIL will reach $0.983, while the average price is expected to be around $0.846 and the minimum price to be approximately $0.823.
Wallet Investor Zilliqa Price Prediction
According to Wallet Investor’s forecast, the value of Zilliqa (ZIL) is expected to experience a significant drop of 85.15% in 2024, resulting in a price of 0.00392 USD. As a result, Wallet Investor considers ZIL to be an unfavorable option for long-term investment. This prediction suggests that there may be significant challenges or obstacles facing Zilliqa that could impact its long-term growth potential.
Cryptopredictions.com Zilliqa Price Prediction
According to Cryptopredictions.com, the Zilliqa (ZIL) market is expected to close in 2023 with an average trading price of $0.0356, a minimum price of $0.0302, and a maximum market price of $0.0445. In 2024, ZIL is predicted to experience gains throughout the year, with a price range of $0.0317 to $0.0466 by December.
For 2025, Cryptopredictions.com forecasts that the price of ZIL will continue to rise, reaching an average value of $0.0495 by mid-year. By the end of 2025, the minimum and maximum trading prices of ZIL are expected to be $0.0362 and $0.0533, respectively.
By 2026, Cryptopredictions.com predicts that ZIL will maintain its upward momentum, with an average price of $0.0499, a minimum price of $0.0424, and a maximum market price of $0.0624 by December.
Coincodex Zilliqa Price Prediction
Coincodex’s analysis of Zilliqa (ZIL) suggests that the token’s price could fall to $0.0255 in five days, $0.0243 in one month, and $ 0.0249 in 6 months. If Zilliqa’s price movement correlates with the growth of the broader technology sector, Coincodex predicts that the token could be a profitable investment opportunity in the coming years recovering to $0.0925 by the end of 2024.
Zilliqa Price Predictions by Industry Influencers
According to @StarTradingFriend, the price of the ZIL coin has been continuously falling, and he advises waiting for a proper breakout before entering a trade. The entry price is suggested to be around 0.1865, with a stop loss to prevent major losses. The first target is 0.35827, and the next target is 0.4842. StarTradingFriend suggests always trading the breakouts and drawing trend lines to identify the movement of the candles.
Zilliqa Overview
Zilliqa (ZIL) is a blockchain platform known for its innovative sharding technology, which addresses scalability issues in decentralized applications and smart contracts. Launched in 2017, Zilliqa uses sharding to increase transaction throughput, making it a scalable and efficient platform. ZIL is the native cryptocurrency, and the platform supports the development of various decentralized applications, emphasizing security and practical scalability solutions.
Zcash Price History
Zilliqa conducted an Initial Coin Offering (ICO) that ended in January 2018, raising ether (ETH) worth $22 million. At the time of the ICO, one ZIL coin was going for 1 ZIL = 0.0000084656 ETH, and only 30% of the ZIL’s total supply of 21 million ZIL coins was up for the ICO sale.
Originally the ZIL cryptocurrency was an ERC20 token since the Zilliqa blockchain had been launched on the Ethereum blockchain. However, the Zilliqa blockchain introduced its mainnet in 2019, and the ERC20 was swapped with Zilliqa (ZIL) tokens.
The current circulating supply is about 11,670,142,875 ZIL tokens out of the total 21,000,000,000 ZIL tokens generating a market capitalization of $1.2 billion.
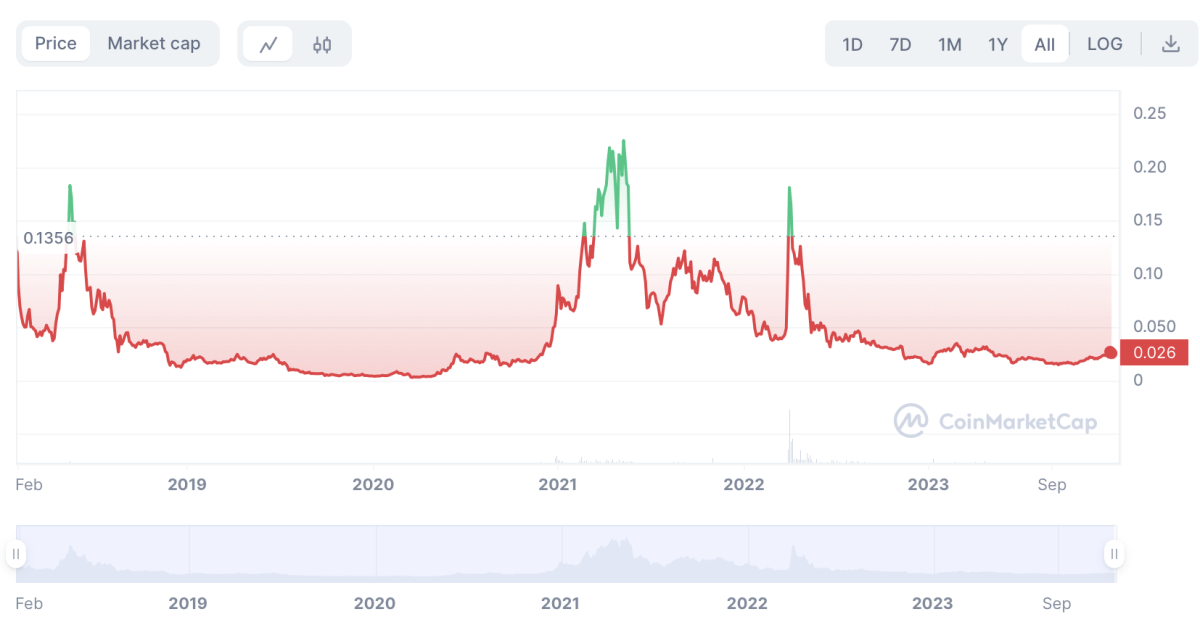
The coin hit its all-time high market price of $0.2563 on May 06, 2021. Its all-time low of $0.002477 was recorded on March 13, 2020, when most cryptocurrencies struggled with a persistent bearish trend. Currently, ZIL is consolidating within the $0.026 region.
More on Zilliqa Network
What is Zilliqa (ZIL)?
Zilliqa (ZIL) is the native token/cryptocurrency of the Zilliqa blockchain. It serves several roles within the blockchain network, with the primary role being used as a digital currency within the network.
What is the Zilliqa blockchain network?
Zilliqa is a decentralized blockchain network that enables developers to develop decentralized applications (DApps) for enterprises using smart contracts and sharding technologies. It is based in Singapore and was launched in 2017, co-founded by Amrit Kumar, the current president; Yaoqi Jia, its current chief scientific officer; Xinshu Dong, who is currently a board member; and Max Kantelia, who is a board member and an adviser.
Zilliqa was the first public blockchain network around the world to use sharding, which refers to the use of side chains (or smaller blockchain networks attached to the mainnet) to perform certain tasks instead of burdening the mainnet with everything.
In a nutshell, sharding makes a blockchain network more scalable as it avoids the congestion in the mainnet. Besides the side chains responsible for processing transactions within the blockchain network, a Zilliqa user can develop a decentralized application and attach it to Zilliqa’s mainnet as a side chain.
By integrating sharding, the Zilliqa blockchain has remained highly scalable as its user base continues to grow.
How does Zilliqa Network work?
Zilliqa was developed to solve scalability concerns, one of the biggest concerns among legendary blockchains like Bitcoin and Ethereum. By using Sharding, Zilliqa has achieved high scalability.
There are multiple shards (side chains) attached to Zilliqa’a mainnet responsible for processing a very high throughput of transactions in a cost-effective, speedy and efficient manner. Zilliqa can process thousands of transactions within a second compared to Bitcoin, where transactions can take up to 10 minutes to be processed.
Because of its scalability, Zilliqa is an ideal blockchain for processing complex computational tasks like financial modeling and data mining, making it a perfect choice for data-based academic research, internet of things (IoT) applications, training neural network training, and machine learning applications.
What are the benefits of using Zilliqa (ZIL)?
Though a relatively new blockchain technology compared to Bitcoin and Ethereum, the Zilliqa blockchain offers a wide range of benefits to its Zilliqa (ZIL) users. These benefits include:
- Decentralization
Zilliqa is a public decentralized blockchain network meaning it has no central coordinator(s), and users do not have to worry about their transactions being handled by middlemen or a central authority since there are none.
Anyone can purchase the Zilliqa (ZIL) cryptocurrency on a cryptocurrency exchange like Binance, OKEX, Huobi, TRANSAK, UPbit, Changelly, SimpleSwap, BitFinex, or KuCoin, among others, and use it for staking, buying merchandise from Zilliqa Merchadize store, covering smart contract execution fees, and covering transaction fees.
- High scalability
By using sharding, Zilliqa can handle large transfers within minutes without becoming congested.
- Smart contracts
Zilliqa provides developers with a smart contract-enabled programming language called Smart Contract Intermediate-Level Language (Scilla).
They allow developers to develop DApps and allow parties to execute agreements efficiently without third parties.
- Security
Zilliqa integrated enterprise-grade security features that have gone a long way in ensuring that hackers cannot access its transactions or the DApps developed on the blockchain. It has never been hacked since it was invented, and developers have been developing exciting DApps that run on the blockchain.
- Low fees
By using sharding, Zilliqa has avoided congestion, which is a major contributor to rising miner fees and gas prices on other blockchains.
Conclusion
The future price of ZIL, according to the price forecast of Zilliqa, shows the optimistic growth of the crypto coin. Zilliqa operates on a strong platform that is expected to realize impressive future results according to the forecasts.
The launch of the metaverse project – “metapolis,” in April spurred Zilliqa to a new level of publicity, leading to massive price pumps. Following that success, Zilliqa is looking to explore another sector of the blockchain industry
Recently, Zilliqa announced plans to delve into the Web3 gaming space, with the launch of a hardware game console and gaming hub slated for 2023. Based on this trend, interested investors in Zilliqa can be assured of continuous development and expansion of the network.
According to our predictions, Zilliqa is an excellent portfolio addition for long-term investors, with the potential to record massive profits in the coming years. Nevertheless, remember to do your diligence and consult market experts before making any investment decision. This is not investment advice, and more research should be conducted before investing in the Zilliqa coin.
