VeChain Price Prediction 2024-2033
- VeChain Price Prediction 2024 – up to $0.0523
- VeChain Price Prediction 2027 – up to $0.1717
- VeChain Price Prediction 2030 – up to $0.4797
- VeChain Price Prediction 2033 – up to $1.4700
Since its launch, Vechain’s focus has been building technologies that solve obstacles impeding the mass adoption of blockchain technology. Two months ago, one of the most important pieces of technology in this mission was officially launched — VORJ. VORJ is a no-code Web3-as-a-Service platform that enables anyone to create, deploy and interact with smart contracts on the VechainThor blockchain — you no longer need to understand solidity to get involved.
VORJ can seamlessly integrate with existing projects, or help users create entirely new ones from scratch. Importantly, by ensuring Ethereum-standard compatibility, contracts deployed by VORJ can interoperate across EVM blockchains, opening up a world of possibilities for DApp or DeFi builders looking to take advantage of VechainThor’s enterprise-grade technical features. Let’s dive deep into VeChain prices to gauge if this coin is worth investing in.
How much is VeChain worth?
Today’s VeChain price is $0.039435 USD with a 24-hour trading volume of $53,704,176 USD. We update our VET to USD price in real-time. VeChain is down 1.92% in the last 24 hours. The current CoinMarketCap ranking is #40, with a live market cap of $2,867,476,584 USD. It has a circulating supply of 72,714,516,834 VET coins and a max. supply of 86,712,634,466 VET coins.
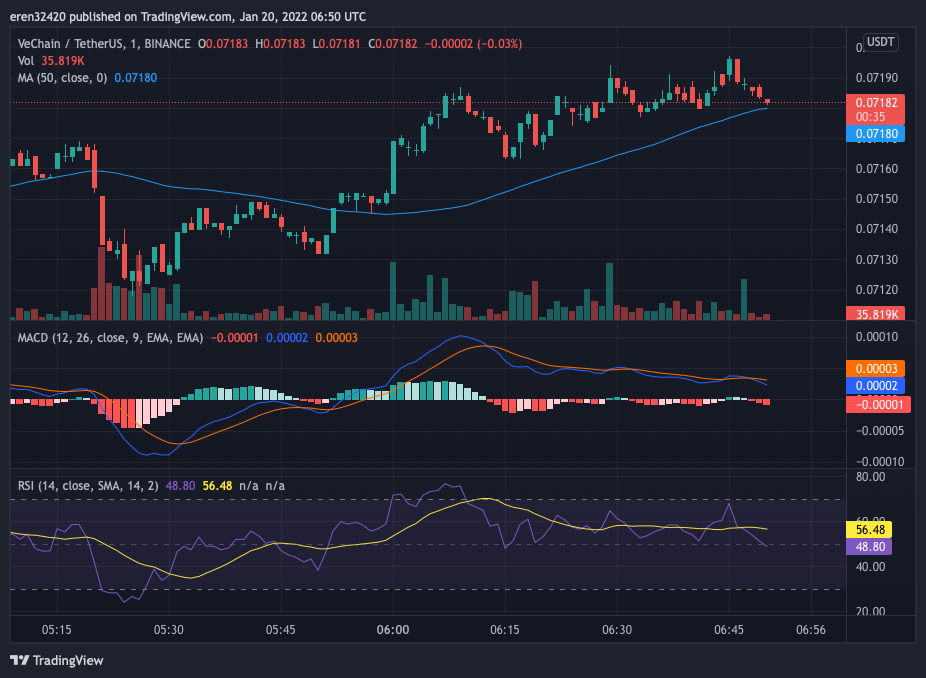
VeChain price analysis: VET falls to $0.04400 as bears crush short-term support levels
The VeChain price analysis shows that the VET price action has found support at the $0.04400 mark where it currently trades. However, the increasing bearish pressure suggests that this might not be the end of the downtrend.
The broader cryptocurrency market observed bearish sentiment over the last 24 hours as most major cryptocurrencies recorded negative price movements. Major players include FIL and AVAX recording a 1.10 and a 1.00 percent decline respectively.
VeChain price analysis: VET rejected at $0.05000

The MACD is currently bullish as expressed in the green colour of the histogram. However, the indicator only shows low momentum as observed in the short height of the histogram. Moreover, the lighter shade suggests a decreasing bearish pressure across the charts as the price action observes rising volatility across the short-term charts.
The EMAs are trading above the mean position as net price movement over the last ten days remains positive. Currently, the EMAs are trading close to each other showing low bearish momentum at press time. Moreover, the converging EMAs suggest a decreasing bearish momentum.
The RSI has returned to the bottom of the neutral region as the price action falls to the $0.04435 level. At press time, the indicator trades close to the mean at the 39.68 index level as the price suggests low pressure from either side of the market while the neutral slope suggests low activity across the markets.
The Bollinger Bands are currently expanding as the price action increases volatility across the short-term charts. Moreover, the bands will continue converging as the price consolidates around the $0.04400 mark. At press time, the bands’ lower limit provides support at the $0.04664 mark while the upper limit presents a resistance level at the $0.05000 mark.
Technical analysis: 4-hour VET/USDT analysis
Overall, the 4-hour VeChain price analysis issues a buy signal at press time with 13 indicators supporting the bulls. On the other hand, only three of the indicators support the bears showing a low bearish presence. At the same time, 10 indicators sit on the fence and support neither side of the market.
The 24-hour VeChain price analysis shares this sentiment and also issues a buy signal with 13 indicators supporting the bulls against only six supporting the bears. The analysis shows bullish dominance across the mid-term charts with a strong bullish presence at the current price level. Meanwhile, the remaining seven indicators remain neutral and do not issue any signals at press time.
What to expect from VeChain price analysis?

The VeChain price analysis shows that the VeChain market observes strong bearish momentum causing the price action to dwindle from the $0.05100 mark towards the $0.037000 mark. While the bulls find strong support level at the $0.03700 mark, the strong bearish pressure suggests further downwards movement from the $0.04400 mark.
Traders should expect VET to continue its strong bullish rally, however, the rally would require a brief rest at the current price level as the bulls appear to be exhausted and need time before continuing the charge. Moreover, the strong trade volume suggests an increasing trade activity for the asset suggesting a strong force behind the recent push. As such, the price can be expected to move between the $0.03700-$0.04650 price level across the short-term charts.
Currently, the closest support level lies at $0.03800 while VeChain finds it difficult to move past the $0.04200 level.
Is Vechain a good investment?
VeChain stands out in the cryptocurrency market due to its specialized focus on supply chain management and enterprise solutions. It offers transparency and traceability across various industries, enhancing trust and efficiency in global trade. With partnerships with major companies and a strong emphasis on real-world applications, VeChain has significant growth potential. Its innovative use cases and practical implementations make it appealing to businesses seeking operational improvements. As awareness of supply chain issues continues to grow, VeChain’s relevance and adoption are expected to increase, making it an attractive investment option for those interested in blockchain technology.
Recent News/Opinion on Vechain
VeChain recently announced that the organization has secured a Patent for its key management solutions.
VeChain Price Predictions 2024-2033
Price Predictions By Cryptopolitan
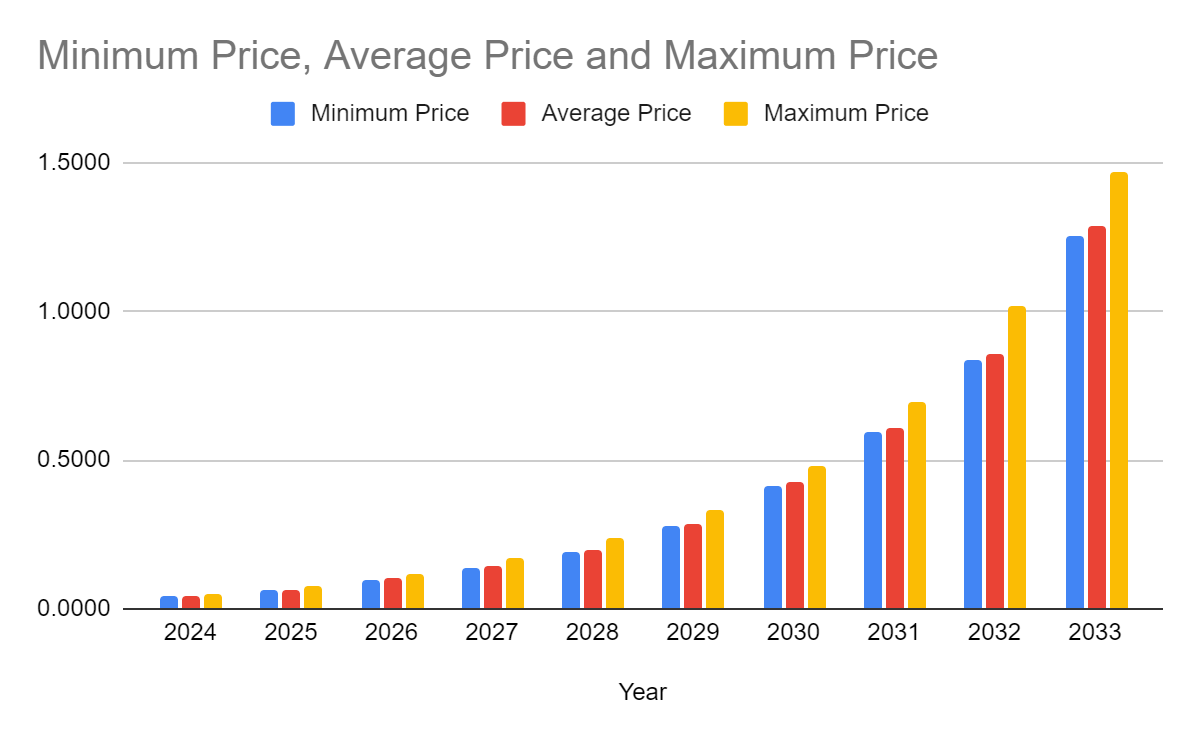
| Year | Minimum Price | Average Price | Maximum Price |
| 2024 | 0.0433 | 0.0446 | 0.0523 |
| 2025 | 0.0638 | 0.0660 | 0.0748 |
| 2026 | 0.0974 | 0.1007 | 0.1141 |
| 2027 | 0.1384 | 0.1435 | 0.1717 |
| 2028 | 0.1909 | 0.1967 | 0.2375 |
| 2029 | 0.2779 | 0.2857 | 0.3317 |
| 2030 | 0.4118 | 0.4233 | 0.4797 |
| 2031 | 0.5921 | 0.6090 | 0.6967 |
| 2032 | 0.8351 | 0.8595 | 1.0200 |
| 2033 | 1.2500 | 1.2900 | 1.4700 |
VeChain Price Prediction 2024
In 2024, the price of 1 VeChain is anticipated to touch a minimum of $0.0433. The VET price might peak at $0.0523, maintaining an average of $0.0446 throughout the year.
VeChain Price Prediction 2025
For 2025, VeChain’s price is expected to start at a minimum of $0.0638. It could potentially climb to a high of $0.0748, averaging around $0.0660 over the year.
VET Price Forecast for 2026
By 2026, VeChain’s price is projected to be at least $0.0974. It might surge to a high of $0.051, with an average price hovering around $0.1007.
VeChain (VET) Price Prediction 2027
Come 2027, VeChain is estimated to value at a minimum of $0.1384. The price might escalate to $0.073, with a mean value of $0.1435 for the year.
VeChain Price Prediction 2028
In 2028, VeChain’s price is likely to hit a floor of $0.1909. Based on our analysis, it could peak at $0.2375, with a median price of $0.1967.
VeChain Price Prediction 2029
From our in-depth technical analysis, we anticipate that in 2029, VeChain will have a minimum price of $0.2779. It could reach a zenith of $0.3317, averaging at $0.2857.
VeChain (VET) Price Prediction 2030
Our detailed technical study suggests that in 2030, VeChain will value at a minimum of $0.4118. The price might soar to $0.4797, maintaining an average of $0.4233 throughout.
VeChain Price Forecast 2031
For 2031, VeChain’s price is projected to be no less than $0.5921. It has the potential to touch $0.6967, with a central value of $0.6090.
VeChain (VET) Price Prediction 2032
Based on our predictions and technical insights, VeChain’s price in 2032 might start at $0.8351 and could peak at $1.0200, averaging around $0.8595.
VeChain Price Prediction 2033
In 2033, as per our analysis, VeChain is likely to value at a minimum of $1.2500. The price might peak at $1.4700, with an average of $1.2900 for the year.
VeChain Price Prediction By Coincodex
According to Coincodex’s current VeChain price prediction, the price of VeChain is forecasted to decrease by -1.11% and reach $ 0.032493 by February 12, 2024. Coincodex’s technical indicators suggest that the current sentiment is Bearish, and the Fear & Greed Index indicates a score of 45 (Fear). Over the last 30 days, VeChain has experienced 16 out of 30 (53%) green days with a price volatility of 2.87%. Based on Coincodex’s VeChain forecast, it is currently not advisable to buy VeChain.
Based on the historical price movements of VeChain and the BTC halving cycles, the yearly low VeChain price prediction for 2024 is estimated at $0.030377. Meanwhile, the price of VeChain is predicted to reach as high as $ 0.127785 next year.
VeChain Price Prediction By Digital Coin Price
According to Digital Coin Price’s VET crypto price prediction, the VET token is poised to witness a positive value in the next few years. The projected VET price for 2024 indicates that it may surpass the $0.0600 level, with a potential maximum price value of $0.0688. However, the price could experience a drop to a minimum of $0.0281 by the end of the year.
In 2033, the VET price is anticipated to surpass the $0.60 mark, with the possibility of reaching a maximum level of $0.61 by the end of the year. Moreover, VeChain is expected to maintain a minimum price level of $0.59.
VeChain Price Prediction By CryptoPredictions.com
CryptoPredictions.com’s VeChain price forecast states that, in April 2024, VeChain is expected to commence with a value of $0.02820 and is predicted to finish the month at $0.03061. Within this period, the highest projected price for VET is anticipated to reach $0.04884, while the lowest predicted price is estimated to be $0.02820.
VeChain Overview
| MARKET CAP | VOLUME 24H | CURRENT SUPPLY | PRICE CHANGE (24H) | ALL TIME HIGH |
| $2.0B | $27.7M | 72.7B VET | -0.74% | $0.28 |
VeChain aims to establish a decentralized business ecosystem that promotes transparent information exchange, efficient collaboration, and rapid value transfer.
Presently, business process data in supply chains are isolated within various stakeholder silos, hindering smooth information flow. This fragmented information is further distributed among different stakeholders.
VeChain’s white paper suggests that blockchain can address this issue of information asymmetry, allowing data owners to regain and exercise their ownership rights. The VeChain platform purports to offer a comprehensive perspective on vital information related to a product and its associated business activities—like storage, transport, and supply. This ensures that authorized stakeholders have access to this information, fostering increased market transparency.
VeChain Price History
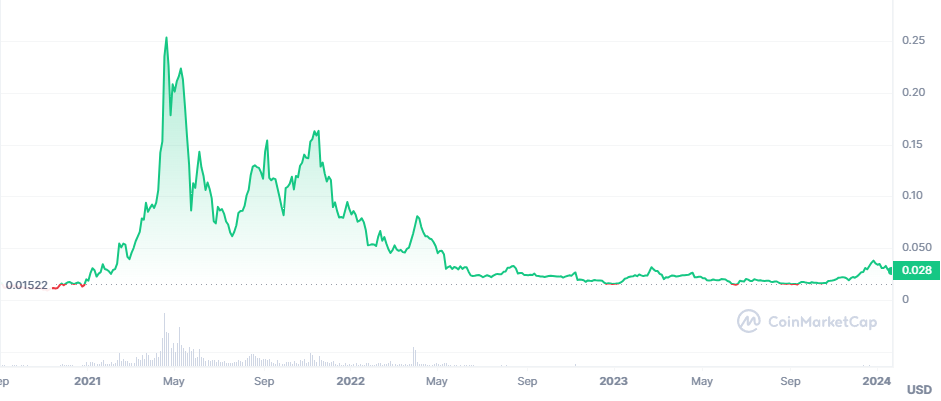
We have already seen VeChain’s (VET) value increase with the usage of Vechain’s blockchain in April and May. This means high adoption of the blockchain by businesses is tied with increased blockchain usage, which directly correlates with the value of the VeChain token. To analyze the forecast of VET’s direction, let’s look at partnerships the ecosystem has already forged.
VeChain partnered with BMW to deploy a card verification system. However, the car verification platform only continues the Vechain-BMW partnership called the Startup Garage.
In 2018, VeChain entered into a partnership with supply chain management company DHL to build smart blockchain solutions for the logistics industry.
Another partnership was between VeChain and PriceWaterhouseCoopers (PWC) to deploy VET as a token for processing various transactions and tracking costs through the supply chain.
Such partnerships and other notable ones like DNV and GL translate to a rapidly growing blockchain ecosystem. VeChain and its VET token will deploy decentralized financial services, applications, and smart contracts across various industries.
The project analysis of the VET coin is overwhelming, and it can soon end the tears and tantrums of the current downtrend with the aim of a tremendous high in the future. However, the collapse of the crypto exchange FTX has created a black hole in the crypto market, forcing VeChain’s whale investors to liquidate massive positions and create selling pressure in the price chart. Hence, our VeChain price prediction aims to bring you an in-depth technical analysis using advanced indicators to identify the current market trend and guide you through a profitable investment plan.
More About the VeChain Network
What is VeChain?
VeChain is a blockchain-based company for creating efficiencies across supply-chain management and logistic processes. The blockchain implements distributed ledger technology (DLT) to deploy bright, complex supply-chain solutions.
Sunny Lui founded VeChain and the VeChain Coin as a robust solution for deploying a decentralized infrastructure of data management applications and the Internet of Things. The founder wanted to solve a highly fraudulent supply-chain industry and resolve economic issues.
Vechain’s applications keep growing, and the project’s scope has broadened. Vechain blockchain features two tokens that are distinct at large and serve different purposes. The Vechain Token (VET) and the VeChainThor Energy (VTHO).
- VTHO is the energy or gas for driving smart contract transactions
- VET is the native token (or digital currency) for transferring value across the network
VeChain Growth
Vechain was founded in July 2017 and incorporated in Singapore. The VeChain Foundation manages the project. Before its inception back in 2015, Vechain was only a project idea for tracking luxury goods to prevent counterfeits.
VeChain, an Asian project, is extending its IoT and supply chain-oriented platform through the development of the VeChain Thor blockchain. The platform’s main objective is to become an enterprise-driven blockchain ecosystem whose primary focus is the governance and usability of smart contract services.
Today, the project conducts business around managing enterprise information across diverse companies. This information is crucial for product verification, supply-chain transparency, and transfer of value and trust across its network.
The following are critical features of the Vechain blockchain that highly influence the Vechain price forecast:
- Vechain is an enterprise-based blockchain that intermediates data through the Internet of Things (IoT) and provides transparent information about organizations, products, and services.
- Vechain has a vision of leading the next generation of Initial Exchange Offerings (IEOs) and Initial Coin Offerings (ICOs) by taking advantage of smart devices on the Internet of Things.
- Vechain blockchain has two tokens, its gas VTHO, and its native token VET.
VeChain Structural Developments
An upgrade called Surface will see the network build up security measures and adaptive tools. It will do this with the implementation of a consensus reached PoA2.0.
An alternative to algorithms like Proof-of-Work (PoW) or Proof-of-Stake (PoS), PoA2.0 will finalize transactions securely, thanks to a three-pronged validation approach combining computer-generated randomness, committee-based blockchain production, and a passive block confirmation process.
These seemingly complicated components allow for a more secure and final blockchain that no one can manipulate.
VET, the native coin of VeChain, is up 10% today as investors become bullish on the upgrade prospects; the coin now rests at a value of over 12 cents. But where might the crypto be heading in the future, given the upgrade passes and sees implementation? Let’s take a look at some VeChain price predictions and see what analysts are thinking.
Understanding VeChain and VET Coin
Vechain intends to use blockchain technology to create a trust-free and decentralized business ecosystem that favors the transparent flow of data, high-speed value transfer, and efficient collaboration across business processes.
Technology firms have normalized compartmentalizing businesses on the supply chain data into silos. These silos cater to multiple stakeholders. As a result, this affects the flow of information divided among participants. Some use applications of the VeChain platform are the following:
- VeChain’s whitepaper suggests blockchain technology should allow ownership of data to empower both ends of a transaction. And therefore, break the asymmetric information problem.
- The blockchain effectively deploys information about products, business processes, storage, organizations, and transportation. This eventually creates greater market transparency and makes it convenient for market participants to transact.
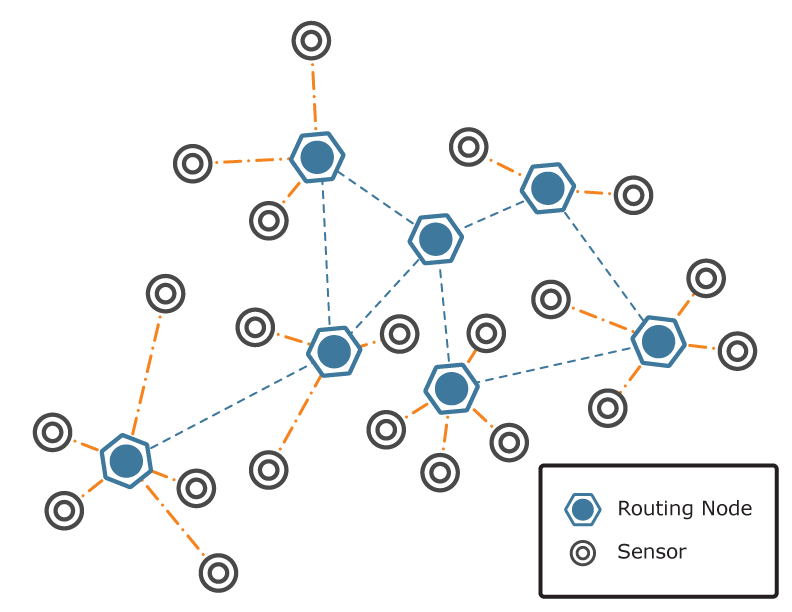
- The VeChain blockchain is used across diverse industries to track quality, storage data, temperature, authenticity, last-mile delivery, and transport medium logistics. It achieves this by implementing Radio Frequency Identification (RFID) sensors and tags. Authorized Supply chain participants can access these pieces of information anywhere and in real time.
- VeChain allows product manufacturers and merchants can constantly track and monitor all parameters with sensors and tagging.
- The sensors ensure that product manufacturers and merchants can constantly track and monitor all parameters from manufacturing and packaging to delivery.
- If a problem is encountered along the way, the blockchain communicates back to an authorized person.
Both VeChain (VET) and VTHO are run on the VeChain Thor Blockchain platform. Both means of value transfer are decentralized and can be used by decentralized applications already hosted on the VeChain blockchain.
VeChain seems to have borrowed its dual token idea from Ethereum’s Ethereum (ETH) and NEO gas. However, unlike Ethereum’s lack of predictability when estimating transaction fees, VeChain builds upon a predictable economic model for simplifying decentralized finance.
What can you do with VeChain?
- Enterprises – The blockchain has already built a support infrastructure to help the growth of enterprises by bootstrapping underlying technology, utilities, and services.
- Community – The blockchain supports community developers and blockchain programmers to kickstart their projects on the ecosystem and bring about diversity across the platform.
- Institutional Partners/regulators – to support its mission of helping startups, incubation partners, and venture capitalists bring in their input regarding expertise, resources, and capital.
The transaction token on the blockchain is the VET utility token. This design is highly in favor of businesses dealing with large volumes of settlements. However, the following are different ways your business can adopt Vechain in its ecosystem.
Food and Beverage Businesses
- Owners of food and beverage enterprises can use Vechain’s ecosystem to transact transparently.
- The blockchain allows them to scan QR codes on their preferred products and the system automatically provides consumers with desired information about the product.
- Such information includes geographical location, inspection reports, dates, ingredients, source of ingredients, and cryptographic data.
- As a result, a brand will improve transparency on its supply chain to reduce costs for third-party verification and collaborate with other participants, such as insurance firms and financing institutions.
Startups
- Vechain’s blockchain has put various systems to help startups bootstrap growth from scratch.
- Startup founders will find tools for technical documentation and acquire direct support from Veechain’s support team.
Digital Vehicle Management
- Uber sparked a fleet of vehicle management companies. Vechain provides users with an effective digital vehicle passport solution that stores and secures crucial data throughout the lifetime of an automobile.
- Financial institutions, vehicle manufacturers, insurance providers, vehicle repair enterprises, and technical experts can use the Vechain blockchain for the authorized sharing of data.
- This will make information about ownership, servicing history, and usage more transparent across the automobile industry.
Luxury Product Manufacturers
- VeChain creates unique identity links between their brands and their physical products.
- Luxury product brands compete for market attention by creating high-value product designs.
- Brands can now use VeChain to establish a unique identity link between their brands and their physical products. The links are customized using smart NFC tags.
- Finally, competing brands can implement the blockchain’s product verification to boost the traceability of stolen goods across the supply chain.
VeChain Fundamental Analysis
Determine if a coin is undervalued or overvalued by looking at different factors affecting its intrinsic value.
Fundamental analysis is an excellent way to understand how the market affects prices crypto values always change. We need to look at whether a coin is overvalued or undervalued. VeChain is a promising blockchain company, but why should VeChain be a part of your portfolio?
Before investing in any cryptocurrency, here are factors to consider:
- The utility of the coin – Read through the coin’s whitepaper and identify what problems it solves. Find out whether the coin has any real-world applications and can be used for transactions, smart contracts, and payments. Conduct a comparison analysis between the coin and other similar cryptocurrencies.
- Study the Team – Go through the coin’s about page and research its founders. Find out whether they are experienced, legitimate and honest. Also, check the coin’s market capitalization to establish the liquidity of the cryptocurrency.
- Demand and Supply – The utility of a coin is directly proportional to its demand. Remain aware as well that higher supply than demand might ruin the value of a coin. The supply should be fixed, and the coin should have a real-world solution to an aching problem.
- Valuation – Do not go for a coin because it costs a fraction of the dollar. Analyze the coin’s valuation, the number of users on its blockchain, and if the user volume is higher than the price – that’s an overpriced coin.
VeChain (VET) is a good investment because of its ascending trajectory in a market that has remained volatile, which, in turn, hinges on the coin’s solid partnerships and its prominence of the coin in the value chain.
How Does Vechain Make Money?
VeChain holders can stake or HODL their VET to earn some passive cash. Staking refers to storing cryptocurrency funds in a locked wallet.
The funds maintain the operations of the blockchain ecosystem and execution of proof of stake. They share some similarities with cryptocurrency mining since they both achieve network consensus. In turn, the blockchain rewards users for staking.
You can also HODL VeChain to generate some profits. To HODL is to store a coin until it gains more value. However, a HODLING strategy should be long-term and inclined towards increasing the asset’s value in the future.
VeChain’s economic model is an essential discussion about how Vechain makes money. It turns out that VTHO indicates the underlying costs of VeChain usage. The blockchain consumes VTHO after the ecosystem performs certain operations.
On the other hand, the Vechain (VET) functions create value transfer and build up rapid circulation and liquidity of the token across the blockchain. Furthermore, the blockchain also awards network nodes with some VET foto to facilitate the network’s growth.
This easy-to-use VeThor (VTHO) stacking calculator is based on live Economic- and X-node data. Just enter your VET holding, select your node tier and click “calculate.”
Economic- and X-node holders receive a bonus VeThor (VTHO) reward from two dedicated reward pools held by the VeChain Foundation. These bonus rewards depend on all participating Economic- and X-nodes, their node tiers, and all eligible participants’ overall VeChain (VET) holding.
VeChain Stats show how the VeChain Ecosystem is stabilized.
Note that the nodes are never part of VeChain’s economic model but only a means of boosting and stabilizing the VeChain ecosystem. Finally, VeChain’s whitepaper suggests the blockchain automatically generates VTHO through holding VET tokens.
Therefore when a user holds onto some VET, the blockchain will award them VTHO.
The VTHO can be used as a medium of value transfer, traded, or implemented when running decentralized applications hosted on the Thor blockchain. Also, VET can be traded against other currencies on any cryptocurrency exchange.
Does VeChain (VET) have a bright future?
VeChain’s token valuation is directly proportional to the cost of using the blockchain. However, usage of the blockchain depends on whether a user is carrying smart contract transactions or payment transactions. Again, VeChain (VET) value goes up as usage of the blockchain rises. Furthermore, and as earlier mentioned, the platform supports those who hold VET by enabling them to conduct VET transactions at no cost. This is because having VET guarantees the user some free VTHO. VeChain has a future and is probably a good investment for the following reasons:
- It looks beyond the supply chain market
As mentioned earlier, the VeChain project focuses on bringing traceability and transparency to the supply chain industry. However, the project is tapping into other areas, such as competing with Ethereum for a decentralized application platform.
- Benefits from strong foundation support
The VeChain foundation supports the VeChain project and handles all development activities, growth and research. The foundation also networks and builds partnership capacity on behalf of the blockchain.
- Has solid partnerships
We mentioned earlier the kinds of partnerships that VeChain has already signed.
The blockchain is already helping reputable enterprises track goods, employ traceability and create efficient supply chains. BMW, Bayer, PwC, GL, DHL, and DNGV.
These partnerships prove the blockchain project is here for the long term and is meant to build more icebreaking solutions.
- Reputable team
The blockchain is backed up and managed by a reputable team of developers and sales professionals. This enables them to deliver high-end products for use in the real world.
- Academic backing from Oxford University
VeChain is in partnership with Oxford University’s Department of Technology Research. The partnership is meant to boost the development of the blockchain’s architecture.
Oxford University is researching new ways of building proof mechanisms and smart contracts for VeChain.
With such a collaboration with a reputable university and backing from reputable firms, more businesses will implement VeChain’s smart solutions.
- VeChain is a Fresh Project in Progress
Most people and businesses are usually inclined towards bootstrapping along with fast-growing technology. VeChain is a project in progress that could attract more firms and partnerships. This is mainly because it’s easy to tweak and implement a project in progress, which helps it become even better, robust, and dependable.
Also Read:
• How To Buy Vechain?
• How To Stake Vechain?
Conclusion
VeChain regards transparency in information exchange on a global level as the primary catalyst for business collaboration and rapid value transfers. Its objective is to connect businesses, application users, smart contracts, and infrastructure providers within a unified ecosystem that prioritizes symmetrical and transparent information flow based on data digitization.
VeChain’s innovative and forward-thinking approach to supply chain management has positioned it as a top player in the crypto industry. With its strong focus on transparency, security, and efficiency, VeChain has the potential to revolutionize the way businesses operate on a global scale. However, it is advised to do your own research before investing in the volatile crypto asset
Since its inception in 2015, VeChain has proved to be one of the dominating projects in the crypto space and aims to continue its legacy in the future. VeChain stands out among other projects due to its blockchain-based exclusive designs, which provide enterprise-level solutions to make the future road smoother. Furthermore, VeChain has also made a significant contribution when it comes to the evolution of the global economy based on the combination of DLT with an IoT stimulant.
VeChain has already developed a working and practical blockchain solution for the supply chain management. The practical solutions have already attracted partners from various industries to join the bandwagon. Such sectors include manufacturing, luxury goods, and automobiles, among others. Health facilities can use Vechain to track medicines, and the anti-counterfeiting mechanism effectively wipes out the black market trade of medicines.
The general support for VeChain and VeChain products is high, and VET generally commands a good reputation among crypto projects. VeChain also has a strong team behind it. The rest of the team also has a solid background and track record in information technology. There is no telling where VeChain is headed, but we can look at the stars for now. The currency has a good standing for investing, holding, and solving real-world applications.
The above-mentioned VeChain price predictions suggest that the coin has a bright future and is expected to show consistent positive growth in the next few years. However, it is important to note that the cryptocurrency market is highly volatile, and any adverse development could lead to a sharp decline in prices. Consider the past milestones when deciding to add VeChain to your portfolio.
- The Vechain ecosystem is used today by big enterprises with a dedicated team of developers and networks committed to the WEB3. Vechain use cases set it apart from its competitors and popular meme coins, giving it the green light for long-term sustainability.
- VeChain aims to develop a platform that adds significant value to the blockchain world, and the VET token significantly benefits the cryptocurrency market.