Tectonic Price Prediction 2024-2033
- Tectonic Price Prediction 2024 – up to $0.00000021
- Tectonic Price Prediction 2027 – up to $0.0000007
- Tectonic Price Prediction 2030 – up to $0.000002
- Tectonic Price Prediction 2033 – up to $0.000007
Tectonic is one of the initial blockchain projects with prospects in the digital economy. Investors and traders are already asking questions about the reliability of the Tectonic price predictions, and we attempt to answer them with this Tectonic Price Prediction.
What’s on the horizon for TONIC? Tectonic is a cross-chain money market at the heart of Cosmos and Ethereum, empowering users to earn passive yields on their Cosmos and Ethereum-based assets and access instant crypto-backed loans.
How much is TONIC (Tectonic) worth?
Today’s Tectonic price is $0.0000001383, with a 24-hour trading volume of $49,532. Tectonic is up 1.66% in the last 24 hours. The current CoinMarketCap ranking is #763, with a live market cap of $34 million. The circulating supply is 247,733,879,909,099, and a maximum supply of 500,000,000,000,000 TONIC coins.
We will examine the Tectonic network, its native token, past price analysis, developments, and price predictions for the coming years.
TONIC Price Analysis
TONIC’s price is down 25.58% in the last 12 months and up 9.66% over the previous 30 days, at press time. Like most altcoins, TONIC’s recovery began in October 2023, affected by market macroeconomics, such as the spot Bitcoin ETF approval and halving.
Is Tectonic a Good Investement?
The Tectonic platform provides highly competitive rates to its users, making it the largest money market on Cronos. The price, however, has been highly volatile, a roller coaster over the past year. Most traders consider it a great investment. Our Cryptopolitan Price Prediction section will show how the coin will gain value in years to come.
Tectonic Price Prediction
Tectonic Price Prediction by Cryptopolitan
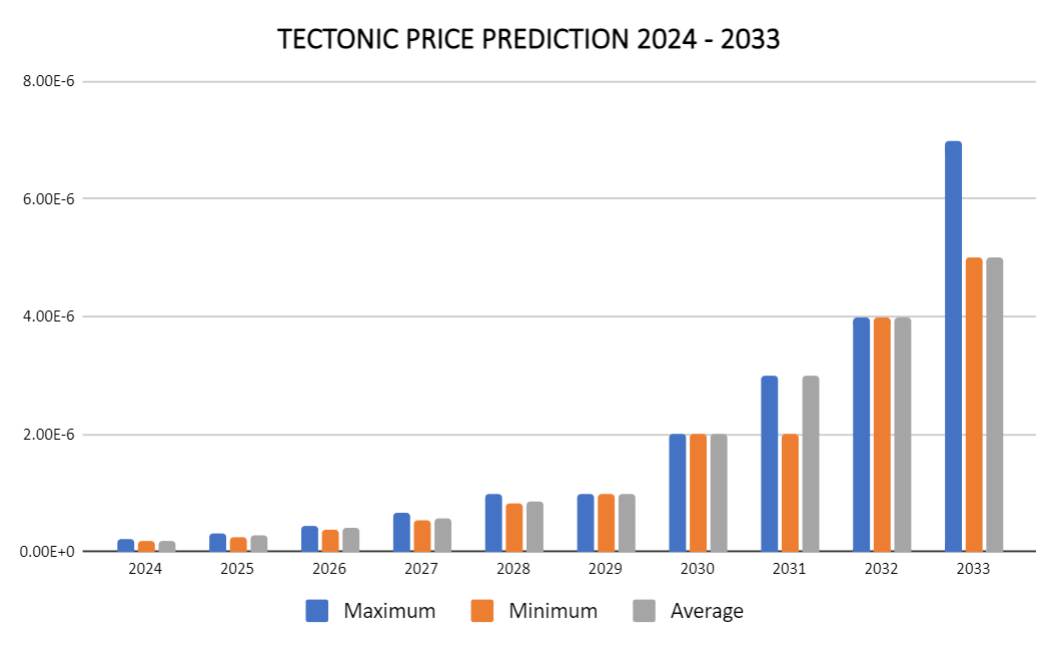
| Year | Minimum Price | Average Price | Maximum Price |
| 2024 | $0.00000018 | $0.00000019 | $0.00000021 |
| 2025 | $0.00000026 | $0.00000027 | $0.00000031 |
| 2026 | $0.00000039 | $0.00000040 | $0.00000045 |
| 2027 | $0.0000006 | $0.0000006 | $0.0000007 |
| 2028 | $0.0000008 | $0.0000009 | $0.000001 |
| 2029 | $0.000001 | $0.000001 | $0.000001 |
| 2030 | $0.000002 | $0.000002 | $0.000002 |
| 2031 | $0.000002 | $0.000003 | $0.000003 |
| 2032 | $0.000004 | $0.000004 | $0.000004 |
| 2033 | $0.000005 | $0.000005 | $0.000007 |
Tectonic Price Prediction 2024
Our TONIC token price prediction for 2024 will reach a maximum of $0.00000021, which might mark a turning point for the cryptocurrency. Shortly, both are expected to pull back to a minimum price of $0.00000018 and an average price of $0.00000019.
Tectonic Price Prediction 2025
Our TONIC Price prediction for 2025 shows that the Tectonic token prices will increase from their current price. We expect the coin to reach a minimum price of $0.00000026 with an average price of $0.00000027 and hit a high of $0.00000031.
Tectonic Price Prediction 2026
Our TONIC price forecast for 2026 is expected to hit a maximum price of $0.00000045. The average price of the coin is predicted to be $0.0000004, with a minimum price of $0.00000039.
Tectonic Price Prediction 2027
Our Tectonic price prediction for 2027 is a maximum price of $0.00000068. The coin is expected to hit its lowest price at $0.00000055. The average trading price of the currency is expected to be $0.00000057.
Tectonic Price Prediction 2028
Our Tectonic price prediction for 2028 is anticipated to skyrocket, reaching a maximum of $0.00000097. A minimum price of $0.00000083 is also probable, and the prices could retrace soon to reach an average price of $0.00000085.
Tectonic Price Prediction 2029
Our Tectonic price prediction for 2029 shows that the Tectonic could have a bull run, and the price could rise and attain a maximum price value of $0.000001. Although the price is seen to rise from the previous year, the coin will have to experience a minimum price of $0.000001 and an average trading price of $0.000001.
Tectonic Price Prediction 2030
Our Tectonic forecast for 2030 is expected to hit a high of $0.000002. For the same year, we anticipate that Tectonic will cost an average of $0.000002 and a minimum of $0.000002.
Tectonic Price Prediction 2031
Our Tectonic price prediction for 2031 is a maximum of $0.000003. For the same year, we anticipate that the price of Tectonic will range between a low of $0.000002 and keep a constant average of $0.000003.
Tectonic Price Prediction 2032
Our Tectonic price prediction for 2032 expects the Tectonic to reach a minimum price of $0.000004, an average of $0.000004, and it is expected by the end of the year to have reached a maximum price of $0.000004.
Tectonic Price Prediction 2033
Our Tectonic price prediction for 2033 is a maximum value of $0.000007. The Tectonic price should be around an average of $0.000005 and a minimum value of $0.000005 for the same year.
Tectonic Price Predictions by Walletinvestor
Wallet Investor uses technical analysis to provide the TONIC price forecast. According to the platform’s price prediction, Tectonic’s past performance index rating is D; it adds that TONIC would make a ‘not so good’ one-year investment. The expected average price in 2025 will be $0.000000144. Tectonic’s return on investment (ROI) will be 4.1% in 2025; in 2026, it will be 27.6%; in 2027, it will be 27.2%.
Tectonic Price Predictions by CryptoPredictions
The site scans a coin’s exchange rates and other historical Tectonic market data and uses these data to provide a Tectonic price forecast. In 2025, TONIC will trade at an average price of $0.0000002056 in January and $0.0000002584 in December. In 2027, TONIC will sell at an average price of $0.0000003103 in January and $0.0000003464 in December.
Tectonic Price Predictions by Digitalcoinprice
Tectonic will be on a bullish trend from 2024 to 2033; the maximum value of TONIC for the entire duration will be $0.00000269. In 2025, it will trade at a mean price of $0.000000343. It will reach a maximum price of $0.000000358 and a minimum of $0.000000343. In 2027, it will trade at a mean price of $0.000000602. It will reach a maximum price of $0.000000628 and a minimum of $0.000000531. In 2033, it will trade at a mean price of $0.00000266. It will reach a minimum of $0.000002259.
Tectonic Price Prediction by Industry Influencers
Fox Kadabra analyzes Tectonic price on YouTube, highlighting the coin’s growth in terms of holders due to its relatively low price. However, he also points out the coin’s low trading volumes and market capitalization. To become a millionaire, from holding $1,000 in TONIC, it would have to be listed on top-tier exchanges and in a bullish market.
Overview
| MARKETCAP | CIRCULATING SUPPLY | ALL-TIME LOW | POPULARITY | ALL-TIME HIGH |
| $34 million | 247,733,879,909,099 | $0.000004029 | #763 | $0.0000000851 |
Tectonic Price History
According to the historical data obtained from Coinmarketcap, Tectonic (TONIC) got listed on December 23, 2021, with an opening price of $0.000004027 and a trading volume of $7,695,883. TONIC reached its ATH of $0.000004029 on the same day. A few days later, the token experienced a sharp decline in trading volume and price due to massive selloffs and the general plunge in the crypto market.
By December 2022, the price of TONIC had bottomed to its all-time low (ATL) level at $0.00000008151.
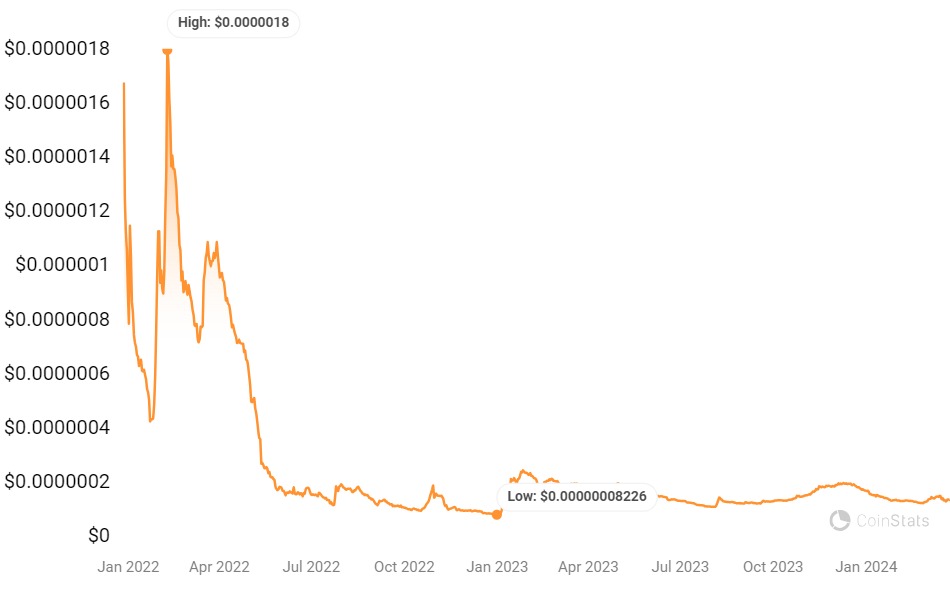
Source: https://coinstats.app/coins/tectonic/
More About Tectonic
What is Tectonic?
Tectonic is an algorithmic-based decentralized non-custodial money market protocol that allows users to access instant loans as liquidity borrowers or earn passive yield by supplying assets. The architecture and design of the Tectonic protocol are based on Cronos blockchain technology, making it interoperable with the ATOM and ETH blockchains. The Tectonic platform, launched in late 2021 shares similarities with popular Decentralized Finance (DeFi) platforms.
The Tectonic protocol aims to provide users with seamless and secure digital currency money market functionalities. Tectonic users can borrow liquidity from the market by providing collateral that exceeds the value of the borrowed asset. They can also provide liquidity to generate passive income. The returns on assets deposited by Tectonic liquidity providers are based on dynamic rates dictated by market demands.
Tectonic benefits include:
- Users can access other cryptocurrencies for DeFi or bonding without liquidating their original coins.
- Traders can take crypto loans for short-term trading or farming opportunities.
- TONIC holders can earn interest by providing assets to the Tectonic protocol without actively managing their assets.
What is TONIC?
The native token of the Tectonic protocol is TONIC, which powers the ecosystem’s incentive program. TONIC has a total supply of 500 trillion tokens. The somewhat ridiculous supply of the token has generated skepticism among potential investors. However, the development team has reiterated its asset’s good spread.
Native token distribution
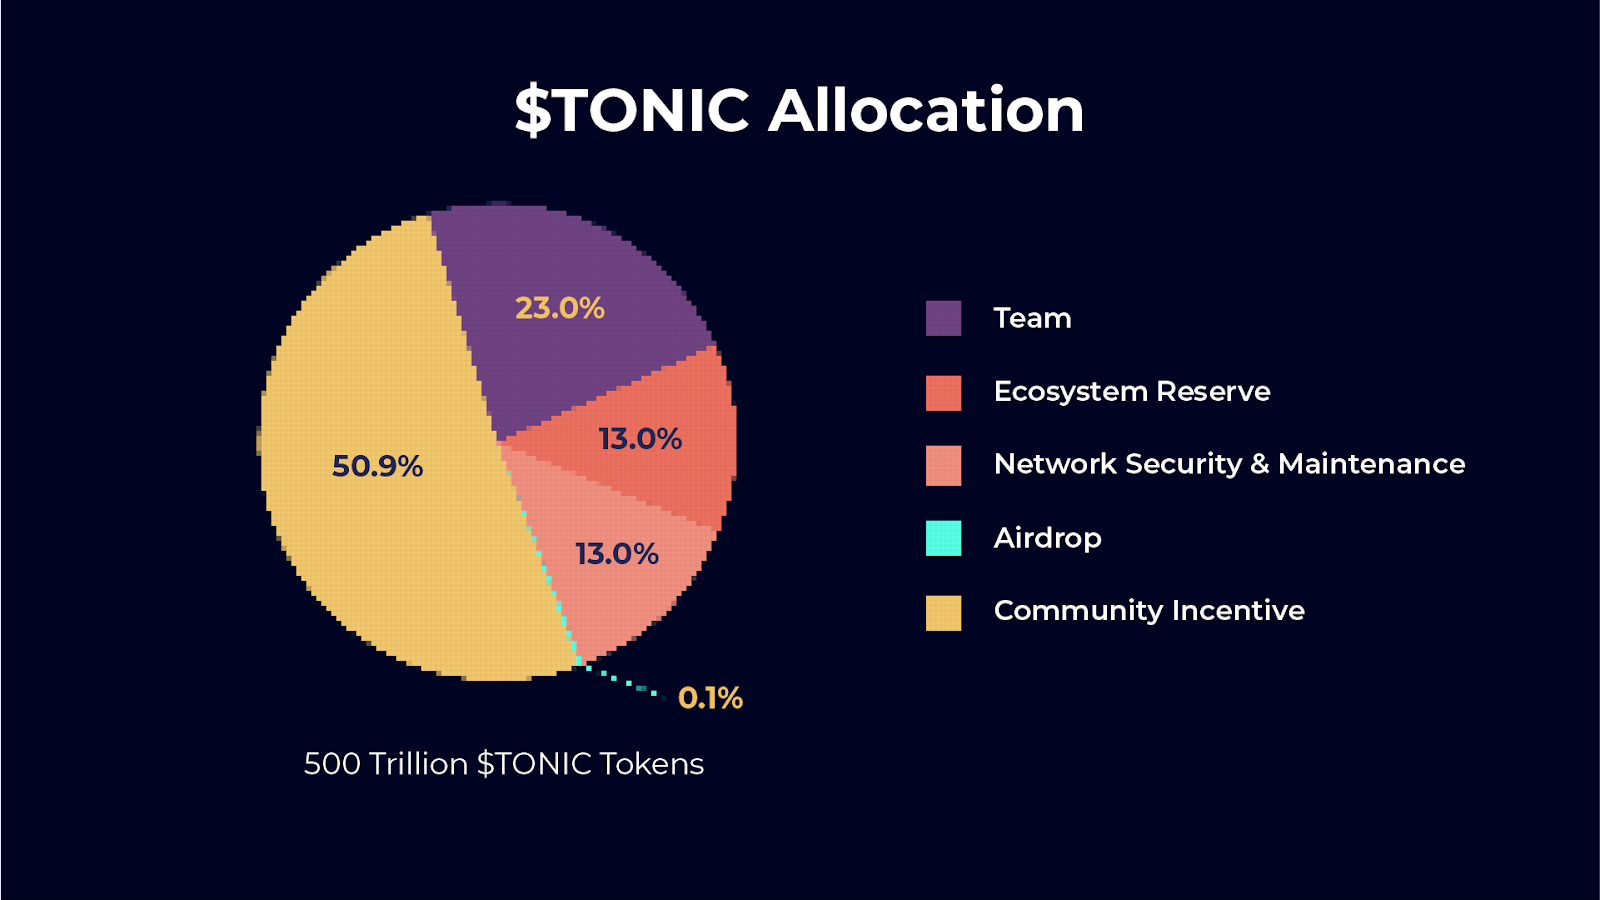
According to Tectonic tokenomics, 23 percent of TONIC’s supply is allocated to the protocol team. This allocation has a vesting period of 4 years and a daily release clause. Also, the project development team has earmarked 13 percent or 52.5 trillion tokens for ecosystem-related initiatives, partnership development projects, advisory teams, etc. In this case, there is no stipulated vesting schedule, and the tokens will only be released for activities according to the growth of the Tectonic ecosystem.
Community incentivisation gets a whopping 50.9 percent of TONIC’s total supply. Members participating in community activities and protocol operations receive participation incentives, including mining and staking rewards paid in another equivalent token.
TONIC token allocation from Tectonic
TONIC allocates 0.1 percent of its total supply to airdrops, and the remaining 13 percent is reserved for network security and maintenance, such as security audits, infrastructure upgrades, etc. Security and maintenance allocation also has no vesting schedule and is unlocked upon protocol launch.
Conclusion
Tectonic is a blockchain platform that enables developers to build decentralized applications. The platform is built on the TONIC blockchain, a fork of the Ethereum blockchain. Tectonic has its own native token, called TONIC, which is used to power the platform and its applications. It is listed in major crypto exchanges like crypto.com.
According to our projections and the industry experts, Tectonic seems to be a good long-term investment. Remember, however, that cryptocurrencies are volatile, and thus, the prices could rise and fall sharply. We advise you to do your own research before making any investment decisions.