
BTC Price Predictions 2024-2033
- Bitcoin Price Prediction 2024 – up to $1,10,203
- Bitcoin Price Prediction 2027 – up to $3,43,302
- Bitcoin Price Prediction 2030 – up to $11,22,987
- Bitcoin Price Prediction 2033- up to $31,09,892
How much is Bitcoin (BTC) worth?
Today, the price of Bitcoin stands at $65,269, with a trading volume over the past 24 hours reaching $24 billion. Its market capitalization is $1.3 trillion, and it currently commands 54% of the market share. Over the last 24 hours, the BTC price has experienced a 0.03% decrease. As for its circulating supply, 19.46 million BTC are in circulation out of a maximum possible supply of 21 million BTC.
Bitcoin price analysis: BTC price declined heavily as it dropped toward $64K
TL; DR Breakdown
- BTC price analysis shows that Bitcoin faced a bearish pattern as the price dropped below $65K
- Resistance for BTC is present at $67,297
- Support for BTC/USD is present at $63,256
The BTC price analysis for 25 April confirms that bears sparked a solid selling pressure as BTC price plunged buying confidence by heading below the $65K mark. However, BTC price is facing a minor upward correction now.
BTC price analysis 1-day chart: Bitcoin price faces intense bearish pressure
Analyzing the daily price chart of Bitcoin, BTC’s price faced a robust selling pressure as the price continued to decline below immediate Fib channels and headed toward the $64K level. However, the price is facing a surge in buying demand near the recent low. The 24-hour volume has surged to $2.18 billion, showing an increased interest in trading activity today. BTC price is currently trading at $65,269, decreasing by over 0.03% in the last 24 hours.
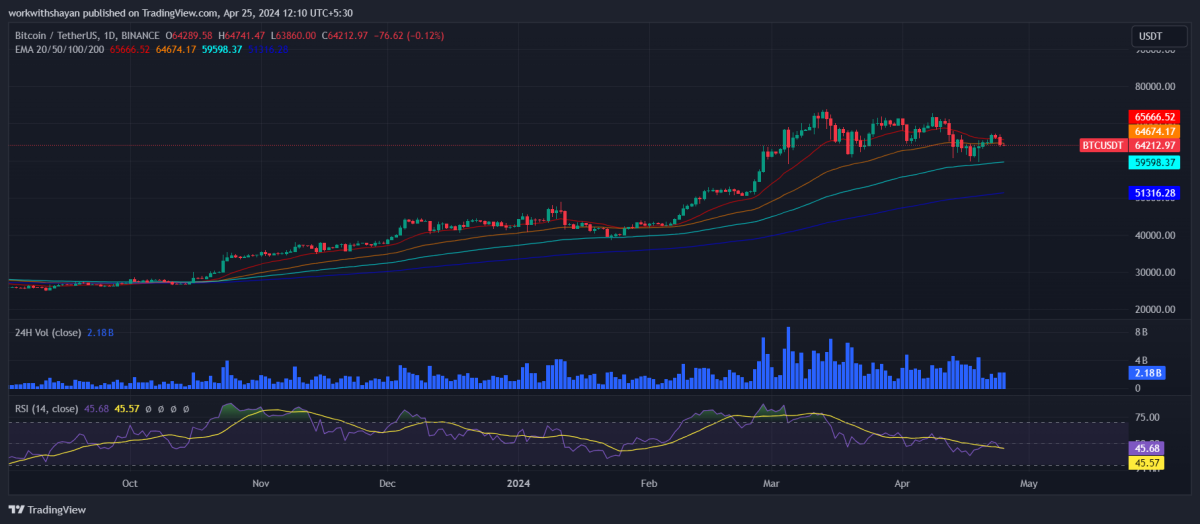
The RSI-14 trend line has declined from its previous level and currently trades below the midline at level 45, hinting that a bearish pressure is on the edge. The SMA-14 level suggests volatility in the next few hours.
BTC/USD 4-hour price chart: Bulls aim for an immediate correction above moving averages
The 4-hour Bitcoin price chart suggests that bears are strengthening their position as they are aiming to send the price below the Fib lines. However, bulls are maintaining buying confidence and are aiming to hold the price above the EMA20 trend line.
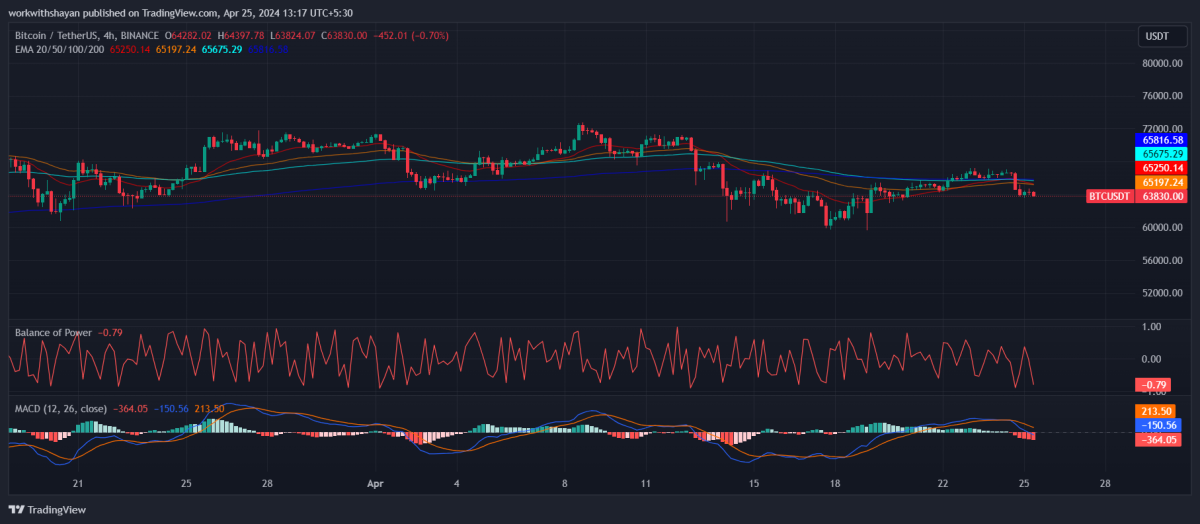
The BoP indicator is trading in a negative region at 0.79, showing that short-term sellers are taking a chance to accelerate a downward trend.
Additionally, the MACD trend line has formed bearish candles below the signal line and the indicator aims for a negative momentum, strengthening short-position holders’ confidence.
What to expect from BTC price analysis next?
The hourly price chart confirms that Bitcoin attempts to drop below the immediate support line; however, bulls are eyeing for further recovery rally in the upcoming hours. If BTC’s price successfully holds its momentum above $67,297, it will fuel a bullish rally to $71,145.
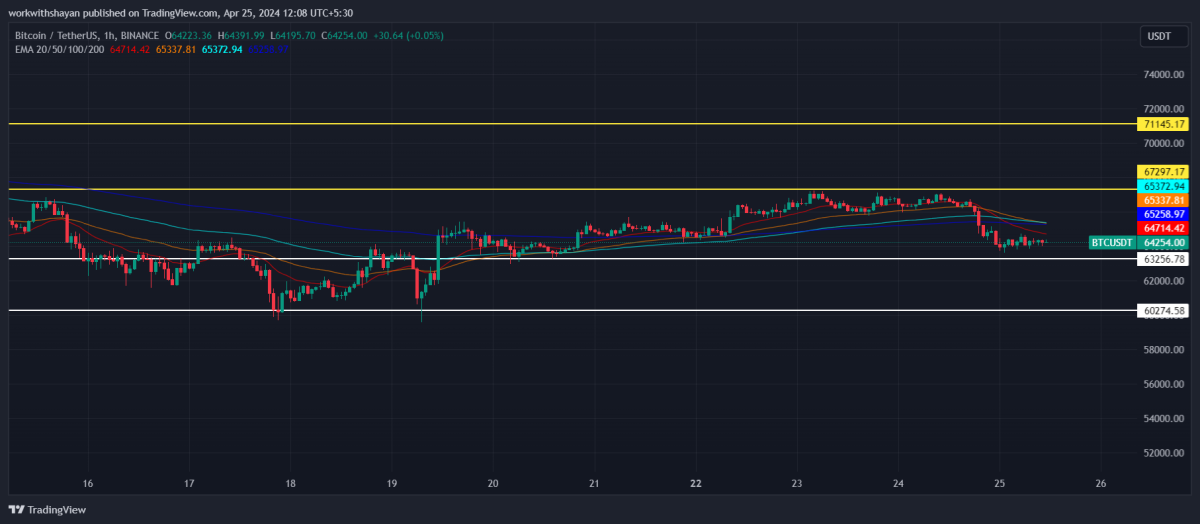
If bulls fail to initiate a surge, BTC price may drop below the immediate support line at $63,256, which may begin a bearish trend to $60,274.
Is Bitcoin A Good Investment?
Bitcoin has historically presented the opportunity for significant returns due to its decentralized nature. Bitcoin also holds the potential to act as an asset that does not correlate with the broader market trends, akin to gold. This characteristic suggests that it could move independently of other assets such as stocks. Additionally, the recent launch of spot Bitcoin ETFs has made it a good investment option with bright market potential.
Recent BTC News/Opinions
Blackrock’s IBIT: Blackrock has a Bitcoin fund called the Ishares Bitcoin Trust (IBIT). This fund, which deals with Bitcoin directly, has increased its Bitcoin holdings to more than 252,011 BTC. This means the fund’s Bitcoin is worth about $18 billion now. There’s a big increase in interest from small investors, more than what Blackrock’s boss thought would happen.
Morgan Stanley In Bitcoin ETF: Morgan Stanley is planning to add Bitcoin funds to its brokerage platform. This comes after the SEC approved spot Bitcoin ETF in January.
SEC Approves Spot Bitcoin ETF: The U.S. has approved spot Bitcoin ETF. The Securities and Exchange Commission announced this decision on 11 January.
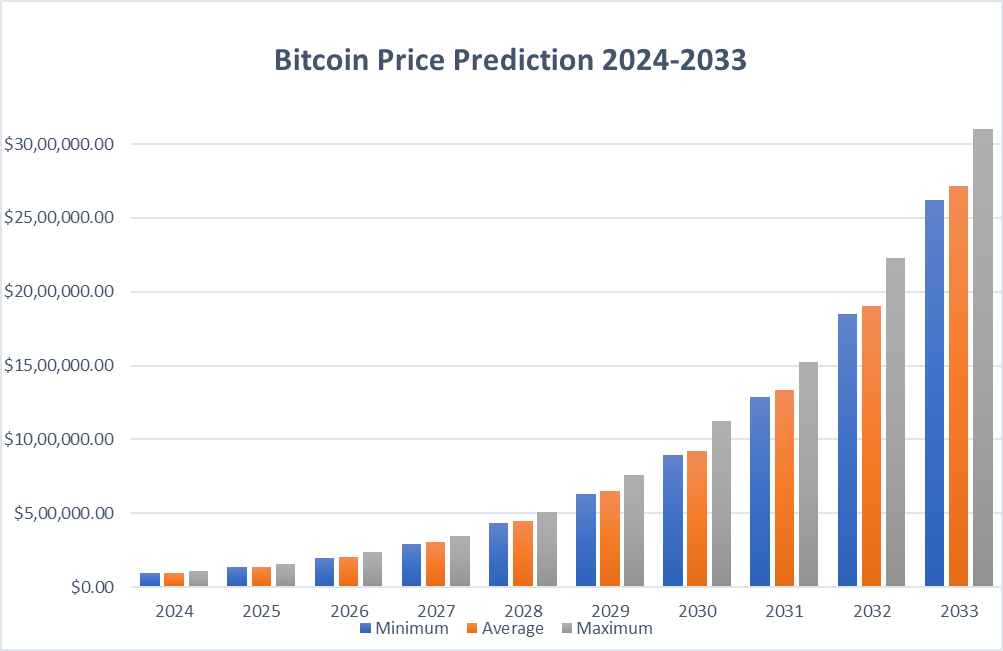
Bitcoin Price Predictions 2024-2033
Price Predictions By Cryptopolitan
| Year | Minimum ($) | Average ($) | Maximum ($) |
| 2024 | 93,269.00 | 96,768.00 | 1,10,203.00 |
| 2025 | 1,35,384.00 | 1,39,255.00 | 1,58,198.00 |
| 2026 | 1,95,360.00 | 2,02,323.00 | 2,39,224.00 |
| 2027 | 2,92,569.00 | 3,02,686.00 | 3,43,302.00 |
| 2028 | 4,36,287.00 | 4,48,394.00 | 5,08,574.00 |
| 2029 | 6,33,596.00 | 6,51,532.00 | 7,60,170.00 |
| 2030 | 8,93,504.00 | 9,19,565.00 | 11,22,987.00 |
| 2031 | 12,90,182.00 | 13,36,160.00 | 15,24,028.00 |
| 2032 | 18,50,345.00 | 19,03,792.00 | 22,29,599.00 |
| 2033 | 26,17,633.00 | 27,12,822.00 | 31,09,892.00 |
Bitcoin Price Prediction 2024
The BTC price is expected to hit a minimum of $93,269 in 2024, with the potential to reach up to $110,203. The average price forecast stands at $96,768.
Bitcoin Price Prediction 2025
The forecast for 2025 suggests Bitcoin could reach a low of $135,384 and may climb to a high of $158,198, with an average price of $139,255.
BTC Price Forecast for 2026
Bitcoin’s value in 2026 is anticipated to fall not lower than $195,360, with a ceiling of $239,224. The expected average price is $202,323.
Bitcoin (BTC) Price Prediction 2027
In 2027, Bitcoin is forecasted to have a minimum price of $292,569 and may reach a maximum of $343,302, averaging at $302,686.
Bitcoin Price Prediction 2028
Predictions for 2028 indicate a minimum Bitcoin price of $436,287, with the potential for a high of $508,574. The average price is expected to be $448,394.
Bitcoin Price Prediction 2029
The minimum price for Bitcoin in 2029 is forecasted at $633,596, with a maximum potential of $760,170. The average price is anticipated to be $651,532.
Bitcoin (BTC) Price Prediction 2030
For 2030, Bitcoin is expected to reach a minimum of $893,504 and could rise to $1,122,987, with an average trading price of $919,565.
Bitcoin Price Forecast 2031
By 2031, Bitcoin’s price could hit a minimum of $1,290,182 and a maximum of $1,524,028, with the average price projected at $1,336,160.
Bitcoin (BTC) Price Prediction 2032
The forecast for 2032 suggests a minimum price of $1,850,345 for Bitcoin, with a potential high of $2,229,599. The average price is expected to be $1,903,792.
Bitcoin Price Prediction 2033
In 2033, Bitcoin’s price is predicted to be at least $2,617,633, with the possibility of reaching $3,109,892. The average trading value is forecasted at $2,712,822.
Bitcoin Price Prediction By Coincodex
According to the current Bitcoin price prediction by Coincodex, it is forecasted that the price of Bitcoin will increase by 27.37% to reach $89,852 by May 1, 2024. Technical indicators suggest a bullish sentiment, while the Fear & Greed Index indicates extreme greed at a level of 79.
Over the past 30 days, Bitcoin has seen 17 out of 30 days (57%) in the green, with a price volatility of 4.18%. Coincodex’s forecast suggests that it is currently a favorable time to purchase Bitcoin. Reflecting on historical price trends and BTC halving cycles, Coincodex estimates the yearly low for Bitcoin in 2025 to be around $71,247, with a potential high reaching up to $160,024 the following year.
Bitcoin Price Prediction By Digital Coin Price
According to Digital Coin Price, there is a forecast suggesting that Bitcoin could surpass the $181,098.63 mark and sustain its market position by the end of 2025. It is estimated that the lowest Bitcoin price may range between $151,521.25 and $181,098.63, with the most probable price stabilizing at approximately $165,414.37 by the close of 2025. Despite the significant fluctuations in its value and the debates over its environmental impact due to energy consumption, billionaire venture capitalist Tim Draper maintains his forecast that Bitcoin will hit $181,098.63 by the end of 2025 or early in the year.
Further predictions by Digital Coin Price indicate that by 2032, Bitcoin’s price could minimally reach $968,037.25, with an average trading price throughout the year of $999,217.60, potentially peaking at $1,013,559.06. Experts from Digital Coin Price anticipate the maximum trading price to hover around $999,217.60.
Bitcoin Price Prediction By CryptoPredictions.com
Cryptopredictions.com forecasts that Bitcoin will begin May 2024 at a value of $51,587.956 and conclude the month at $51,833.923. Throughout May, the maximum projected BTC price is anticipated to reach $68,302.039, while the minimum price could drop to $46,445.386.
BTC Price Overview
The price of Bitcoin had experienced notable peaks and troughs in its value. Despite this volatility, the unique nature of the Bitcoin network and its limited supply of coins has attracted the attention of investors and traders worldwide. The blockchain technology underlying Bitcoin enables secure and transparent transactions without the need for intermediaries, making it an attractive alternative to traditional financial systems.
In recent years, Bitcoin has trended upwards, with significant increases in value occurring in 2017 and 2021. This growth has been driven by a variety of factors, including increased adoption and acceptance of Bitcoin as a form of payment, as well as speculation by investors and traders. Today, Bitcoin is trading at +56654654.6% above its all-time low in July 2010.
While the future of Bitcoin’s price remains uncertain, many experts predict that the trend towards increased adoption and acceptance of digital currencies will continue to drive demand for Bitcoin and other cryptocurrencies.
BTC Price history
Bitcoin’s (BTC) price again reached an all-time high in 2021, as values exceeded over 65,000 USD in November 2021. That particular price hike was connected to the launch of a Bitcoin ETF in the United States, whilst others in 2021 were due to events involving Tesla and Coinbase, respectively.
Tesla’s announcement in March 2021 that it had acquired 1.5 billion U.S. dollars worth of the digital coin fueled mass interest. The market was noticeably different by the end of 2022, however, with Bitcoin prices reaching roughly $17194.91 as of January 10, 2023, after another crypto exchange, FTX, filed for bankruptcy.
Large BTC holders – ‘whales’ – are said to make up two percent of anonymous ownership accounts, and own approx 92 percent of BTC. As most people who use cryptocurrency-related services worldwide are retail clients rather than institutional investors, Bitcoin prices are difficult to measure, as movements from one large whale already have a significant impact on this market.
More on Bitcoin
What is Bitcoin?
Launched in 2009, Bitcoin is a decentralized digital currency powered by blockchain technology. Satoshi Nakamoto created the coin to overcome the shortcomings of government-issued currencies without requiring a controlling authority.
Bitcoin (BTC) was created out of the need for a cryptography-based e-payment system rather than the conventional trust-based system. Cryptocurrency acts as a store of value and a payment method for any transaction process in the crypto space. It is often dubbed “digital gold.”
Bitcoin’s current cryptography is based on an impenetrable algorithm (SHA-256) designed by the United States National Security Agency (NSA) in 2016, after the collapse of the SHA-1 algorithm. This algorithm makes it impossible to crack the Bitcoin network.
Since the launch of Bitcoin in 2009, its value has risen dramatically, from less than 0.01 USD in May 2010 to over 67,000 USD in November 2021. Bitcoin is expected to attain newer feats in the coming years as more institutional investors and traders continue to turn to cryptocurrency.
What Influences Bitcoin’s Price?
The world’s premier cryptocurrency, Bitcoin, has recently taken a substantial hit, dipping below the $25.5K threshold and reaching its lowest value in three months. This downward trend follows a lawsuit initiated by the U.S. Securities and Exchange Commission (SEC) against Binance, a leading cryptocurrency exchange, and its founder and CEO, Changpeng Zhao (CZ).
The news of this legal dispute sparked a swift wave of Bitcoin selling, causing a ripple effect across the majority of other cryptocurrencies. The market strain has escalated as the SEC has expanded its legal pursuits to encompass Coinbase, another key contender in the cryptocurrency exchange market.
Crypto experts posit that if Bitcoin can hold its resistance level at $26,000, we might see a bounce back in the coming months. However, if this level is breached, Bitcoin could potentially tumble to its lowest ever value of $20,000.
Yet, the experts also caution that the current rise in interest rates and a more stringent monetary policy might hinder Bitcoin from making a significant recovery in the near term.
Despite these hurdles, the year 2023 holds promise for Bitcoin advocates who see it as a “digital safe-haven” or “virtual gold”. These enthusiasts are confident that Bitcoin can offer investors a substantial hedge or attractive yields during periods of market instability.
Bitcoin Challenges
Despite its success, Bitcoin has faced several criticisms, especially its energy-hungry mining system. According to an energy consumption tracker developed by the University of Cambridge, Bitcoin mining was estimated to consume 100 TWh per year, about one-third of the UK’s total energy consumption in 2016.
In addition, BTC’s criminality potential has positioned it for more scrutiny, as it has facilitated numerous dark web dealings, such as acquiring illegal weapons, money laundering, etc.
The most significant and long-standing challenge of Bitcoin is scalability. Bitcoin’s underlying technology limits its performance in terms of transaction completion timeframe, with an insufficient capacity of 3-7 TPS. As more transactions are initiated on the network, processing delays will surface. Several proposals have been put forward to nip this concern in the bud, but a favorable long-term fix remains unclear.
How do you buy and sell Bitcoin?
You can buy and sell Bitcoin through cryptocurrency exchanges or peer-to-peer platforms. To purchase Bitcoin, you typically need to create an account with a cryptocurrency exchange, fund your account, and place an order to buy Bitcoin.
What is Bitcoin’s role in the broader financial system?
Bitcoin and other cryptocurrencies are seen by some as a disruptive force that could challenge traditional financial systems and provide greater financial freedom and autonomy for users.
Where to store Bitcoin?
The best ways to store Bitcoin include hardware wallets, paper wallets, and software wallets. Hardware wallets are considered the most secure, as they store private keys offline and require physical confirmation of transactions. Paper wallets, which involve printing out private keys and keeping them in a secure location, are also considered secure but require careful handling. Software wallets, which run on computers or mobile devices, are a great option, but more vulnerable to hacking and malware attacks.
What drives the value of BTC?
Bitcoin’s value is determined by supply and demand factors, such as market sentiment, adoption rates, regulatory changes, and investor speculation. Bitcoin’s decentralized nature, scarcity, and high-security features also contribute to its value in the market.
Conclusion
Bitcoin has gained the mainstream adoption following massive interest from institutional giants. Some companies, like the Spanish firm Telefonica, now accept Bitcoin. Telefonica even works with a cryptocurrency exchange called Bit2Me to let people pay with Bitcoin.
Looking ahead, Bitcoin seems to have a bright future with potential for its price to go up. This prediction is based on Bitcoin’s past prices and current market sentiment. Adding Bitcoin to your investment portfolio could be a good move, but it’s important to do your research and understand the risks before buying Bitcoin or any other cryptocurrency