


Weekly Crypto Price Analysis: BTC, ETH, BNB, SOL, XRP, ADA, And DOGE

Weekly Crypto Price Analysis
- Weekly crypto price analysis reveals major coins have been trading in mixed reaction for the past week.
- Bitcoin (BTC) has been trading below the $45K level for most of the days in the the week after ETF news
- Ethereum price has been hovering above $2,500 levels for some days, with bulls leading the market.
The United States regulatory authorities approved the launch of Bitcoin spot exchange-traded funds (ETFs), a decision that took effect on January 10. The following day, these ETFs commenced trading, attracting considerable attention from traders. Despite the high anticipation surrounding this event, the impact on Bitcoin’s price was relatively muted, suggesting that the market had already factored in this development.
On their first day of trading, the newly introduced Bitcoin ETFs witnessed a combined trading volume of approximately $4.5 billion. This robust activity underscores the keen interest from traders, even though it did not immediately translate into a substantial increase in Bitcoin’s price. The lack of a significant price surge or decline indicates that the market had largely anticipated the approval of these ETFs.
In the short term, Bitcoin’s price might experience a period of stabilization as the market adjusts to this new investment vehicle. Traders will likely adopt a cautious approach, closely monitoring the institutional capital inflow into these ETFs. Over the longer term, however, introducing Bitcoin ETFs, coupled with the upcoming Bitcoin halving event in April 2024, could potentially tighten Bitcoin’s supply. This scenario is expected to exert upward pressure on Bitcoin’s price, as the reduced supply may struggle to meet growing demand.
Weekly crypto analysis reveals that most cryptocurrencies are experiencing a mixed reaction in the market. The bearish and bullish sentiments clash, making it difficult to predict the market direction. Bitcoin (BTC) is one of the major coins trading below $45k for most of the last seven days. This has caused concern among investors as BTC is seen as a leading indicator for other cryptocurrencies.
Ethereum has been displaying resilience, consistently maintaining its value above the $2,500 mark recently. On the other hand, Binance Coin (BNB) has experienced a slight downturn, with its trading value trading above the $300 threshold. XRP has seen a slight increase of more than 2% in the past week.
Amidst these varied trends, Solana (SOL) stands out with its bullish trajectory, having climbed past the $98 mark. This rise in Solana’s value contrasts with the more stable patterns observed in other cryptocurrencies like Cardano (ADA) and Dogecoin (DOGE).
BTC/USD
Bitcoin, the premier cryptocurrency, has recently shown significant volatility. The candlestick patterns on January 10 and 11, characterized by a long tail and a long wick, suggest active buying at lower levels and selling during price rallies. After a bullish phase last week that pushed its value above $45,000, Bitcoin has encountered bearish trends this week, with its price often falling below the $45,000 level. Currently, BTC is at $42,872, with a 24-hour slight decrease of o.45%
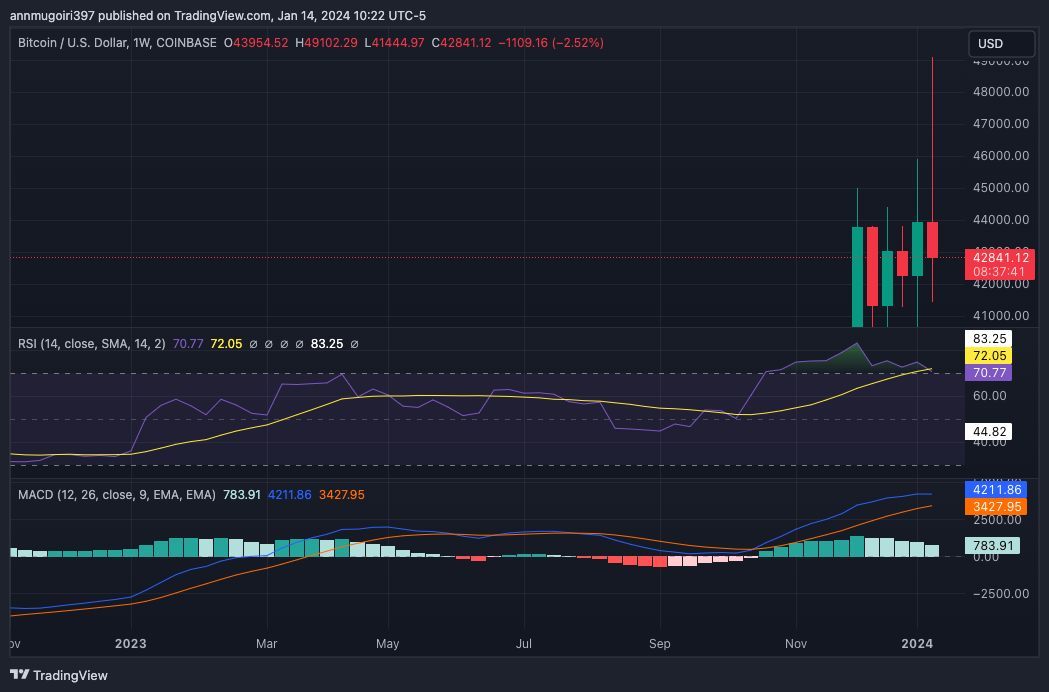
BTC/USD weekly chart, source: TradingView
The technical indicators in the past week have been indicating positive conditions, with the MACD (Moving Average Convergence Divergence) indicator showing a crossover. The 20-EMA and 50-SMA also indicate positive conditions, making it difficult to predict the direction of BTC’s price in the coming week. The relative strength index (RSI) is currently at 70, indicating overbought sentiment in the market.
ETH/USD
Ethereum (ETH) has recently experienced a significant rally, surpassing the $2,400 resistance level on January 10, hinting at an upward trend initiation. Currently, ETH stands at $2,537, reflecting a 12% increase over the last week. Despite this growth, there’s been a minor 0.89% dip in the past 24 hours.
The next anticipated milestone for ETH is $2,700, a level that might prompt short-term traders to secure profits. If ETH sustains its value near this mark, it could indicate strong buying interest on dips, potentially setting the stage for a climb toward the crucial $3,000 level. Conversely, if ETH falls below its current support of $2,500, it might descend to $2,400, and possibly retest the $2,200 breakout level.
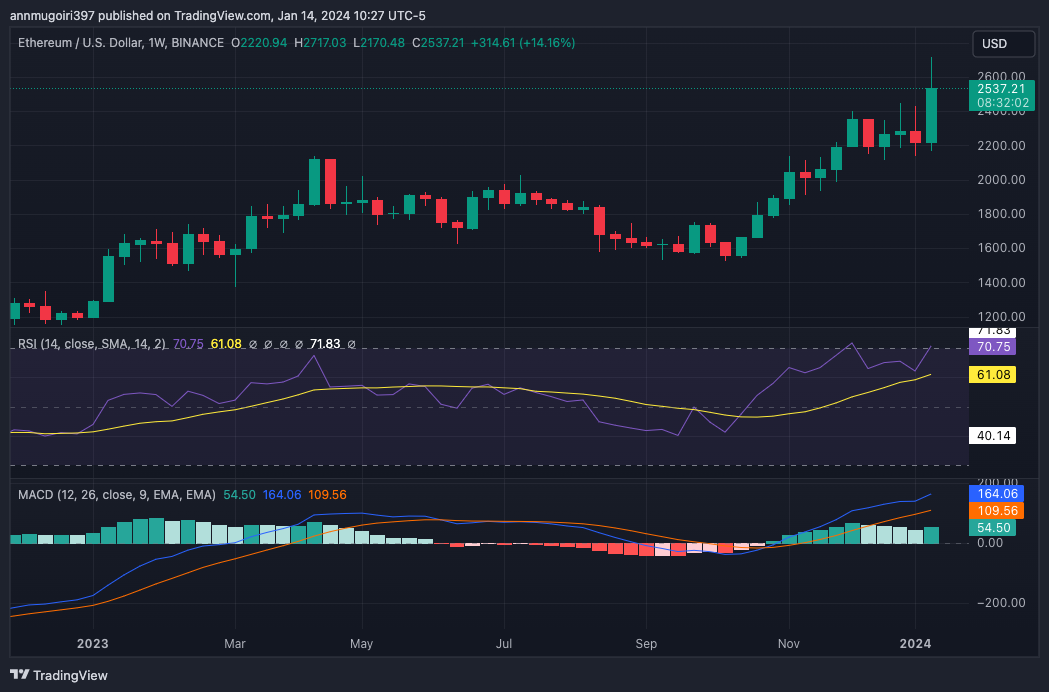
ETH/USD weekly chart, source: TradingView
The technical indicators are showing bullish signals for ETH. The MACD indicator is currently in a positive region, while the 20-EMA and 50-SMA indicate an upside. The RSI is at 70, showing overbought sentiment in the market. The moving averages also show a potential golden cross, which could signal an upward trend in the coming days.
BNB/USD
Binance Coin has seen a slight decrease in its price over the past week, hovering around the $300 level. However, it has managed to stay above the $290 support level and is currently trading at $305. Over the past seven days, BNB has seen a price decrease of 0.11%.
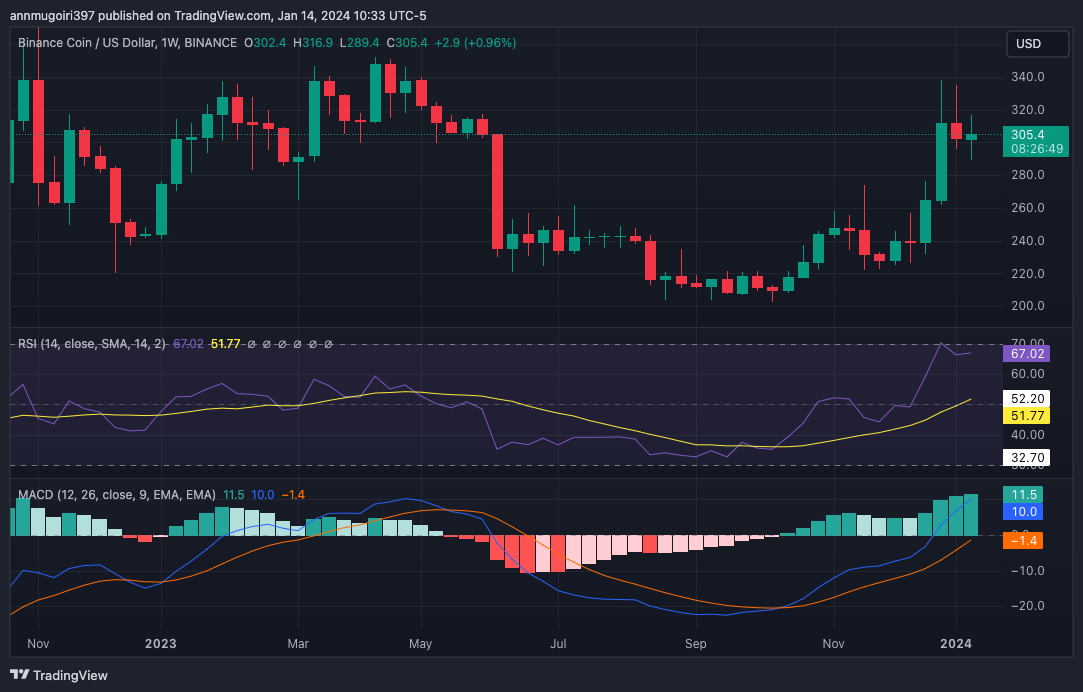
BNB/USD weekly chart, source: TradingView
The technical indicators also show mixed signals for BNB, with the MACD indicator showing a bullish crossover and the RSI at 67, indicating neutral sentiment in the market. if bulls can push BNB above $310 levels, it could signal a potential uptrend. However, if bears push BNB below the $300 support level, it could go down to the $290 level.
SOL/USD
Over the last week, Solana (SOL) has experienced a notable uptick in its market value, successfully surpassing the $95 mark. Currently, SOL is trading around $99, marking a 77% increase over this period. This positive momentum has been fueled by strong bullish sentiment, enabling SOL to overcome previous resistance levels and reach new heights. Recently, Solana has been fluctuating within a narrow range, caught between upward and downward trend lines. This pattern emerged after SOL’s value dropped below the $110 level, leading to a tug-of-war between bearish and bullish forces in the market.
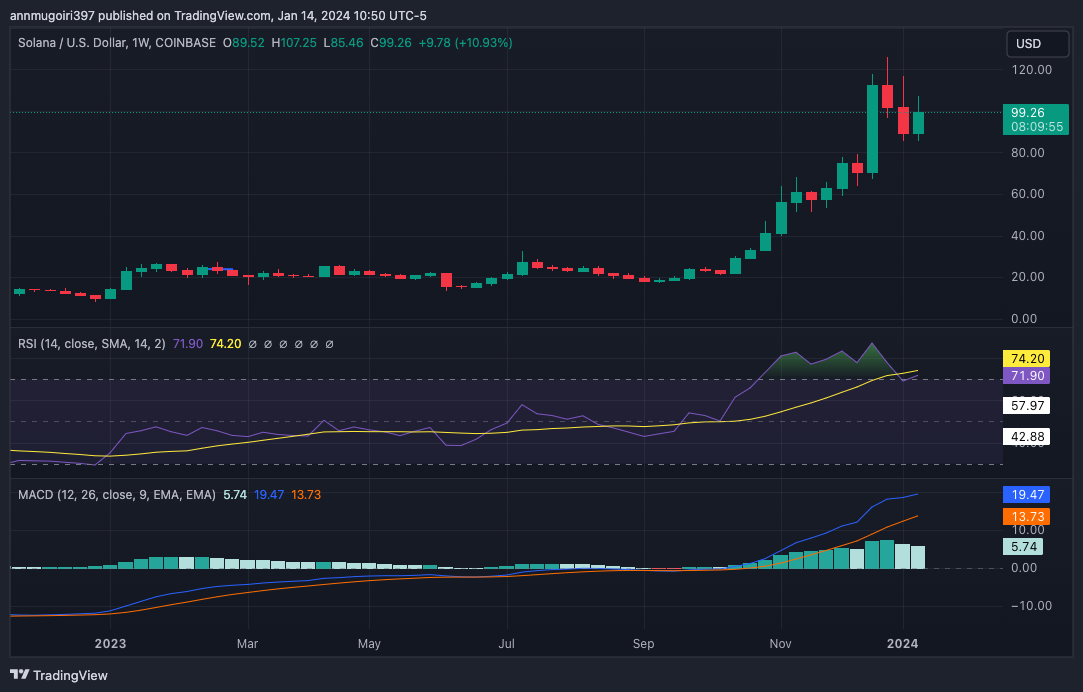
SOL/USD weekly chart, source: TradingView
The technical indicators show bullish signals for SOL, with the MACD indicator showing a bullish crossover and the RSI at 71, indicating strong buying pressure in the market. The moving averages also indicate an uptrend, with the 20-EMA crossing above the 50-SMA, which could signal a continuation of the bullish trend.
XRP/USD
XRP has recently rebounded, surpassing the critical $0.57 mark on January 10, a move that suggests strong buying interest at lower price points. The digital currency has been witnessing a battle between bullish and bearish forces, with both buying and selling pressures influencing its price. As of the latest update, XRP is trading at approximately $0.5779, experiencing a modest increase of 0.54% in the last 24 hours. This recent activity in XRP’s market demonstrates the ongoing volatility and investor interest in this cryptocurrency.
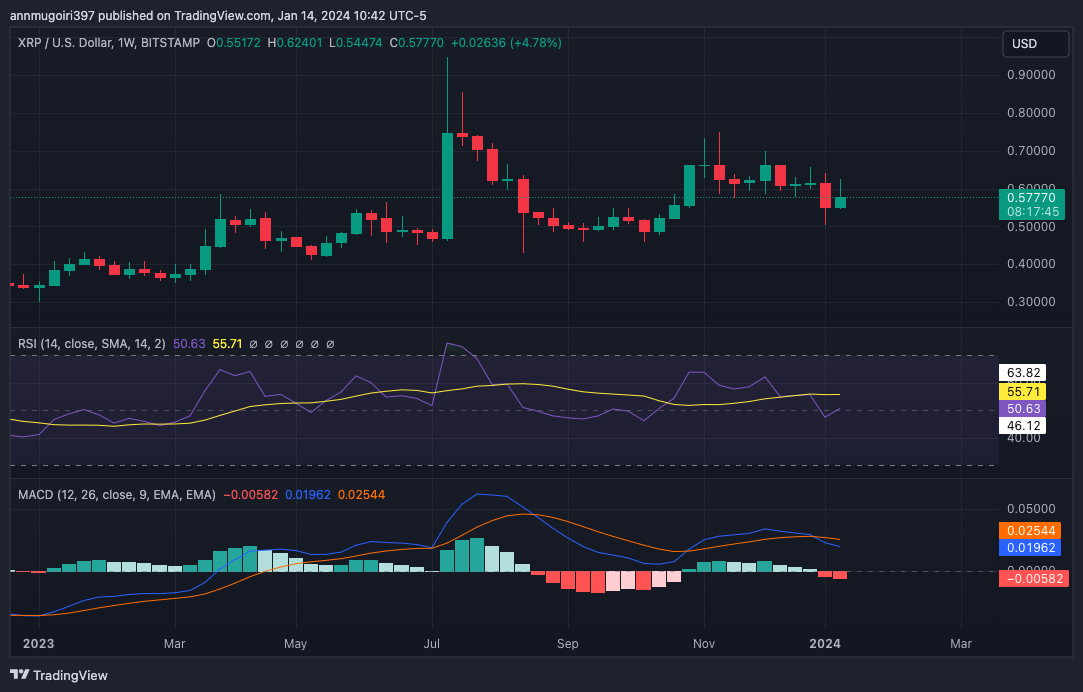
XRP/USD weekly chart, source: TradingView
The technical indicators show mixed signals for XRP, with the MACD indicator showing a bearish crossover and the RSI at 50, indicating neutral sentiment in the market. The moving averages are also in a downtrend, with 50-MA and 200-MA indicating a potential downside in the coming days.
ADA/USD
According to the weekly price analysis, Cardano (ADA) has been trading within a range of $0.47-0.61 for the past week, with a bullish trend. The coin had briefly crossed above $0.50, only to see it slipping back down again due to strong bearish pressure from the markets. At the time of writing, ADA is currently trading at around $0.5467, with the support of the coin being quite weak.
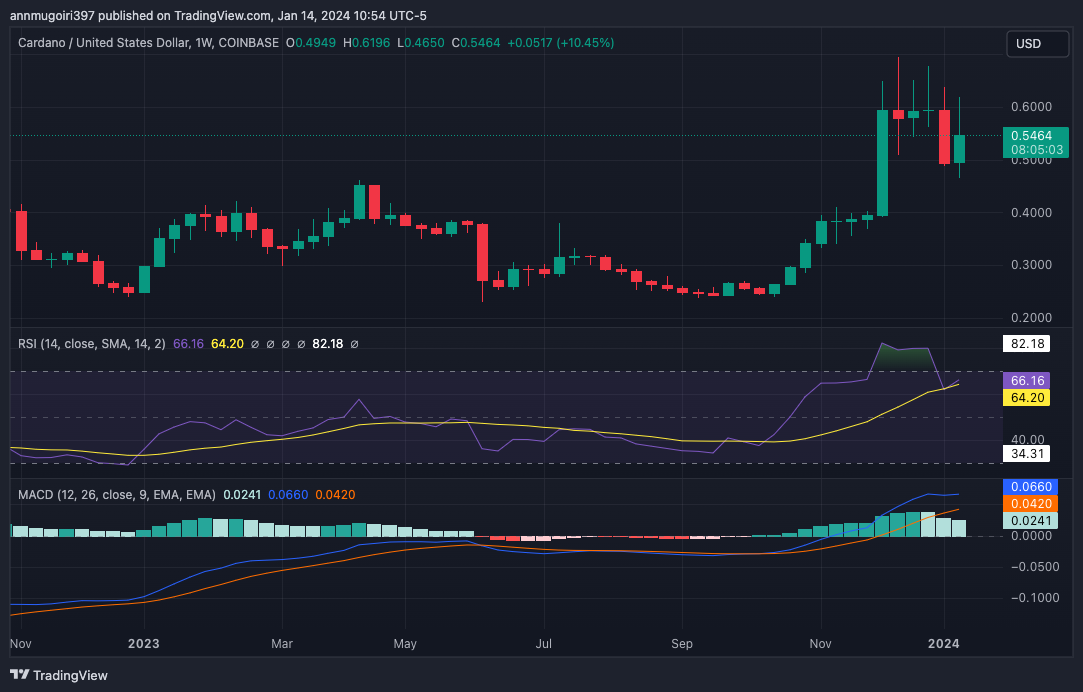
ADA/USD weekly chart, source: TradingView
The MACD indicator has been indicating neutral divergence for some time, with the MACD line remaining below the signal line. The Relative Strength Index (RSI) has also been trending down and is currently trading at around 66, indicating a neutral market. The 50-week MA is also below the 200-week MA, further confirming the bearish trend.
DOGE/USD
Dogecoin (DOGE) has exhibited a modest upward trend, maintaining its value just over the $0.082 mark. The cryptocurrency is presently valued at $0.08222, reflecting a 2% rise over the past week. On January 11, Dogecoin’s buyers successfully pushed its price above the 20-day Exponential Moving Average (EMA), which stands at $0.09. However, they were unable to secure a closing price above this level, indicating that sellers are still actively capitalizing on price rallies.
The MACD indicator shows a bearish crossover, With the MACD line remaining above the signal line.
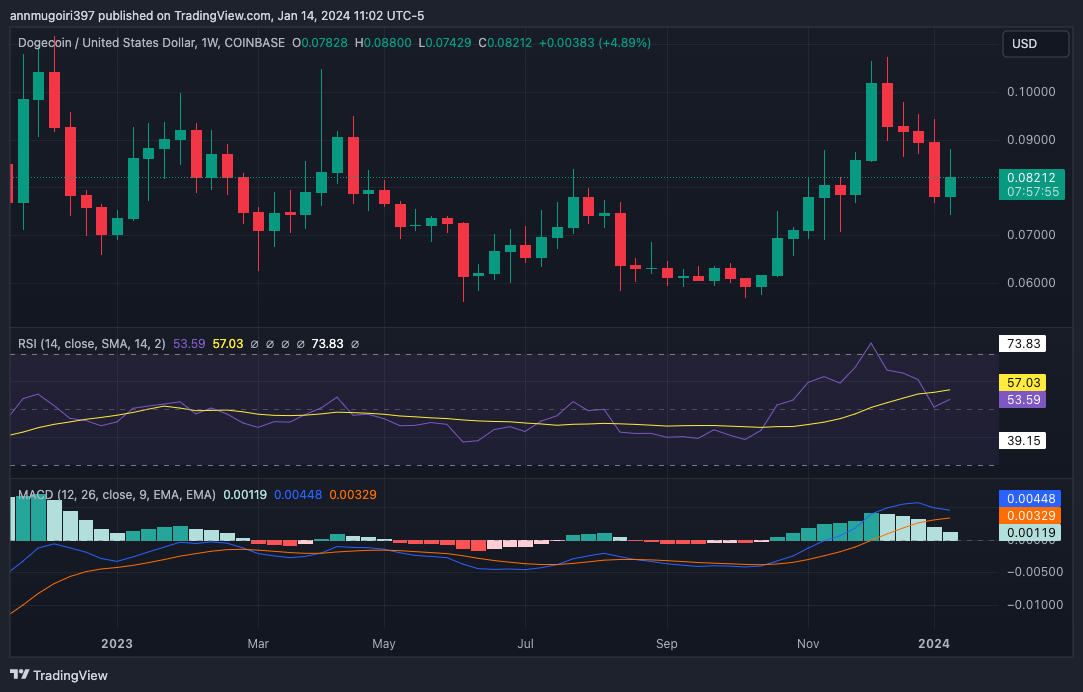
DOGE/USD weekly chart, source: TradingView
The technical indicators show mixed signals for DOGE, with the 20-EMA and 50-SMA indicating a potential downtrend while the RSI is at 53, showing neutral sentiment in the market. If bears continue to dominate, DOGE could potentially go down to the $0.075 support level. However, if bulls push DOGE above the $0.0850 resistance level, it could signal a potential uptrend, with its next target being the $0.095 level.
Weekly crypto price analysis conclusion
In conclusion, the past week has seen mixed trends for major cryptocurrencies. The technical indicators show mixed signals for these coins as well, with some indicating potential uptrends while others show signs of a downtrend. In the coming days, it will be interesting to see if bulls can push these coins above critical resistance levels and establish a clear uptrend or if bears will continue to dominate and push the prices down.
If you're reading this, you’re already ahead. Stay there with our newsletter.


