Polygon Price Prediction 2024-2033
- Polygon Price Prediction 2024 – up to $1.8
- Polygon Price Prediction 2027 – up to $4.27
- Polygon Price Prediction 2030 – up to $12.35
- Polygon Price Prediction 2033 – up to $35.66
How much is MATIC worth?
Today, the price of Polygon (MATIC) stands at $0.7, experiencing a 24-hour trading volume of $133 million. The cryptocurrency has a market capitalization of $5.8 billion and accounts for 0.41% of the market dominance. Over the past 24 hours, MATIC’s price has decreased by 0.7%. Currently, 8.01 billion MATIC tokens are in circulation, out of a maximum supply of 10 billion.
MATIC price analysis: MATIC price faces intense bearish domination following rejection
- MATIC price analysis shows a bearish pressure as it faces rejection around $0.75 mark
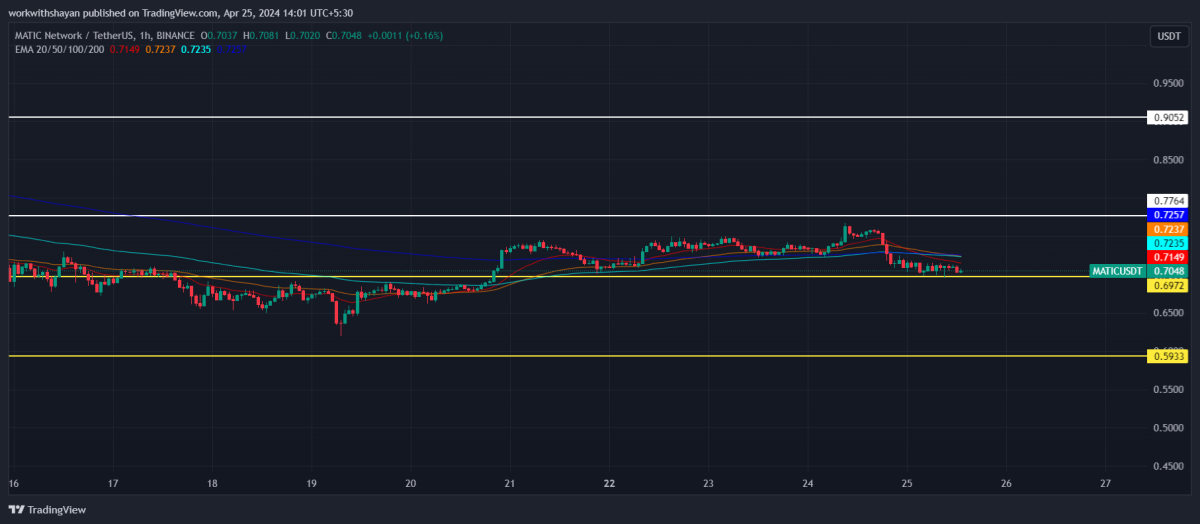
- Resistance for MATIC is present at $0.7764
- Support for MATIC/USD is present at $0.6972
The MATIC price analysis for 25 April confirms that MATIC is facing a strong battle around the $0.75 mark as it continues to struggle around that level. As a result, the price has triggered a heavy decline recently.
MATIC price analysis 1-day chart: Polygon struggles to meet buyers’ demand
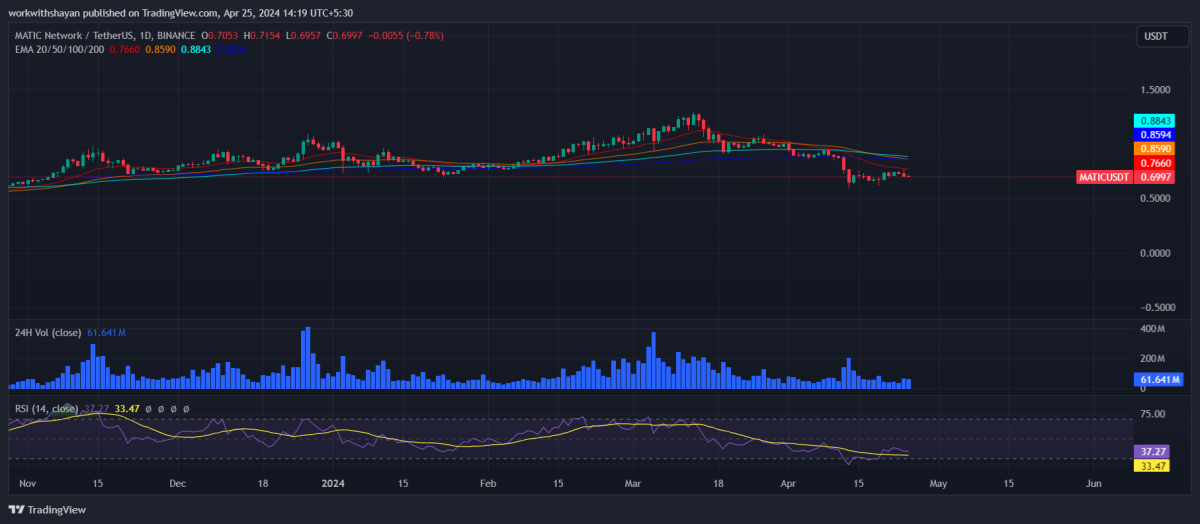
Analyzing the daily price chart of Polygon, MATIC’s price witnessed a bearish rally after bulls were unsuccessful in pushing the altcoin above immediate Fib levels. Over the last 24 hours, MATIC price has been consolidating around the $0.7 mark as bulls failed to validate a clear trend above $0.75. The 24-hour volume declined to $61 million, showing a decreased interest in trading activity today. MATIC price is currently trading at $0.7, decreasing by over 0.7% in the last 24 hours.

The RSI-14 trend line has declined from its previous level and currently hovers around 37-level, showing that bulls are slowly losing the momentum of the price. The SMA-14 level suggests upward volatility in the next few hours.
MATIC/USD 4-hour price chart: Bulls aim for a surge above EMA trend lines
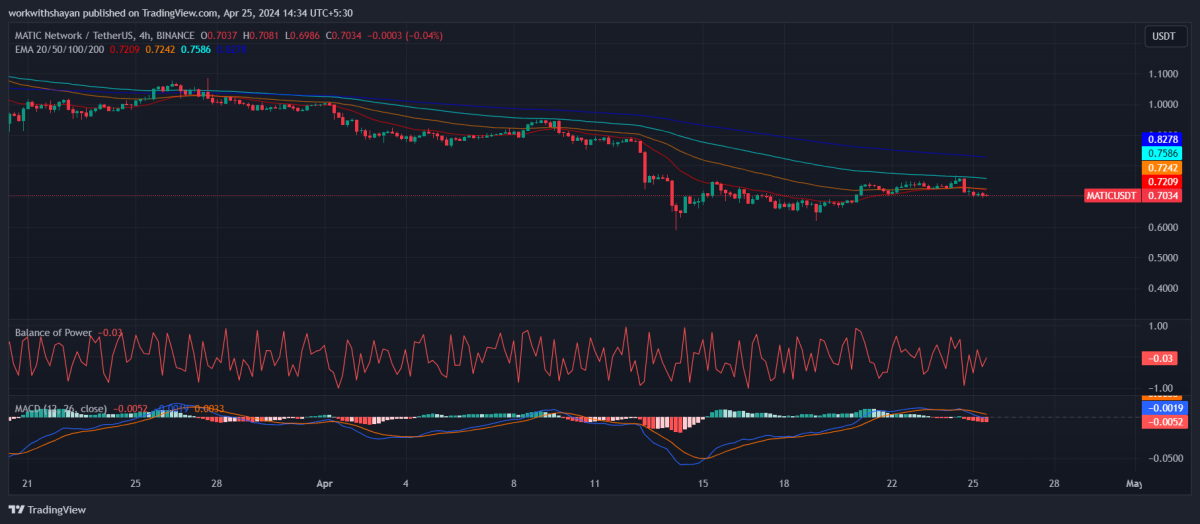
The 4-hour MATIC price chart suggests MATIC price continues to experience bearish activity around EMA lines, creating a negative sentiment on the price chart. As the price continues to face resistance near immediate Fib level, bulls are aiming to prevent further declines by sending the price above EMA20.

The BoP indicator is trading in a bearish region at 0.03, hinting that sellers are trying to build pressure near resistance levels and boost a downward correction.
Additionally, the MACD trend line has formed red candles below the signal line and the indicator aims for a negative momentum, strengthening selling positions.
What to expect from MATIC price analysis next?
The hourly price chart confirms bears are making efforts to prevent the MATIC price from an immediate surge. However, if MATIC price successfully breaks above $0.7764, it may surge higher and touch the resistance at $0.9052.

If bulls cannot initiate a surge, MATIC price may drop below the immediate support line at $0.6972, resulting in a correction to $0.5933.
Is MATIC A Good Investment?
MATIC token can be a good investment option in the long run as the project develops roadmap for its Polygon 2.0 version. Additionally, Polygon collaborates with diverse industries to enhance adoption, focusing on NFT solutions and Ethereum scalability. Partnerships include Starbucks for an NFT loyalty program, and collaborations with Adidas, Prada, and Disney to develop NFT offerings.
Recent News/Opinions on MATIC
Outage: Polygon’s zkEVM is down due to a sequencer issue, affecting only this layer-2 Ethereum scaling solution. Other chains using Polygon’s CDK remain unaffected, the company informed its two million X followers.
Controversy: The Polygon ecosystem has faced recent controversies as accusations suggest it misused and sold off large amounts of MATIC, impacting holders.
1/ Polygon allocation problems and suspicious flows to exchanges.
— ChainArgos (@ChainArgos) January 15, 2024
Let's look at a very large project and explore how the allocations were not done in line with the publicly stated plan. And show some, um, suspicious flows to an exchange.
This has been part of our demo for quite…
Partnership: Fox Corporation has introduced the Verify platform, a blockchain-based system for companies to monitor their content’s online usage. Developed in collaboration with Polygon Labs, this platform aims to track the origin and history of media used by AI firms.
Polygon Price Predictions 2024-2033
Price Prediction By Cryptopolitan
| Year | Minimum ($) | Average ($) | Maximum ($) |
| 2024 | 1.08 | 1.11 | 1.8 |
| 2025 | 1.62 | 1.67 | 2.41 |
| 2026 | 2.43 | 2.52 | 2.80 |
| 2027 | 3.42 | 3.52 | 4.27 |
| 2028 | 4.98 | 5.16 | 6.00 |
| 2029 | 7.02 | 7.28 | 8.47 |
| 2030 | 10.39 | 10.68 | 12.35 |
| 2031 | 14.65 | 15.08 | 17.85 |
| 2032 | 21.09 | 21.70 | 25.73 |
| 2033 | 29.83 | 30.91 | 35.66 |
Polygon Price Prediction 2024
The price of Polygon is predicted to reach a minimum value of $1.08 in 2024. The Polygon price could reach a maximum value of $1.8 with the average trading price of $1.11 throughout 2024.
Polygon Price Prediction 2025
The price of 1 Polygon is expected to reach a minimum level of $1.62 in 2025. The MATIC price can reach a maximum level of $2.41 with the average price of $1.67 throughout 2025.
MATIC Price Forecast for 2026
Polygon price is forecast to reach a lowest possible level of $2.43 in 2026. As per our findings, the MATIC price could reach a maximum possible level of $2.80 with the average forecast price of $2.52.
Polygon (MATIC) Price Prediction 2027
As per the forecast and technical analysis, in 2027 the price of Polygon is expected to reach a minimum price value of $3.42. The MATIC price can reach a maximum price value of $4.27 with the average value of $3.52.
Polygon Price Prediction 2028
As per the forecast price and technical analysis, in 2028 the price of Polygon is predicted to reach a minimum level of $4.98. The MATIC price can reach a maximum level of $6.00 with the average trading price of $5.16.
Polygon Price Prediction 2029
Polygon price is forecast to reach a lowest possible level of $7.02 in 2029. As per our findings, the MATIC price could reach a maximum possible level of $8.47 with the average forecast price of $7.28.
Polygon (MATIC) Price Prediction 2030
The price of Polygon is predicted to reach a minimum value of $10.39 in 2030. The Polygon price could reach a maximum value of $12.35 with the average trading price of $10.68 throughout 2030.
Polygon Price Forecast 2031
According to our deep technical analysis on past price data of MATIC, in 2031 the price of Polygon is predicted to reach a minimum level of $14.65. The MATIC price can reach a maximum level of $17.85 with the average trading price of $15.08.
Polygon (MATIC) Price Prediction 2032
The price of Polygon is predicted to reach a minimum level of $21.09 in 2032. The Polygon price can reach a maximum level of $25.73 with the average price of $21.70 throughout 2032.
Polygon Price Prediction 2033
According to our deep technical analysis on past price data of MATIC, in 2033 the price of Polygon is forecasted to be at around a minimum value of $29.83. The Polygon price value can reach a maximum of $35.66 with the average trading value of $30.91.
Polygon Price Prediction By Coincodex
According to Coincodex’s current Polygon price prediction, Polygon’s price is expected to increase by 14.63%, reaching $1.159450 by March 10, 2024. Coincodex’s technical indicators suggest that the market sentiment is currently Bullish, with the Fear & Greed Index indicating a score of 90 (Extreme Greed).
Over the past 30 days, Polygon has seen 17 out of 30 (57%) days of price increase, with a volatility of 10.05%. Based on Coincodex’s forecast, this period is considered an opportune time to invest in Polygon. Further analysis of Polygon’s historical price trends and the impact of Bitcoin halving cycles leads to a prediction of a yearly low for Polygon at $1.011490 in 2025, while its price could soar to as high as $3.66 in the following year.
Polygon Price Forecast By Digital Coin Price
According to projections from Digital Coin Price, analysts and experts anticipate that by 2026, MATIC will commence the year with a value of $3.01 and fluctuate around $3.60. This projection suggests a significant increase from the previous year, marking a considerable growth for Polygon.
Looking ahead to 2033, Litecoin is expected to attempt reaching a low of $1,558.64. Efforts might be made to achieve a maximum and ascend to the next premium tier of $1,614.05, with an average forecast price set at $1,605.31. There is potential for Litecoin to surpass its previous high and advance to a new level. While there’s optimism for progress to its subsequent stage, it’s also acknowledged that there could be a downturn.
Polygon Price Prediction By CryptoPredictions.com
According to CryptoPredictions.com’s Polygon prediction, Polygon is forecasted to begin April 2024 with a value of $1.280 and close the month at $1.542. Throughout April, the highest predicted price for MATIC is $1.827, while the lowest anticipated price stands at $1.242.
Polygon Overview
Polygon serves as a multi-layered protocol suite aimed at resolving the scalability challenges associated with the Ethereum network. By operating a separate but compatible blockchain, Polygon efficiently processes transactions before syncing them back to the main Ethereum chain. This method alleviates the strain on the Ethereum network, enabling faster transaction speeds and reducing costs to a fraction of a cent.
Previously known as Matic Network, Polygon offers a user-friendly framework that allows both new and existing blockchain projects to operate on the Ethereum platform without worrying about scalability constraints.
With Polygon, users can seamlessly engage with decentralized applications (DApps) without concerns over network bottlenecks. The company is led by CEO Jaynti Kanani, who co-founded the project with Sandeep Nailwal, the Chief Operating Officer, and Anurag Arjun, the Chief Product Officer. The team initially launched the project as Matic Network in 2017.
Polygon Price History
According to Polygon’s plan, all Matic coins will be released by December 2022, which is good news for long-term investors because it guarantees significant future gains.
Since its inception in 2017, Matic tokens have had an incredible run that has withstood the test of unforgiving crypto market turmoil that usually ends up wiping out invalid tokens.
Despite the prevailing bearish trend currently experienced in the crypto market, experts are convinced by Matic’s crypto price prognosis and price forecast data that indicate an overall bullish trend for the long-term investment horizon.
Based on Coingecko’s data, Polygon has recorded impressive gains since its launch back in 2017. The crypto token has recorded incredible gains of up to 44157.6%, and the rally is expected to continue in the following years.
Matic recorded its all-time low price of $0.003143 in May 2019 during the famous bearish run. However, since then, the coin has continued to make significant gains until May 2021, when it recorded a new all-time high price of $2.62. It seems then that May is the month of Polygon, after all.
Polygon’s price has been on the rise since it hit a high of $1 at the end of July, and experts are predicting that as Polygon’s network continues to grow with new partnerships and adoption, the value of its token could go even higher. In August, Polygon’s price hovered around the $0.80 mark, but many believe that this is just the beginning of this promising project.
Recently, in November, Polygon saw a significant surge after the bullish news that the social media giant Meta is teaming up with the blockchain to deliver its journey into the world of Web3 and NFTs.
Stephane Kasriel, head of commerce and financial technologies at Meta, revealed that Instagram businesses will soon be able to create and sell their own NFTs (non-fungible tokens). This service would first launch on the Polygon blockchain before expanding to others, including Solana. MATIC rocketed after this news and hit a high of $1.29 on 7 November. After peaking and later announcing multiple partnerships, including an NFT marketplace deal with Nike, MATIC eventually fell below the $1 barrier.
Just this past year, Polygon (@0xPolygon) has rolled out some incredible features on Twitter. From the launch of a new Token List service to mobile burning capabilities for MATIC tokens, they have allowed users to interact with MATIC in an efficient and secure manner. This means you can now access the MATIC burn console through your mobile wallet with a simplified interface that is easy to use.

More on Polygon (MATIC)
What’s Polygon (MATIC)?
Polygon is the leading platform for Ethereum scaling and infrastructure development. Its growing suite of products offers developers easy access to all major scaling and infrastructure solutions: L2 solutions, sidechains, hybrid solutions, stand-alone and enterprise chains, data availability solutions, and more. Polygon’s scaling solutions have widespread adoption with 3000+ applications hosted, 1B+ total transactions processed, ~100M+ unique user addresses, and $5B+ in assets secured.
Mina Protocol and Polygon are working towards implementing support for Mina on Polygon PoS. This bridge will enable developers building applications on Polygon to leverage privacy and verifiability via Mina’s zero knowledge-SNARK-based protocol.
Polygon Use Cases
Ethereum-based Polygon hopes to solve fundamental issues the Ethereum blockchain faces, such as interoperability and scalability. It is the first project on the Ethereum blockchain to launch an adequately structured tool that addresses the Ethereum scaling problem. Consequently, many have termed Polygon as an Ethereum scaling solution.
Rather than running on its own blockchain, MATIC tokens are traded on the Ethereum blockchain. That’s because Polygon was developed to help scale Ethereum through side chains. MATIC allows you to stake on the Ethereum blockchain and pay for currency transactions. This has helped reduce the high transaction costs inherent in the Ethereum blockchain, helping promote widespread adoption.
Another thing, Ethereum is home to several DeFi projects like the Polygon, formerly known as the Matic network. Since the Matic network has brought numerous functionalities to the entire Ethereum blockchain, several developers have taken an interest in the project, which has, in turn, led to steady growth of Matic price.
Major cryptocurrencies such as Bitcoin, Ethereum, Ripple, etc., witnessed a slump on the 1st week of June, and yet, the value of Polygon(MATIC) rose nearly 35% in the same period. Investors saw Polygon (MATIC) as the next big thing, and in a short period, it surged past other cryptos to rank among the top 15 biggest cryptos globally. Polygon successfully converts the limited Ethereum blockchain into an open blockchain network usable by many. In essence, it makes Ethereum steady as the internet of blockchains.
In turn, Polygon (Matic) project benefits immensely from the already-established Ethereum blockchain in several ways. Firstly, every blockchain project needs a secure security infrastructure; the Matic network benefits from Ethereum’s array of qualities, such as an active and vibrant community, established security systems, and transparency.
Within the Polygon network, transactions are settled using the Matic coin. Matic price has risen over the years, sparking interest from cryptocurrency enthusiasts. Polygon technology has improved efficiency within the Ethereum blockchain. Today, Polygon boasts of handling up to 65,000 transactions per second on its single sidechain. Similarly, it has averaged an impressive block confirmation time of two seconds per transaction.
Pros and cons of investing in Polygon (Matic)
Polygon, formerly Matic network, has been considered a stable investment by crypto enthusiasts. Anyone interested in Ethereum and its bundle of projects likely has an affinity for Matic.
It is a well-structured organization with clear goals of extending the scalability of the Ethereum blockchain and making cryptocurrency more accessible to the public. If the project continues to push forward strides, its success is inevitable, and consequently, Matic holders will benefit significantly.
Investing is a full-time activity that requires individuals to analyze potential risks and returns before committing. However, within the crypto world, numerous uncertainties shape the prices of crypto coins. Therefore, even for a seasoned professional, it is challenging to make precise predictions on the price of a coin based on historical price actions alone.
However, for an individual to earn impressive returns on their investments, they must take risks. Here, we’ll discuss some of the benefits of investing in the Polygon ecosystem.
Pros of investing in Matic
Since Matic is a scaling solution on the Ethereum blockchain, it is difficult to foresee its downfall. Therefore, most forecasts are convinced that Polygon will be in existence for years to come. So what are some of the pros of investing in this token?
- It provides new scaling solutions to the Ethereum ecosystem, ensuring a bright future and allowing investors to make long-term investments.
- Since 67% of the tokens are already in circulation, and the maximum supply is expected to be realized by December 2022, the coin offers immense growth potential in 2022 and beyond, allowing investors to reap more profits.
- Matic allows for the interconnection of blockchain networks, a scaling solution that assures investors of Matic’s future performance.
- Polygon is supported by a strong community of developers that ensures the project performs well and consequently maintains and increases Matic’s price level.
Cons of investing in Matic
It is indeed public knowledge that investments always come with a degree of risk. Investing in Matic may result in losses if careful considerations of the involved risks aren’t well conducted. Below are some possible shortcomings of investment in Matic.
- Recently, the Polygon network was hacked, and the perpetrators made away with millions worth of Matic tokens. The hacking was a huge red flag for investors since it indicates that the network isn’t as secure as it should be.
- Price volatility. Every cryptocurrency experiences volatility; however, when dealing, sometimes crypto coins experience extreme price drops that may hurt an individual’s portfolio. Since Matic already competes with Avalance, Polkadot, and Cosmos, it is unclear who will win the race. Therefore, for a long time horizon, investors should keep tabs and know when to exit.
Conclusion
Despite the short-term volatility, Polygon’s investors remain confident that it can reach double digits in no time. For example, Lark Davis (@TheCryptoLark) confidently tweeted about his MATIC holdings expecting it to hit $10 soon.
Polygon has been actively doing partnerships with various companies in the market and staying at the top of market trends. Here are some recent updates, as announced by Polygon:
- The Polygon Mainnet is now live in Alpha and Beta versions.
- Support for deposits and withdrawals of all Ethereum-based assets
- Support of ERC721 to ERC20, ERC20 to ERC20, and ERC721 to ERC721 transactions enabled
- Increasing the number and capabilities of Proof-of-Stake validators
- Offering the API and SDK toolkit for dApp infrastructure development
- Supernets, a new blockchain network, is ready to skyrocket with Polygon’s $100 million investment toward businesses taking advantage of its powerful technology.
With partnerships, MATIC prices are expected to continue to surge. If investors and traders can take advantage of these bullish signs, they could enjoy significant profits. However, it is important to keep in mind that the market is highly volatile and risky so always do your own research before investing.
Overall, scaling solutions like Polygon are expected to gain momentum as network congestion on the Ethereum blockchain remains an issue. Polygon’s multi-layer technology allows it to authenticate transactions in a matter of seconds while still uploading them to the Ethereum blockchain, combining scalability and security.
Polygon’s powerful Dapp architecture makes it simple to build new apps on-chain and port current Ethereum projects. However, MATIC is projected to continue dipping by a few cents before beginning another price increase soon. Before making any investment decisions, do your research.


