EOS Price Prediction 2024-2033
- EOS Price Prediction 2024 – up to $1.22
- EOS Price Prediction 2027 – up to $4.17
- EOS Price Prediction 2030 – up to $11.56
- EOS Price Prediction 2033 – up to $34.37
EOS a crypto token formed by the company to promote its decentralized app creation. Lately, it has resumed its upward projectile with renewed activities and is viewed by some analysts as a “ticking time bomb.” The similarities between the XRP fractal from 2015 to 2017 and EOS’s current chart are mind-blowing.
EOS, jokingly referred to as Ethereum on Steroids, seems like “the world’s most hyped blockchain” is struggling to regain its footing as far as its value is concerned.
How much is EOS worth?
Today’s live EOS price is $0.73, with a 24-hour trading volume of $112,558,070, a decrease of 41.70%. EOS is down 2.60% in the last 24 hours. The current CoinMarketCap ranking is #96, with a live market cap of $823,824,021. It has a circulating supply of 1,123,268,502 EOS coins, and the max supply is not available. However, it makes a fully diluted market cap of $823,824,021.
EOS price analysis: EOS trades at $0.73 amid market consolidation
- EOS price analysis shows a price decrease of 2.60% over the last 24 hours.
- Resistance is currently found at $0.7583.
- EOS/USD may retest the support of $0.6756.
Analyzing EOS’s performance, it’s evident that the EOS market has demonstrated sideways movement during the day’s trading session. Over the past 24 hours, EOS/USD has varied between $0.7457 and $0.7151.
The EOS/USD pair is currently at $0.73, marking a decrease of of 2.60%. The day started on a bullish note before turning bearish reflecting negative market sentiment with the anticipation of further downward momentum in the short term.
EOS/USD 1-day price chart: Bearish pressure is present at $0.7576
The 1-day price chart for EOS price analysis is going bearish for the day as the price continues to plunge, trading just below the resistance level. There had been a slight bullish momentum as the day commenced resulting in the price hitting a daily high of $0.7457.
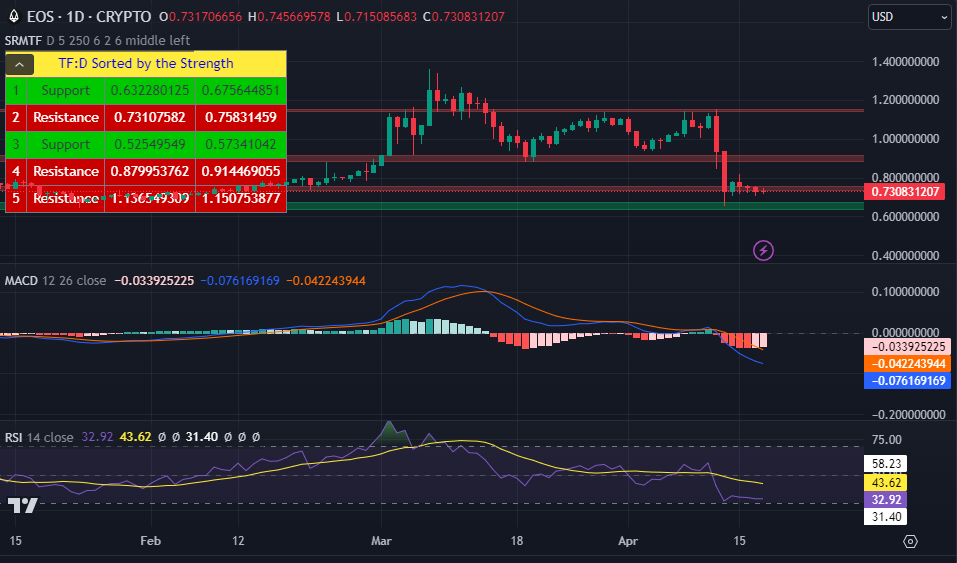
EOS/USD 1-day price chart: Tradingview
EOS currently registers a Relative Strength Index (RSI) value of 32.92 , offering valuable insights into its current market dynamics.
With an RSI reading of 32.94, EOS finds itself in the lower-range, suggesting a bearish market sentiment just above the oversold region. Traders and investors should approach cautiously, considering various technical and fundamental factors before trading.
The MACD on the 1-day chart shows a consolidation seeing that the MACD histogram bars have remained equal in the past three days. On the other hand, the market could be on the verge of a bullish reversal seeing that the MACD line is lower than the histogram.
If a bullish reversal takes place and the price breaks past the resistance level at $0.73107582, the price could make an attempt at the resistance level at $0.7583149.
Nevertheless, if the current bearish trend persists, the token price could drop to $0.632280125 after breaching the support level at $0.675644851.
EOS price analysis 4-hour price chart: Price consolidation
On the 4-hour price chart, the EOS token is trading in a tight range as the price consolidates after a sharp drop between 12 April and 13 April. This consolidation hints at the potential bullish reversal.
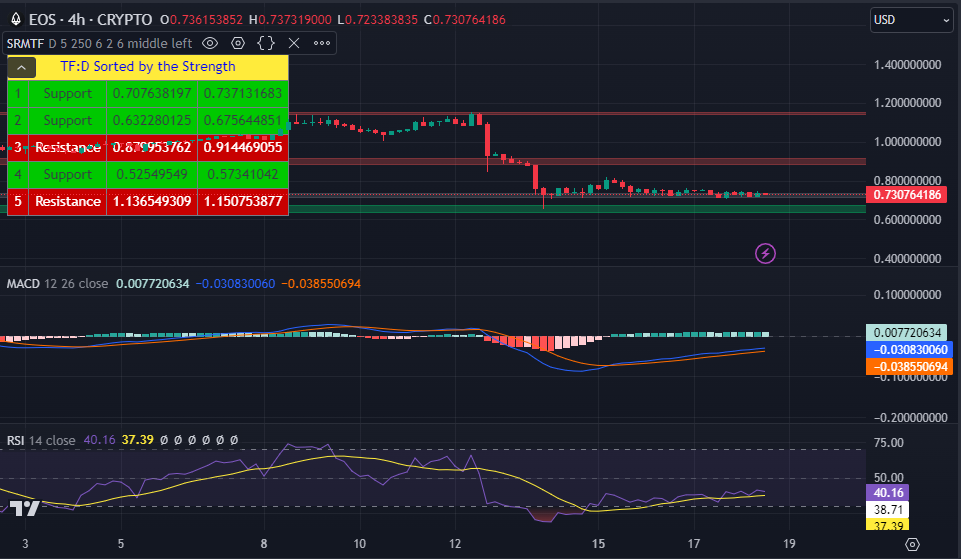
EOS/USD 4-hour price chart: Tradingview
EOS currently displays an RSI (Relative Strength Index) value of 40.16, which is just shy of the oversold region.
With the RSI reading on the rise, it is a signal of an possible bullish reversal. Traders and investors should exercise caution and consider various technical and fundamental factors before trading.
When examining EOS’s MACD on the 4-hour chart, there are signs of a bullish reversal seeing that the MACD histogram is already forming above the middle line. Secondly the MACD crossover has already taken place with the MACD line moving above the MACD signal line.
If the bullish reversal occurs on the 4-hour chart, traders should watch the resistance level at $0.879953762, which if breached the price would attempt to break the next resistance at $0.914469055. If these two resistance levels are breached, then the price could rise towards the next resistance level at $1.136549309, which if breached then traders should keep an eye on the resistance level at $1.150753877.
On the flipside, if the bearish trend continues, traders should have their eyes on the support level at $0.707638197, which if breached the market could drop towards the next support level at $0.675644851.
Is EOS a good investment?
EOS represents a compelling investment prospect thanks to its robust features and scalability potential. As a blockchain platform, EOS offers rapid transaction speeds and minimal fees, making it appealing for developers venturing into decentralized applications (DApps). Its delegated proof-of-stake (DPoS) consensus mechanism enhances scalability and efficiency.
Furthermore, EOS boasts a thriving ecosystem with diverse DApps across various sectors, underscoring its utility and adoption. Our CP Price Prediction section will provide insights into the coin’s potential value appreciation in the foreseeable future, assisting investors in formulating their strategies.
Recent EOS News
EOS taps into tokenized real-world assets (RWA) with Wrapped RAM (WRAP)
EOS recently introduced Wrapped RAM (WRAM), a concept that tokenizes real-world assets, making them tradable on exchanges and increasing accessibility and liquidity.
WRAM is an innovation that aims to turn Random Access Memory (RAM) on EOS into digital tokens, making trading easier and more widespread.
This development, facilitated by the EOS system contract upgrade, not only revolutionizes resource management but also enhances liquidity by enabling WRAM to be bridged to other blockchains like Ethereum and BNB Chain for trading on decentralized exchanges like Uniswap and Pancakeswap.
EOS Network unveils exSat docking layer for Bitcoin scalability
EOS Network recently announced the development of exSat, a solution designed to address Bitcoin’s scalability challenges and enhance compatibility with layer-2 networks, aiming to bridge the gap between Bitcoin’s mainnet and various scaling solutions.
exSat aims to expand Bitcoin’s data consensus, promoting interoperability, scalability, and security within the ecosystem by facilitating direct queries of BTC and ecosystem token balances.
Powered by a hybrid consensus mechanism, exSat synchronizes block data between Bitcoin miners and the exSat Network, implementing decentralized state data indexing for native assets and offering opportunities for Solidity developers to build diverse applications while requiring users to stake over 100 BTC and XSAT tokens to participate as validators.
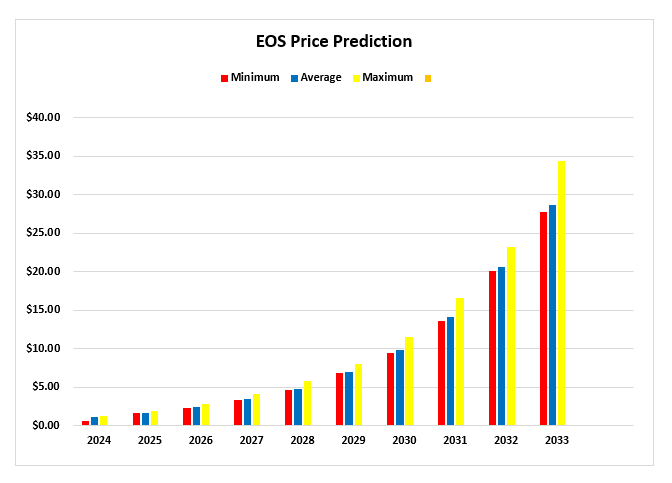
EOS Price Predictions 2024-2033
By Cryptopolitan
| Year | Minimum | Average | Maximum |
| 2024 | $0.67 | $1.10 | $1.22 |
| 2025 | $1.67 | $1.71 | $1.86 |
| 2026 | $2.35 | $2.42 | $2.83 |
| 2027 | $3.33 | $3.45 | $4.17 |
| 2028 | $4.60 | $4.77 | $5.78 |
| 2029 | $6.81 | $7.00 | $8.00 |
| 2030 | $9.43 | $9.78 | $11.56 |
| 2031 | $13.59 | $14.08 | $16.54 |
| 2032 | $20.09 | $20.66 | $23.22 |
| 2033 | $27.77 | $28.59 | $34.37 |
EOS Price Prediction 2024
Our EOS coin price prediction 2024 suggests that EOS crypto might reach a minimum of $0.67 and an average of $1.10, with the maximum forecast at $1.22.
EOS Price Prediction 2025
Based on our EOS price prediction for 2025, we believe that by this time, the crypto may reach a minimum of $1.67 and an average of $1.71. The EOS price forecast for 2025 suggests EOS will attain a maximum price of $1.86.
EOS Price Prediction 2026
According to our EOS price prediction for 2026, we expect EOS to have a maximum price of $2.35. We expect a minimum price of $2.42, with an average price of $2.83. Once developments and partnerships in the EOS ecosystem mature, EOS can be a good investment in 2026.
EOS Price Prediction 2027
Our EOS prediction for 2027 suggests that the currency may reach a minimum of $3.33 and the average price of EOS $3.45, with the maximum forecast at $4.17.
EOS Price Prediction 2028
According to our EOS price prediction for 2028, the crypto might reach a minimum of $4.60 and an average trading price of $4.77. The maximum forecast price is $5.78.
EOS Price Prediction 2029
According to our EOS coin forecast 2029, the crypto might reach a minimum of $6.81 and an average trading price of $7.00, with a maximum value of $8.00.
EOS Price Prediction 2030
Based on our EOS price prediction for 2030, the crypto might reach a minimum of $9.43 and an average trading price of $9.78, with the maximum forecast at $11.56.
EOS Price Prediction 2031
Based on our EOS price prediction for 2031, EOS cryptocurrency might reach a minimum of $13.59 and an average trading price of $14.08, with the maximum forecast at $16.54.
EOS Price Prediction 2032
Our EOS price prediction forecast 2032 suggests EOS crypto will continue on a bullish trend. The forecasted EOS price might reach a minimum of $20.99 and an average closing price of $20.66, with the maximum forecast at $23.22.
EOS Price Prediction 2033
Our EOS price prediction 2033 indicates a minimum price of $27.77, an average price of $28.59, and a maximum price of $34.37. EOS continues to show promising potential for investors.
EOS price Predictions by DigitalCoinPrice
According to DigitalCoinPrice’s forecast on EOS price prediction, EOS witnessed a remarkable upswing in February and March, briefly sending it past $1.30 and close to the $1.50 threshold. Presently, various indicators are signaling a bearish sentiment, with the fear & greed index recording a significant 20.17, indicating extreme fears among investors.
In line with DigitalCoinPrice’s analysis, this may not be the opportunity to consider selling EOS.
Looking ahead, DigitalCoinPrice’s EOS price prediction suggests a substantial increase of 257.53%, potentially reaching $2.61 by the end of 2026. Furthermore, as the projection extends into the future, it is estimated that by the end of 2030, EOS could be valued at $5.40, while in 2033, it may surge to $7.56. These forecasts underscore the potential for significant growth and evolution in the EOS market.
EOS price Predictions by Wallet Investor
According to WalletInvestor.com’s EOS price prediction, the financial forecasting platform anticipates significant cryptocurrency value movements. In their latest analysis, they project that within the next 14 days, EOS will reach a price of $0.925.
Looking further into the future, WalletInvestor.com foresees EOS achieving a price of $4.128 in the year 2025. These predictions suggest potential growth and changes in EOS’s value, offering insights for investors and enthusiasts.
EOS Price Predictions by Coincodex
According to CoinCodex, EOS price prediction exhibits some interesting trends. By the end of 2025, EOS is expected to reach $1.141895; in 2026, it might rise to $1.448569. These EOS price predictions are based on various market factors.
EOS may experience fluctuations in the short term, with an anticipated increase of 0.10% to reach $ 0.743597. However, it’s worth noting that technical indicators like the RSI, MACD, Bollinger Bands, and Stochastic Oscillator suggest a bearish momentum and potential volatility soon.
Looking further ahead, there is potential for EOS to achieve significant growth. By 2030, it could see a remarkable gain of 284.93% compared to today’s price if it reaches the upper price target.
EOS Price Prediction by Industry Influencers
The EOS blockchain has become one of cryptocurrency’s most favored Layer-1 smart contract protocols. Its creation empowered scalability and made it a direct opponent to Ethereum’s domination in smart contracts development.
Numerous specialists have contributed their guesses on the trajectory of EOS’s price as its utility in the decentralized economy continues to strengthen. This has sparked forecasts for what we can anticipate from EOS in upcoming years.
Market analysts have suggested that EOS may potentially become one of the top five blockchain projects in terms of market capitalization by 2025. Analysts also cite the increasing level of development activity and partnerships as major elements that will drive up the value of EOS in the coming years.
EOS Price Overview
| Popularity | #96 | Market Cap | $823,824,021 |
| Price Change (24 hours) | -2.60% | Trading Volume (24 hours) | $112,558,070 |
| Price change (7 days) | -30.78% | Circulating Supply | 1,123,268,502 EOS coins |
| All-time low | Oct 23, 2017 $0.5024 | All-time high | Apr 29, 2018 $22.89 |
| From ATL | +48.97% | From ATH | -96.87% |
EOS Price History
EOS, a cryptocurrency renowned for its smart contract capabilities and fast transaction speeds, has had an eventful price history. It gained prominence through an ICO (Initial Coin Offering) from June 2017 to June 2018, raising a staggering $4 billion.
EOS hit its all-time high (ATH) price of approximately $22.89 on April 29, 2018, during the cryptocurrency market’s bullish phase, attracting considerable attention from investors and traders.
However, EOS also experienced its lowest price point during the bear market in December 2018, trading at around $1.56, which was part of a broader market downturn. Notably, EOS made a significant move when it transitioned from the Ethereum blockchain to its mainnet on June 2, 2018. This shift generated positive sentiment and interest in EOS.
Subsequent developments, such as the release of EOSIO 2.0 in January 2020, improved the EOS blockchain, enhancing its security and performance. This development had a positive influence on EOS’s price.
On the regulatory front, EOS’s parent company Block. One settled with the U.S. Securities and Exchange Commission (SEC) in September 2020 for conducting an unregistered ICO, highlighting regulatory challenges in the crypto space. However, it did not have an immediate negative impact on the price.
As of April 17th, 2024, the current EOS price is $0.73, exhibiting a 2.60% decrease in the past 24 hours. EOS holds the #96 position in the CoinMarketCap ranking, boasting a live market cap of $823,824,021.
EOS’s price has is influenced by general market volatility, regulatory news, and macroeconomic factors, leading to price fluctuations. Potential investors must carefully consider these factors and conduct their research before entering the EOS market, given the inherent volatility of the cryptocurrency space.
More on EOS
What is EOS?
EOS is one of the best-known cryptocurrencies today that allows building decentralized apps (DApps) simple and scalable. EOS cryptocurrency was developed by a company called Block.one.
Founded by software programmer Daniel Larimer and entrepreneur Brendan Blumer, who still hold the roles of CTO and CEO, the company began to work on the project in 2017.
In June 2018, the EOS officially went live after a year-long Initial Coin Offering (ICO). The ICO raised more than $4 billion despite the prohibition on participation from U.S. investors. To this day, the ICO is one of the largest token sales, while the EOS blockchain continues to be one of the largest cryptocurrencies by market capitalization and trading volume.
How does EOS Work?
EOS uses its own proof of stake EOSIO blockchain that processes transactions quickly, scalable, and securely. The EOSIO 2.2.0-rc1 includes three new features: Read-only Queries, Private Chain Access, and Resource Payer.
Initially, EOS used ERC-20 tokens to distribute the coins raised in the ICO, which helped ease the ICO process as the ERC-20 token was frequently used to raise an ICO.
Later, all of the ERC-20 tokens were converted to native EOISO blockchain tokens, allowing token holders to finally transact and operate on the network.
Block producers on the EOS network are chosen in a delegated-proof-of-stake mechanism (DPoS), which requires EOS token holders to lock in their coins for over three days.
The DPoS mechanism allows for a lower entry threshold, which results in more decentralization, less power used, and more scalability for the network.
Existing EOS partners
Recently, Google announced that it has partnered with Block.one, to become a block producer for the network. It is one of the largest partnerships in the cryptocurrency ecosystem to date and will likely further increase EOS’s popularity.
Another great partnership for EOS and its developer, Block, was recently made with investor LACChain, an Inter-American Development Bank initiative to promote blockchain use and crypto market development across Latin America and the Caribbean.
A similar partnership was made in Asia in 2018, as a $200 million joint venture fund – EOS Global- was created with local blockchain technology entrepreneurs Michael Cao and Winnie Liu.
Recently, Wyoming became the first country worldwide to give official status to an EOS-based DAO or decentralized autonomous organization. The American CryptoFED DAO features two tokens, Ducat and Locke, with a cap of 10 trillion tokens.
Projects built on EOS
- Eosfinex is a non-custodial trading platform that allows trading using the security of an EOS non-custodial wallet.
- EOSDT is a decentralized stablecoin, just like the well-known USDT. It is available on large exchanges such as HitBTC, Bancor, and Changelly.
- Defibox combines the blockchain with DeFi protocols, allowing Swap and Lend to use their native stablecoin – BOX.
- Upland is a virtual property trading game that runs on the EOS blockchain. It has over 35 thousand users with over $500 thousand transaction volume.
- American CryptoFed DAO is the world’s first payment structure to issue a digital asset whose value is noninflationary.
DeFi and EOS: Expanding Frontiers
Decentralized Finance (DeFi) has emerged as a pivotal area of growth in the blockchain sector, and EOS has quickly aligned with this trend. The network’s ventures into the DeFi space are expected to catalyze the development of innovative financial services on its platform.
By leveraging its inherent features like high transaction throughput and lower transaction costs, EOS is poised to become a significant player in the DeFi arena. The network’s involvement in DeFi ranges from funding promising projects to forming strategic alliances, setting the stage for a more diverse and inclusive financial ecosystem on the blockchain.
Looking Ahead: EOS in 2024 and Beyond
As 2024 unfolds, the expectations from EOS are high. The network’s recent activities suggest a clear trajectory towards becoming a more inclusive, versatile, and developer-friendly platform. The focus on dApps and gaming, coupled with strategic DeFi investments, positions EOS well in the competitive blockchain landscape.
The integration of EVM is a crucial step in ensuring interoperability and user engagement. EOS is expected to continue its path of innovation and strategic partnerships, potentially leading to increased adoption and a stronger presence in the global cryptocurrency market.
EOS’s journey in 2024 and beyond will blend technological advancement and strategic market positioning. Its efforts to expand its ecosystem, coupled with a focus on user experience and developer support, will likely keep it at the forefront of blockchain innovation. As the digital economy evolves, EOS’s adaptability and strategic investments are anticipated to shape its future significantly.
Summing up the EOS coin price prediction, we are bullish on this cryptocurrency despite the current bear trend. However, even though this coin has stayed stable over the last few years, there were times when it fell below 90%, erasing most of the gains of early investors.
EOS may seem like a solid investment. Although the EOS price forecast here varies, we predict it will regain its bullish stance. So, if you believe in EOS and want to invest in it, it is better to conduct thorough research before investing. Ensure you invest money you can afford to lose.
Conclusion
EOS has experienced a mixed trading day with a slight bullish sentiment prevailing. While the coin has seen a modest price decrease of 2.60% over the last 24 hours, it faces resistance at $0.7583 and potential support retest at $0.6756. The 1-day price chart indicates a potential bullish reversal supported by the 4-hour chart which shows a potential breaking out from the current consolidation.
Despite market fluctuations, the introduction of Wrapped RAM (WRAP) and the the exSat docking layer for Bitcoin scalability has injected renewed optimism into the community, forming a basis for a bullish trend reversal.
As EOS navigates these developments, traders and investors should remain vigilant and consider technical and fundamental factors in their decision-making process. The industry eagerly awaits the unfolding impact of EOS’s strategic initiatives on its position in the competitive cryptocurrency landscape.