The Algorand Technology’s website mentions that the blockchain trilemma, a term coined by Vitalik Buterin to mean that no blockchain could be simultaneously scalable, secure, and decentralized, does not apply to the Algorand blockchain. A technological breakthrough they achieved at the very launch in 2019.
Algorand’s technical innovations and applications made it an interesting prospect for investors looking for coins that cover smart contracts and interoperability. During his lecturing days, the blockchain was also a favorite for Gary Gensler, the SEC chairman. That, however, did not prevent the SEC from arguing that ALGO was a security.
ALGO’s performance, however, has not been enticing. According to an analysis from IntoTheBlock, 89% of its holders are in losses at current prices. The coin has also been down 94% from its initial listing price in 2019 and 24% over the last 30 days.
Does ALGO have the potential of hitting the $10 mark? Will ALGO ever go up? Where will ALGO be in 5 years? Let’s answer them using our Algorand price prediction.
Overview
| Cryptocurrency | Algorand |
|---|---|
| Token | ALGO |
| Price | $0.1877 |
| Market Cap | $1,528,613,475 |
| 24-hour Trading Volume | $49,051,042 |
| Circulating Supply | 8,145,295,222 |
| All-time High | $3.28 |
| All-time Low | $0.08761 |
Algorand Price Prediction: Technical Analysis
| 30-Day Price Prediction | $0.2040 |
| Volatility (30-day variation) | 12.19% |
| 50-Day SMA | $0.2254 |
| 14-Day RSI | 43.50 |
| Sentiment | Neutral |
| Fear & Greed Index | 48 (Neutral) |
| Green Days | 14/30 (47%) |
| 200-Day SMA | $0.1831 |
Algorand price analysis
TL: DR Breakdown;
- ALGO forms a head-shoulder pattern on the daily chart.
- There is little market momentum to sustain a breakout.
Algorand’s momentum is slowing here is how.
ALGO price analysis 1-day chart: Algorand completed head shoulder pattern
Looking at the 1-day chart, ALGO made an unprecedented move earlier this week, breaking the $0.2 resistance to a high of $0.264. The day registered a trading volume of $422 million, the largest traded in a day this year. On the same day, a group of talented students and teachers from Portugal sent an Algorand node and a cosmic rays detector (Geiger) into outer space aboard a stratospheric balloon!
However, the price corrected a day later, forming a head-shoulder trend reversal pattern. In current areas, the price should break out upwards; however, the MACD indicates little market momentum.
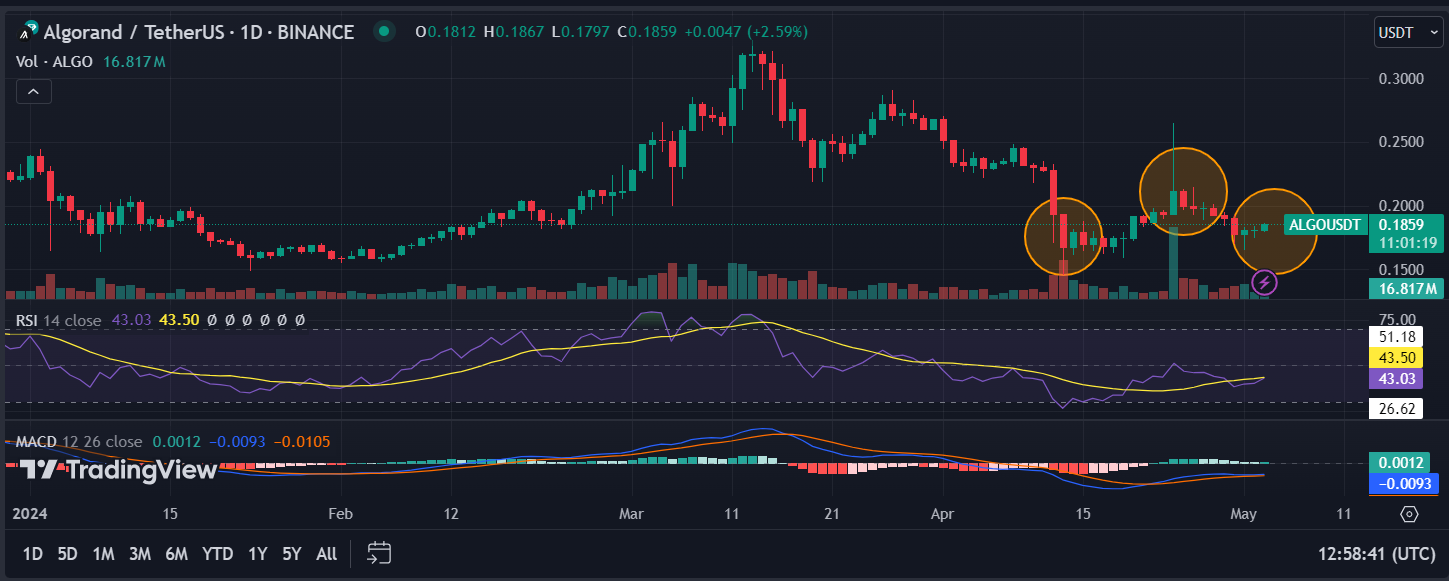
ALGO/ USD 4-hour price chart: Bulls aim for an immediate correction above moving averages
The 4-hour Algorand price analysis chart shows it moved into consolidation after correcting on the 25th. Longer periods of consolidation are accompanied by longer breakouts. The direction of the coming breakout is not evident; however, positive momentum is building up gradually.

Algorand Technical Indicators: Levels And Action
Algorand Moving Averages
| Daily Simple Moving Average (SMA) | ||
| Period | Value ($) | Action |
| SMA 3 | 0.1785 | BUY |
| SMA 5 | 0.1820 | BUY |
| SMA 10 | 0.2052 | SELL |
| SMA 21 | 0.1949 | SELL |
| SMA 50 | 0.2254 | SELL |
| SMA 100 | 0.2141 | SELL |
| SMA 200 | 0.1831 | SELL |
| Daily Exponential Moving Average (EMA) | ||
| Period | Value ($) | Action |
| EMA 3 | 0.1840 | SELL |
| EMA 5 | 0.1850 | SELL |
| EMA 10 | 0.1950 | SELL |
| EMA 21 | 0.2135 | SELL |
| EMA 50 | 0.2256 | SELL |
| EMA 100 | 0.2157 | SELL |
| EMA 200 | 0.1955 | SELL |
| Weekly Simple Moving Average (SMA) | ||
| Period | Value ($) | Action |
| SMA 21 | -0.34 | BUY |
| SMA 50 | -0.24 | BUY |
| SMA 100 | -0.31 | BUY |
| SMA 200 | -0.06 | BUY |
| Weekly Exponential Moving Average (EMA) | ||
| Period | Value ($) | Action |
| EMA 21 | 0.2006 | SELL |
| EMA 50 | 0.1997 | SELL |
| EMA 100 | 0.2632 | SELL |
| EMA 200 | 0.0675 | BUY |
Algorand Oscillators
| Period | Value | Action |
| RSI (14) | 43.50 | NEUTRAL |
| Stoch RSI (14) | 78.33 | NEUTRAL |
| Stochastic Fast (14) | 21.47 | NEUTRAL |
| Commodity Channel Index (14) | -66.67 | NEUTRAL |
| Average Directional Index (14) | 18.45 | NEUTRAL |
| Awesome Oscillator (5,34) | -0.02 | NEUTRAL |
| Momentum (10) | -0.01 | NEUTRAL |
| MACD (12,6) | 0.00 | NEUTRAL |
| Williams Percentage Range (14) | -78.53 | NEUTRAL |
| Ultimate Oscillator (7,14,28) | 46.43 | NEUTRAL |
| VWMA (10) | 0.20 | SELL |
| Hull Moving Average (9) | 0.18 | SELL |
| Ichimoku Cloud B/ L (9,26,52,26) | 0.20 | NEUTRAL |
What to expect from ALGO price analysis next?
At the current price, Algorand has formed a trend reversal pattern on the daily chart. An increase in positive momentum will fuel an upward breakout to support levels.
Recent News/ Update
Algorand is quickly adopting Python as its canonical programming language. Python has a user base of over 10 million developers but is often overlooked by platforms. Algorand Foundation Chief Technology Officer John Woods terms this change as a ‘seismic change.’
ALGO holders can also participate in Real World Assets (RWA); here is a real estate by Lofty.
Algorand Price Prediction May 2024
Algorand is trading on general market sentiment arising from the Bitcoin post-halving event. It will recover from current levels to trade between $0.1721 and $0.2410 in June, with the average price at $0.2040.
| Algorand Price Prediction | Potential Low ($) | Average Price ($) | Potential High ($) |
| June 2024 | 0.1721 | 0.2040 | 0.2410 |
Algorand Price Prediction 2024
As the second half of 2024 unfolds, ALGO’s trajectory diverges from its expected breakout rally post-halving. This movement is visible as it defends support at 17 cents.
Presently, ALGO is bearish, as evidenced by the price registering lower highs. However, current predictions hint at a market reversal in June.
| Year | Potential Low ($) | Average Price ($) | Potential High ($) |
| 2024 | 0.1527 | 0.2650 | 0.2841 |
Algorand Price Prediction 2025
Algorand Inc. community is quickly driving more utility into the Algorand ecosystem. The platform also provides permissioned blockchain services to businesses where privacy and centralization could be a priority.
Algorand price forecast for 2025 is a high of $0.4464. However, in case of a market correction from the post-Bitcoin halving, the ALGO price might rest at $0.3988, making an average of $0.4121.
| Year | Potential Low ($) | Average Price ($) | Potential Low ($) |
| 2025 | 0.3988 | 0.4121 | 0.4464 |
Algorand Price Predictions 2026 – 2030
| Year | Potential Low ($) | Average Price ($) | Potential High ($) |
| 2026 | 0.5609 | 0.5815 | 0.6969 |
| 2027 | 0.8077 | 0.8367 | 0.9699 |
| 2028 | 1.14 | 1.18 | 1.40 |
| 2029 | 1.67 | 1.72 | 1.92 |
| 2030 | 2.38 | 2.47 | 2.86 |
Algorand Price Prediction 2026
The year 2026 will experience more bullish momentum. As per the Algorand ALGO price forecast, it will range between $0.5609 and $0.6969, with an average trading price of $0.5815.
The growth might result from expanding the Algorand community as it draws more users.
Algorand Price Prediction 2027
Moving into 2027, Algorand’s price forecast will climb even higher. As per ALGO Price Prediction, it will range between $0.8077 and $0.9699, an average of $0.8367.
New partnerships and developments with Algorand Technologies could facilitate this growth, enhancing the utility and demand for ALGO.
Algorand Price Prediction 2028
By 2028, the analysis suggests a further acceleration in ALGO’s growth. As per the ALGO Price Prediction, the price can reach between a minimum price of $1.14 and a maximum price of $1.40, an average of $1.18.
Technological developments in the Algorand could propel growth during this period. By this period, we anticipate lower transaction costs and faster settlements on the blockchain, facilitating the ease of use of ALGO.
Algorand Price Prediction 2029
As per Algorand’s Price Prediction 2029, ALGO’s price could rise and fall between $1.67 and $1.92, with a year-round average of $1.72.
Algorand Foundation’s ongoing efforts to secure more global partnerships and achieve wider adoption of its token might play a pivotal role in this anticipated price rise.
Algorand Price Prediction 2030
Lastly, as per the Algorand forecast for 2030, ALGO’s price is forecasted to range between $2.38 and $2.86, making an average of $2.47.
This long-term optimistic view hinges on Algorand’s increasing global recognition and adoption. As more businesses and organizations incorporate the Algorand blockchain, the demand could potentially surge, driving its value higher.
Algorand Market Price Prediction: Analysts’ APE Price Forecast
| Firm Name | 2024 | 2025 |
| Binance | $0.2364 | $0.2482 |
| DigitalCoinPrice | $0.38 | $0.42 |
| CryptoPredictions | $0.3478 | $0.3891 |
Algorand Price History
2019
Algorand held its token sale in June 2019 at $2.4 each. Earlier funding rounds were held by Union Square Ventures, Lemniscap, and NGC Ventures, among others. The public sale raised $60.40 million while funding rounds raised $66.00 million. Token sale participants who held their tokens to date are down 90%.
Binance listed ALGO on 21 June. According to data from Coinmarketcap, ALGO pumped on listing to reach its all-time high (ATH) of $3.28.
ALGO crashed four months later, losing over 90% from ATH.
2020
Coinbase listed ALGO in July 2021 as cheap blockchains continued to gain relevance within the crypto community. The coin gradually recovered; the highest price recorded for the year was $0.637 in August.
2021
In retrospect, 2021 was the golden year for the crypto market. Several factors contributed to the year’s bullish cycle; these include:
- Emergence of NFTs
- Growth of Decentralized Finance (DeFi)
- Institutional interest
- Celebrity endorsements
Some coins like Gala, pumped as much as 10,821%. AXS pumped 10,598%.
ALGO rose from a low of $0.32 in January to $2.3 in October—a 700% gain.
2022
Nothing prepared the coin for the 2022 crypto winter. The FTX exchange crashed, exposing a $8 – $10 billion hole in their accounts. The crash worsened an already bad situation. The year closed with ALGO trading at $0.23.
2023
The decline continued through 2023, registering its all-time low price at $0.0876 in September. Luckily, market recovery started in October, preventing any further bloodshed. Crypto investors were warming up to the listing of spot Bitcoin ETFs and the Bitcoin halving event approaching in 2024. By the close of the year, ALGO had risen above $0.2.
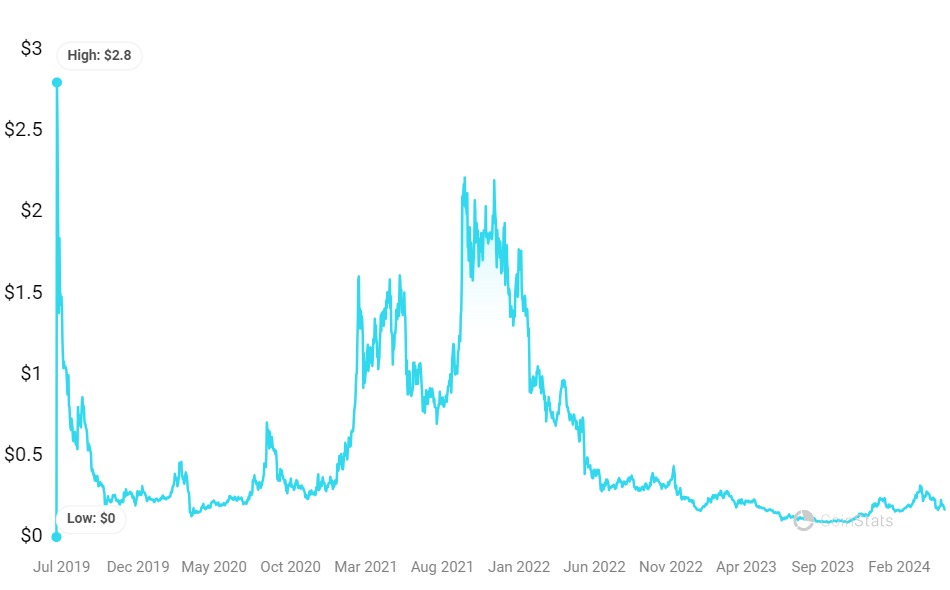
Algorand Price History chart, source: Algorand Token Price, Charts & Market Insights | Your Crypto Hub
Read More: