
Weekly crypto price analysis for major tokens such as Bitcoin( BTC), Ethereum (ETH), Binance(BNB), Solana(SOL), XRP, Cardano(ADA), and Dogecoin(DOGE) shows a promising outlook for the market. Most digital assets display sideways trend momentum and challenging resistance levels, with slight correction over the past 24-hours.
Leading the pack, Bitcoin (BTC) has successfully maintained its position above the $66,000 mark, showing signs of a bullish momentum after the Bitcoin Halving. The broader market has mirrored this positive trend, with significant buying interest observed across several key cryptocurrencies.
The broader market has mirrored this positive trend, with significant buying interest observed across several key cryptocurrencies. Crypto exchanges are having a frenzy with cryptocurrency trading.
Ethereum (ETH), holding the title of the second-largest digital currency by market cap, has not been left behind. The past week saw Ethereum breach the $3,200 barrier, a bullish signal reinforcing the positive market sentiment. Similarly, Binance Coin (BNB) has shown remarkable stability, consistently trading above $600 and inching closer to overcoming the $600 resistance mark.
Solana (SOL), known for its efficiency and lower transaction costs, has seen a surge in price, with its price soaring past $150. XRP has also enjoyed a week of gains, climbing by over 4% and trading above $0.53. This upward movement has sparked conversations about its potential to reach the $0.6 mark. Cardano has seen a notable surge, with ADA appreciating by more than 7%, while Dogecoin experienced a slight decrease of 4% in the past week.
Bitcoin(BTC)
Bitcoin (BTC) has shown a bullish trend in the recent weekly price analysis, consistently finding strong support above the $66,000 mark. This solid foundation sets the stage for an anticipated upward movement toward a $70,000 resistance level after Bitcoin halving.
Currently, Bitcoin stands at $66,208 after a slight dip from $63,000 levels. Bitcoin’s market capitalization crosses the $1.3 trillion threshold. Over the last week, Bitcoin has witnessed a slight decrease of over 0.24% in value, signaling a sideways trend.

Bitcoin price chart: TradingView
Technical indicators further reinforce the optimistic outlook for the BTC/USD pair, with a majority signaling a buy. The Relative Strength Index (RSI) demonstrates above-average readings, reflecting a potent buying pressure within the market.
Additionally, the Moving Averages Convergence Divergence (MACD) indicator has experienced a bullish crossover, suggesting the potential onset of a new bull market phase. The 20-SMA and 50-SMA underscore this bullish trend, with the 20-SMA providing sturdy support for Bitcoin’s price.
Ethereum (ETH)
Ethereum (ETH), the market’s second behemoth, mirrors this bullish sentiment, having peaked at over $3200 in the last week. The demand for ETH has been markedly strong, with the cryptocurrency securing second position on the coin market cap
Ethereum’s current trading price is $3,231, with a slight dip of 0.11% in the past week. With a market capitalization exceeding $387 billion.
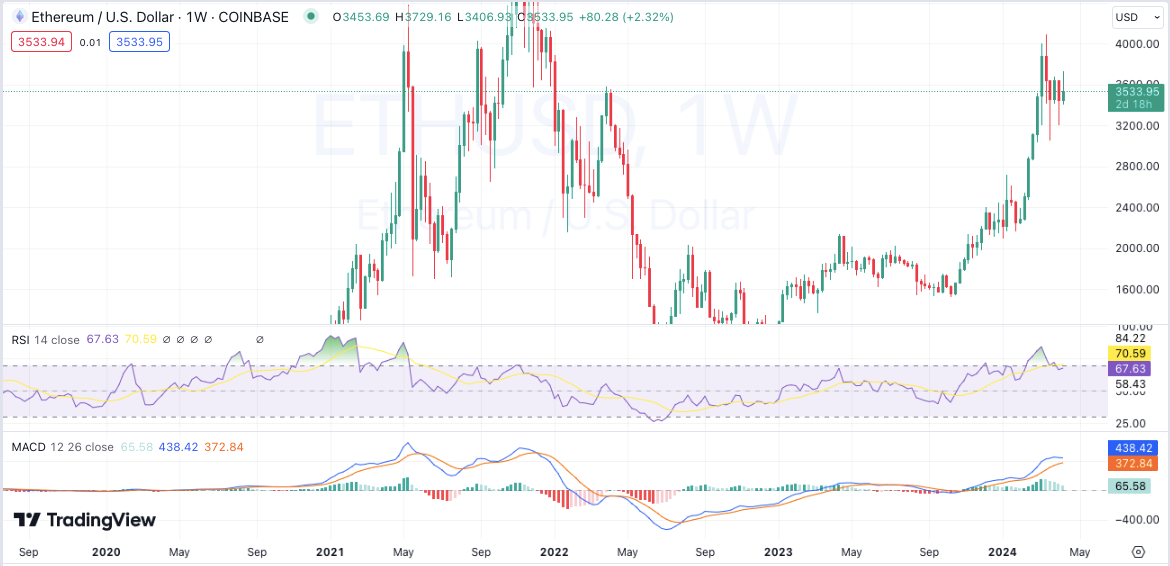
Ethereum price chart: TradingView
The technical landscape for ETH/USD is equally promising, with key indicators aligning on the bullish side of the spectrum. The RSI stands above the 67 mark, indicating vigorous market demand.
The MACD’s bullish crossover points towards a continuing positive trend for Ethereum. Moreover, the 20-EMA and 50-EMA serve as significant support levels, bolstering Ethereum’s bullish posture in the market.
Binance Coin (BNB)
Binance Coin (BNB), the proprietary digital asset of the globally recognized Binance exchange, has showcased a bullish pattern over the recent week, reaching heights surpassing $600. The market’s demand for BNB has been notably robust, resulting in a valuation increase of over 9% within the last seven days.
Presently, Binance Coin’s market capitalization stands impressively over $89 billion, positioning it as the fourth-largest cryptocurrency by market size. BNB’s trading price is $605, marking a 4% increase in the past 24 hours.
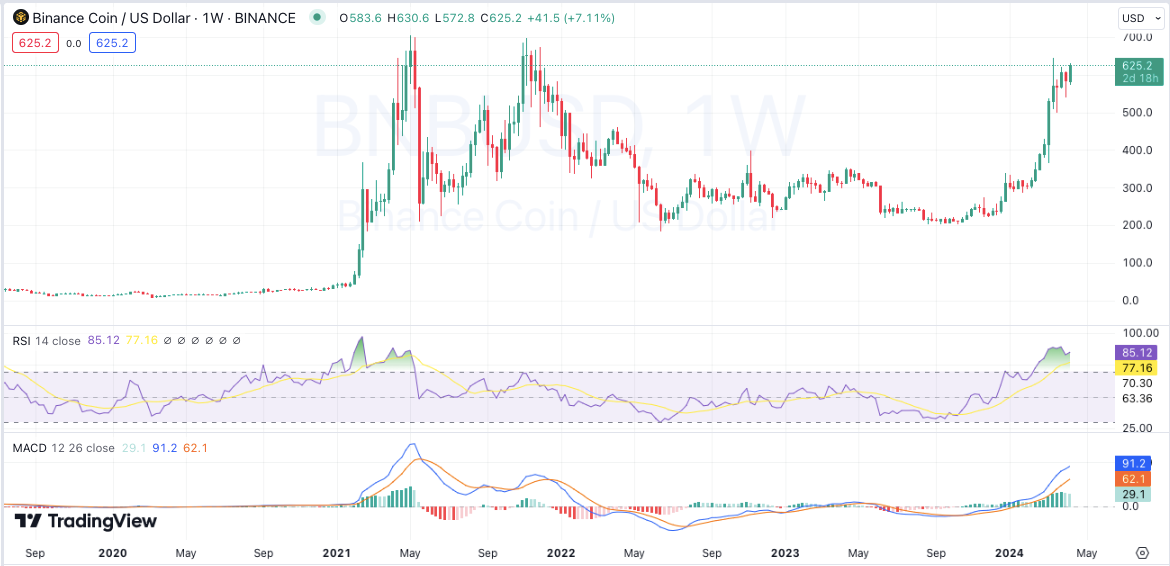
Binance price chart: Tradingview
Technical indicators for the BNB/USD pairing suggest a trajectory for continued upward movement, with a consensus among indicators leaning towards a buy position. The Awesome Oscillator’s position above the zero line signals a continuing bullish momentum for Binance Coin.
Additionally, the 20-SMA and 50-SMA serve as pivotal support levels that may catalyze the asset toward encountering new resistance thresholds. Both the RSI and MACD indicators align with a bullish future for BNB.
Solana (SOL)
Solana (SOL), marking its presence as one of the standout performers over the past year, has witnessed its price surge beyond $150, with a market correction from $160 levels. This altcoin has been on a bullish ascent, bolstered by increasing purchasing pressure and setting new yearly highs. Currently, Solana is priced at $155, with a notable surge of 2% increase over the last week and a monthly upturn of 5%.
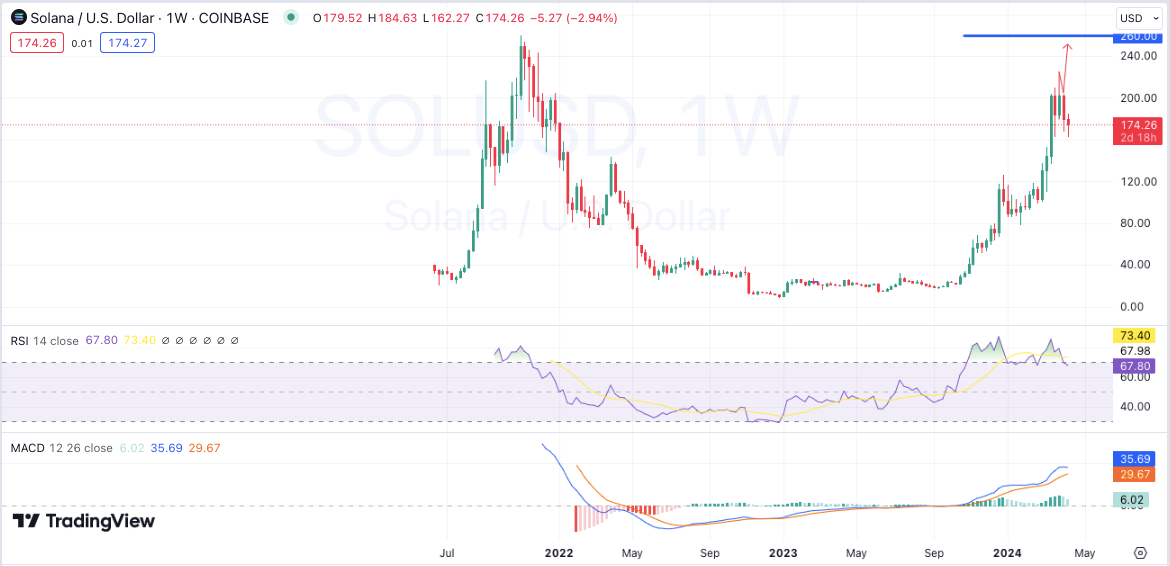
Solana price chart: Tradingview
Continued bullish momentum could see SOL challenging the $160 resistance level. Conversely, should the Bears stage a comeback, Solana will find substantial support at the $150 threshold. The technical outlook for SOL/USD hints at a promising uptrend, with most indicators advocating a buy. Venturing into the overbought territory, the RSI signifies intense market interest in Solana. The MACD echoes this bullish sentiment, while the 20-MA supports SOL’s current market position.
XRP
XRP has recently embarked on a bullish journey after spending most of Aprill below the $0.6 mark. The XRP/USD pair broke past this level, oscillating around the $0.55 resistance point. The past week saw XRP amassing a growth of approximately 4%, with its current trading value at $0.5377.
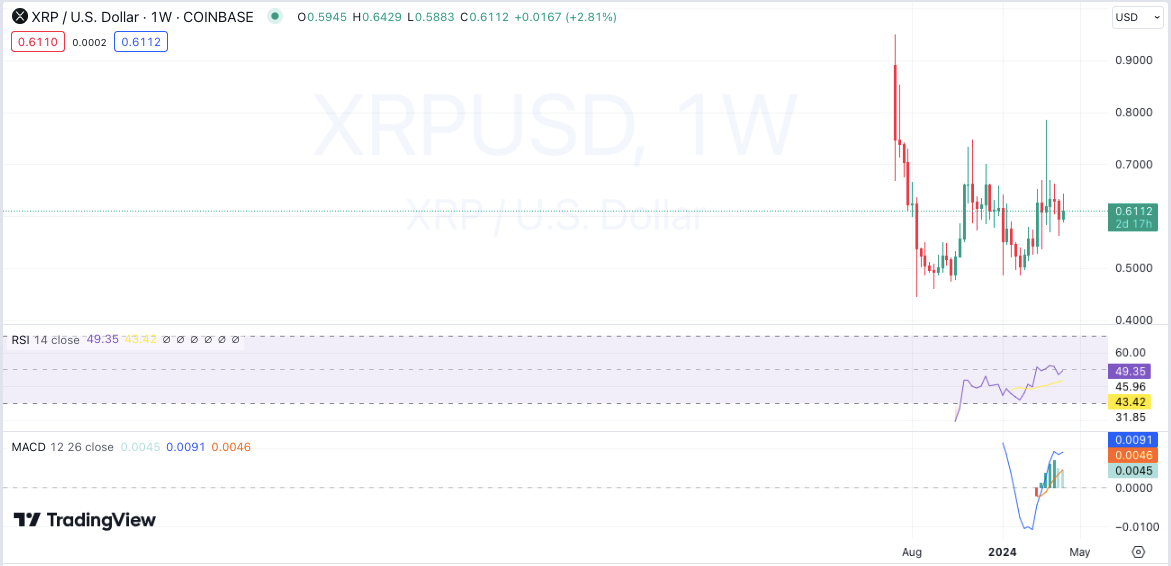
XRP price chart: Tradingview
If XRP’s momentum is sustained, breaking through the $0.55 barrier might set its sights on reaching $0.60, though this level presents a formidable challenge. Analytical indicators, including moving averages and oscillators for XRP/USD, endorse a bullish stance, with the majority signaling a buy.
The Relative Strength Index, below 50, underscores the strong market demand for XRP. The MACD indicator’s bullish crossover hints at the potential for further price ascension, with the 20-day EMA and 50-day SMA reinforcing XRP’s support base.
Cardano(ADA)
Weekly crypto market analysis shows that ADA/USD has been trading bullish over the past week, with green candlestick patterns dominating the charts. The token has gained more than 5% in value over the past seven days, reaching a high of over $0.55. ADA is trading at $0.5114, with a market capitalization of over $18 billion.
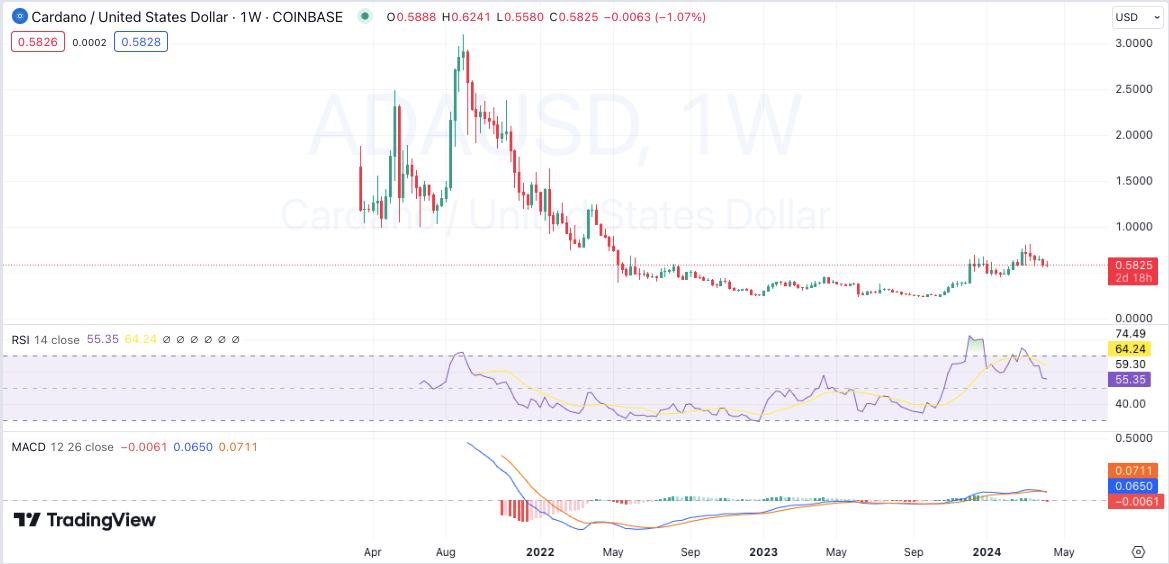
Cardano price chart: Tradingview
Technical indicators for ADA/USD also support a bullish outlook, with most indicators showing a buy signal. The RSI is hovering above 50, indicating a strong buying pressure in the market. The MACD indicator has also formed a bullish crossover, showing potential for further upside in price. The 20-MA and 50-MA are acting as strong support levels for ADA.
Dogecoin(DOGE)
Dogecoin (DOGE), the meme-based cryptocurrency, has seen a slight decrease in price with slight decrease of 0.8% in the past 24-hours and a decrease of 2.92% in the past week, indicating market fluctuations. Currently, the Dogecoin is at $0.1624, with bullish and bearish struggling to gain momentum.

Dogecoin price chart: Tradingview
The technical indicators for DOGE also support a bullish sentiment. The MACD indicator has shown a bullish crossover, indicating strong buying pressure in the market. The RSI is hovering above 60 levels, indicating a neutral trend. The 20-day EMA is also above the 50-day SMA, supporting a bullish trend.
Weekly crypto price analysis conclusion
Weekly crypto price analysis of popular digital assets shows that most are showing bullish signs, with slight correction in the past week. The candlestick pattern of the most green coins on the weekly charts also suggests that buyers are in control and may continue to push prices higher. Technical indicators also support a bullish outlook, with buying pressure expected to continue in the coming weeks.