


Key Takeaways
- In 2026, the Shiba Inu coin price prediction suggests a maximum value of $ 0.000004491.
- In 2029, SHIB is expected to reach a maximum value of $0.00000820.
- The price of Shiba Inu is predicted to reach a maximum value of $0.00001960 in 2032.
Shiba Inu (SHIB) is a community-driven cryptocurrency, which was created by the anonymous founder called Ryoshi in August 2020. What began as a meme coin has evolved into a wider ecosystem, with ShibaSwap, Shibarium, BONE, and LEASH all playing their part to keep SHIB one of the biggest meme-based cryptocurrencies by market cap.
The ecosystem remains strong with recent Shiba Inu developments. SHIB’s wallet count has hit an all-time high of 1.58 million wallet holders, and exchange reserves are at near-yearly lows, indicating continued accumulation. Shibarium, a project’s Layer-2 blockchain, keeps growing network activity and provides reduced transaction costs throughout the ecosystem. Also, the community has organized NFT and art incubators, and trading platform Kalshi recently added regulated SHIB perpetual contracts to the U.S. market.
Shiba Inu’s price action is heavily influenced by Bitcoin’s price action, market sentiment, social media trends, investor sentiment, and the growth of the Shiba ecosystem. Factors such as token burns, Shibarium adoption, and utility-focused integrations can potentially impact Shiba Inu’s future price and long-term growth prospects.
The cryptocurrency market has been impacted by market volatility, and investors are keen to see if SHIB will be able to get back into bull mode in the near future. In this Shiba Inu price prediction, we will explore the future price potential, technical analysis, market conditions, and forecast potential price movements of SHIB in the range of 2026 to 2032. In this Shiba Inu price prediction, we will examine and discuss the future price potential for SHIB, the technical analysis, and the market conditions, and forecast the possible price movements for SHIB between the years of 2026 and 2032.
Shiba Inu Price Prediction 2026: Overview
| Cryptocurrency | Shiba Inu |
| Token | SHIB |
| Price | $0.000004158 |
| Market Cap | $2.47 billion |
| Trading Volume (24-hour) | $48.88 million |
| Circulating Supply | 589.24T SHIB |
| All-time High | $0.00008845 (Oct 27, 2021) |
| All-time Low | $0.00000000008165 (Aug 31, 2020) |
| 24-hour high | $0.00000424 |
| 24-hour low | $0.00000417 |
Shib price prediction: Technical Analysis
| Metric | Value |
|---|---|
| Volatility | 6.70% (High) |
| 50-Day SMA | $0.000005117. |
| 14-Day RSI | 25.95 (Oversold) |
| Market Sentiment | Bearish |
| Fear & Greed Index | 11 (Extreme Fear) |
| Green Days | 11/30 (37%) |
| 200-Day SMA | $0.000006281 |
The 50-Day SMA has been declining since June 26, 2026, and the 200-Day SMA since May 31, 2026. Bearish sentiment and extreme fear also show that investor risk appetite significantly impacts Shiba Inu’s price.
SHIB price analysis
- SHIB price analysis shows buyers keeping the token above the $0.0000041 support level.
- Immediate resistance stands at $0.0000045, while support is at $0.0000041.
- Bearish momentum continues to ease as the RSI recovers to 41.90.
The SHIB price analysis for July 25, 2026, shows Shiba Inu extending its recovery after rebounding from recent lows. Buyers have continued to consolidate the $0.0000041 support zone, but the token has failed to break higher resistance, preventing a stronger bullish breakout.
At the time of writing, SHIB trades at $0.00000419, up 0.63% over the past 24 hours. Its market cap has risen to $2.47 billion, while 24-hour trading volume has fallen 17.27% to $48.88 million, indicating traders remain cautious despite the recent gains.
SHIB price analysis – 1-day chart
The daily chart indicates that SHIB is trying to stabilize after weeks of continuous selling. Recent candles are smaller, indicating that bearish momentum is slowing down, and buyers are absorbing selling near recent lows.
However, all attempts to recover from those low levels have stalled below the $0.0000044-$0.0000045 resistance area, showing that bulls still lack the momentum needed to regain control. The decreasing trading volume also indicates that market participants are waiting for a stronger directional move to enter the market.
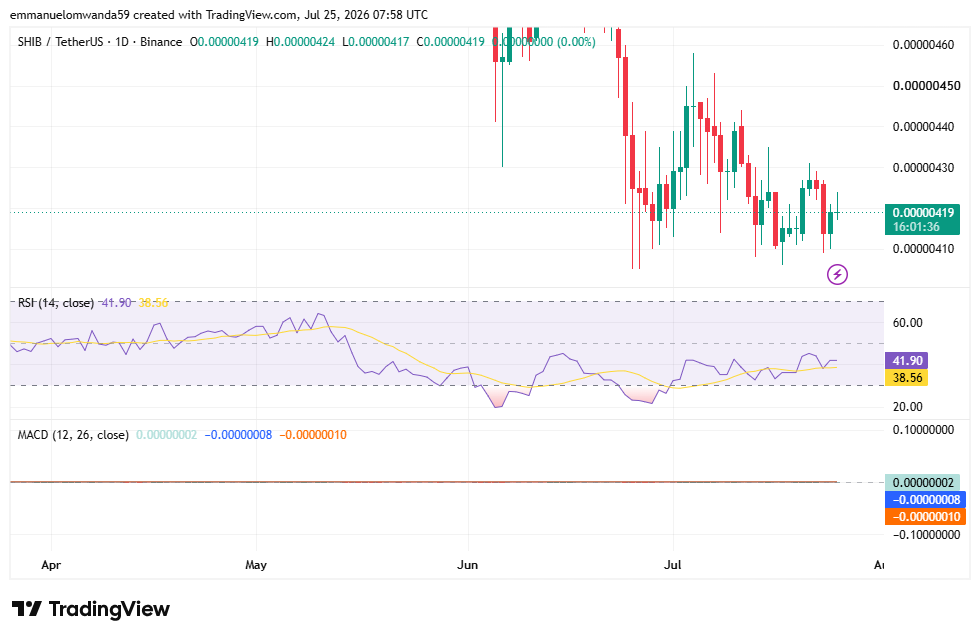
The RSI (14) has recovered from oversold levels and is at 41.90, indicating that selling pressure is slowly easing. Despite this, the indicator is still below 50, signaling that the market hasn’t reached a bullish phase.
The MACD is still trading below the signal line, and the distance between the MACD and the signal line is decreasing, and the negative histogram is getting shorter, indicating that the downside momentum is decreasing.
The moving averages continue to paint a mixed picture. The 3-day and 5-day SMAs remain on buy signals, showing short-term momentum is improving. However, the rest of the SMAs continue to signal sell, confirming that the broader trend still favors the bears.
A daily close above $0.0000045 could strengthen bullish sentiment and set up the potential for more upward movement, while a drop below $0.0000041 would likely attract renewed selling pressure.
SHIB 4-hour price chart
The 4-hour chart shows SHIB trading in a narrow consolidation range after recovering from this week’s lows. Price action has moved away from a series of lower lows, and now the price action is largely sideways, indicating a loss of momentum by sellers and increasing momentum by buyers that are gradually building support.
Recent candles are relatively small, indicating indecision from neither side, with both failing to make a clear breakout. The RSI (14) is currently at 52.03, above the neutral level of 50 for the first time in a few sessions. This suggests short-term buying momentum is strengthening and buyers are beginning to gain the upper hand.
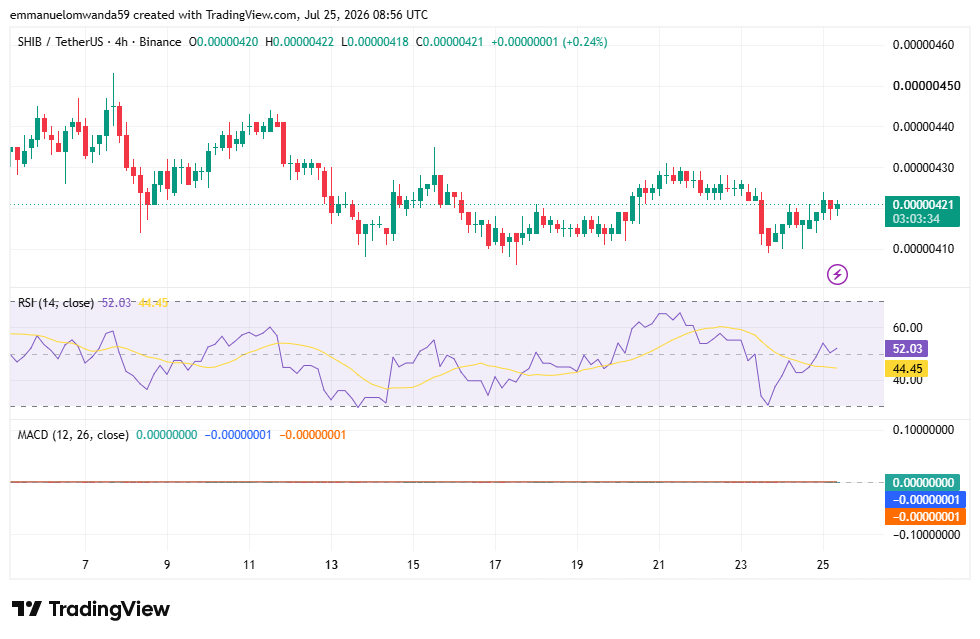
The MACD is close to a bullish crossover, with the MACD line at -0.00000001 and the histogram almost flat, indicating bearish momentum has nearly disappeared. A sustained move above $0.0000043 could encourage buyers to challenge the $0.0000045 resistance. On the downside, the $0.0000041 level is the key support, and a break below it would likely shift momentum back in favor of the bears.
Shiba Inu technical indicators: Levels and action
Daily simple moving average (SMA)
| Period | Value | Action |
| SMA 3 | $0.000004202 | BUY |
| SMA 5 | $0.000004211 | BUY |
| SMA 10 | $0.000004349 | SELL |
| SMA 21 | $0.000004618 | SELL |
| SMA 50 | $0.000005116 | SELL |
| SMA 100 | $0.000005606 | SELL |
| SMA 200 | $0.000006281 | SELL |
Daily exponential moving average (EMA)
| Period | Value | Action |
| EMA 3 | $0.000004212 | BUY |
| EMA 5 | $0.000004241 | BUY |
| EMA 10 | $0.000004349 | SELL |
| EMA 21 | $0.000004566 | SELL |
| EMA 50 | $0.000005002 | SELL |
| EMA 100 | $0.000005505 | SELL |
| EMA 200 | $0.000006565 | SELL |
Is Shiba Inu a good investment?
Shiba Inu price prediction 2026 points to a gradual decline. For crypto investors, traders, and enthusiasts tracking Shiba Inu’s next move, this article breaks down SHIB’s price history, technical analysis, market sentiment, recent developments such as Shibarium and exchange activity, longer-term forecasts through 2032, and what analyst targets suggest for its investment outlook.
Shiba Inu (SHIB) is currently consolidating between key support and resistance, and many traders use candlestick charts to track the opening, closing, highest, and lowest prices over a specific timeframe when monitoring key price levels and price movements. A breakout above resistance levels could lead to gains, while failure to hold support may cause further downside. SHIB may suit investors comfortable with volatility because it remains one of the more speculative assets in the cryptocurrency market, but it is still important to monitor price action closely before making any investment decision. These technical setups may shape SHIB’s movement in the coming days, although short-term price movements are also shaped by market volatility.
Why is Shiba Inu up today?
Shiba Inu is up today as strong exchange outflows suggest investors are accumulating tokens instead of selling, reducing immediate selling pressure. The gains are also supported by a surge in Shibarium activity and a technical rebound from oversold conditions, although the broader trend remains bearish.
Recent news on Shiba Inu
Shiba Inu’s network activity continued expanding as the total holder count climbed to over 1.58 million wallets, while exchange reserves remained near yearly lows at 81.31 trillion SHIB. Shibarium, a Layer-2 blockchain solution, was developed to improve transaction efficiency and reduce gas fees across the ecosystem as part of ongoing ecosystem development and a more robust ecosystem for SHIB-related dApps.
In the Shiba Inu ecosystem, automated token burns are linked to Shibarium transaction fees. Token burning is a strategy used to create scarcity in SHIB. The community also launched an incubator for art and NFTs tied to SHIB ecosystem projects, supporting broader adoption over time, with an active and engaged community contributing to adoption that can drive social media trends and influence market sentiment.
Recent on-chain activity data also showed sustained exchange outflows and net outflows of over 452 billion SHIB, while built-in dApps on social platforms can add utility that feeds back into token demand, signaling continued accumulation despite subdued market trading activity, though sustained growth in active users is still necessary for Shibarium to support higher price floors.
SHIB Market Snapshot
SHIB holder count has climbed to 1,585,249 wallets, continuing the steady expansion of the network while exchange reserves remain near yearly lows.
Latest exchange data: • Total Exchange Reserve: 81.31T SHIB • Total Exchange Netflow: -452.72B SHIB • 7D…
— Shibarium | SHIB.IO (@Shibizens) May 20, 2026
Trading platform Kalshi expanded its U.S. CFTC-regulated crypto perpetuals lineup to include Shiba Inu. The new “American Perpetuals” for SHIB offer up to 2x leverage and have no expiration date, providing a new, regulated venue for derivatives trading
Will SHIB reach $0.00005?
Yes, according to crypto experts’ long-term forecasts, Shiba Inu’s future price includes optimistic projections anticipating $0.00005 by 2032, though predictions vary widely across analysts.
Will SHIB reach $100?
SHIB’s goal of reaching $100 is virtually impossible because its enormous total supply already makes that target unrealistic, even before considering the market capitalization required. Additionally, to get the $100 mark, SHIB would require a significant increase in its market cap, which is beyond imagination for a meme coin.
Does SHIB have an excellent long-term future?
The Shiba Inu price made headlines in January 2025 after Shytoshi Kusama, the lead developer, stepped down. Any current forecast for SHIB also depends on technical factors and fundamental factors, not just leadership changes. However, SHIB shows some positive movement, suggesting the ecosystem may have a promising long-term future.
However, its success will also depend on macroeconomic factors, partnerships, broader market adoption trends, and other regulatory developments that influence market cycles. Shiba Inu’s growth is also tied to global economic conditions and the overall economic climate, alongside its utility and ecosystem development. A lack of practical use cases could hinder growth, and if Shiba Inu fails to sustain value over time, long-term confidence may weaken. Competition from new meme coins can dilute investor interest. Broader adoption across DeFi, gaming, and NFTs could also improve long-term confidence in the project. You are advised to seek investment advice, do your own research, and gather expert opinions before investing in the highly volatile crypto market.
Shiba Inu price prediction for July 2026
In July 2026, Shiba Inu (SHIB) is expected to trade between $0.000004098 and $0.000004469, with an average monthly price of around $0.000004177.
| Month | Potential low | Potential average | Potential high |
|---|---|---|---|
| July 2026 | $0.000004098 | $0.000004177 | $0.000004469 |
Shiba Inu price prediction 2026
Shiba Inu’s price remained under bearish pressure as the token continued trading near lower support levels after repeated market corrections. However, SHIB could attempt a gradual recovery toward the second half of the year if buying momentum improves and broader market sentiment stabilizes.
SHIB might maintain an average trading price of around $0.000004224 in 2026 and could climb toward a maximum level of $0.000004491 if bullish momentum strengthens. However, continued selling pressure may trigger further consolidation, with the price potentially dropping toward the $0.000003802 support zone.
| Year | Potential low | Potential average | Potential high |
|---|---|---|---|
| 2026 | $0.000003802 | $0.000004224 | $ 0.000004491 |
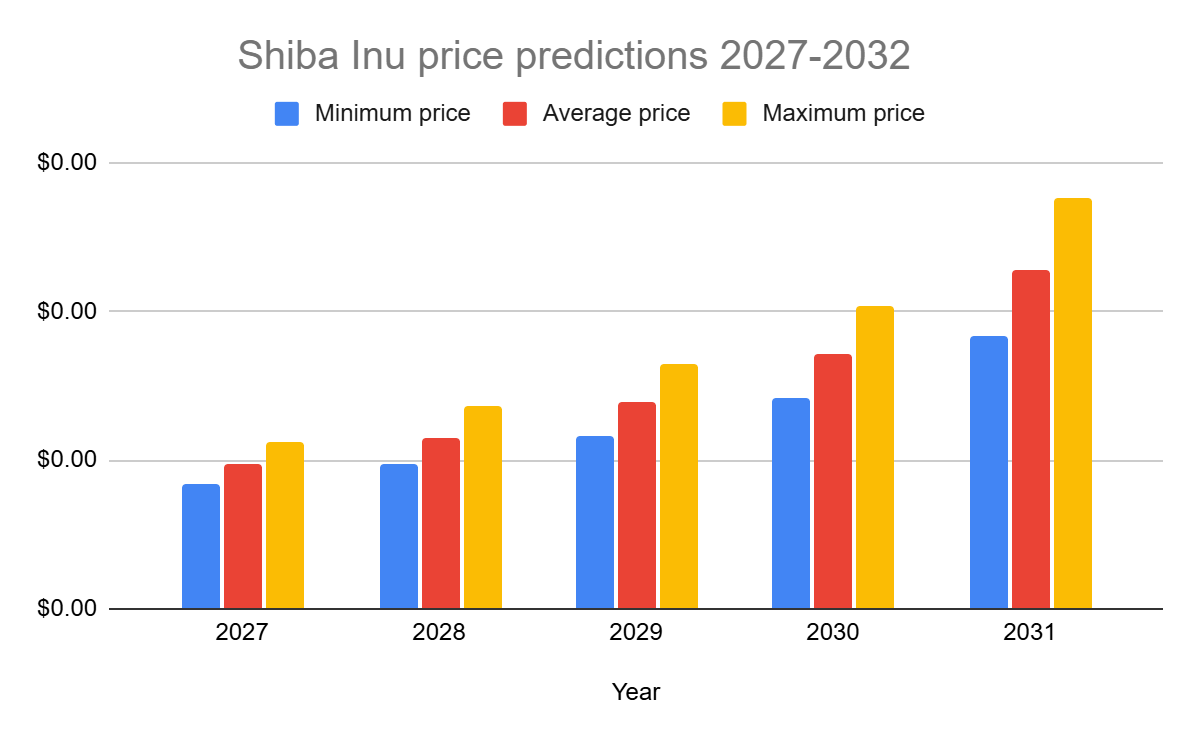
Shiba Inu price predictions 2027-2032
| Year | Minimum price | Average price | Maximum price |
|---|---|---|---|
| 2027 | $0.00000420 | $0.00000485 | $0.00000560 |
| 2028 | $0.00000490 | $0.00000575 | $0.00000680 |
| 2029 | $0.00000580 | $0.00000695 | $0.00000820 |
| 2030 | $0.00000710 | $0.00000860 | $0.00001020 |
| 2031 | $0.00000920 | $0.00001140 | $0.00001380 |
| 2032 | $0.00001250 | $0.00001580 | $0.00001960 |
Shiba Inu Price Prediction 2027
In 2027, the price of Shiba Inu is projected to reach a minimum level of $0.00000420. The SHIB price could rise to a maximum of $0.00000560, with an average trading price of $0.00000485 as the market gradually stabilizes after 2026.
Shiba Inu Price Prediction 2028
The price of Shiba Inu is expected to reach a minimum level of $0.00000490 in 2028. The SHIB price could climb to a maximum level of $0.00000680, with an average price of $0.00000575 throughout the year.
Shiba Inu Price Prediction 2029
In 2029, the price of Shiba Inu is predicted to reach a minimum level of $0.00000580. The SHIB price could reach a maximum level of $0.00000820, with an average trading price of $0.00000695.
Shiba Inu Price Prediction 2030
In 2030, Shiba Inu is forecast to trade at a minimum value of $0.00000710. The price could reach a maximum of $0.00001020, with an average trading value of $0.00000860.
Shiba Inu Price Prediction 2031
In 2031, the price of Shiba Inu is expected to reach a minimum value of $0.00000920. The SHIB price could reach a maximum value of $0.00001380, with an average value of $0.00001140.
Shiba Inu Price Prediction 2032
The Shiba Inu price is forecast to reach a lowest level of $0.00001250 in 2032. The SHIB price could reach a maximum level of $0.00001960, with an average forecast price of $0.00001580.
Shiba Inu market price prediction: Analysts’ SHIB price forecast
Analyst forecasts factor in methodology differences, so predictions vary by source. Across multi-source comparisons for an Inu SHIB price prediction, the average 2026 estimate is $0.00006, and the lowest 2026 estimate is $0.00003.
Benzinga estimates December 2026 at an average of $0.00000928. CoinCheckup forecasts December 2026 at around $0.000009784.
| Firm Name | 2026 | 2027 |
|---|---|---|
| DigitalCoinPrice | $0.00010 | $0.0000216 |
| CoinCodex | $0.000039 | $0.00001299 |
Cryptopolitan’s Shiba Inu price prediction
Our forecasts suggest Shiba Inu could trade between $0.000003802 and $0.000004491 throughout 2026, with an average trading price of around $0.000004224. Market sentiment, meme coin demand, and broader crypto conditions will likely continue influencing SHIB’s price action during the year. This current forecast is based on multiple technical quantitative indicators rather than a single model, and outcomes can shift quickly with broader market sentiment and the overall cryptocurrency market. Any potential profit remains speculative because SHIB is still highly sensitive to shifts in market sentiment and the broader crypto market. $0.000005173 and $0.000027, with an average price of $0.000016086 throughout 2026. Please note that the content provided and other content on this page are for informational purposes only and do not constitute investment advice. Seek independent professional consultation or do your research.
Shiba Inu historic price sentiment
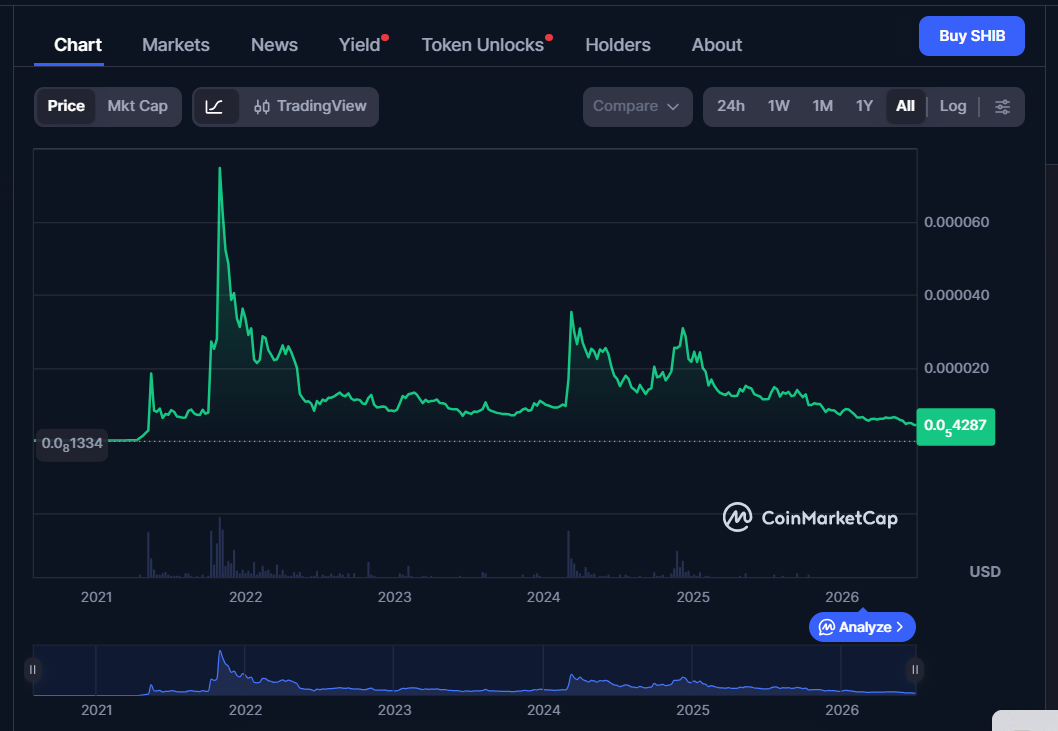
- Shiba Inu surged over 300% shortly after launch, triggering a trading frenzy similar to Dogecoin’s early 2021 rally. Early hype and low individual token prices helped attract investors seeking alternatives. Early demand was amplified when Elon Musk mentioned getting a Shiba Inu dog, boosting attention, while community attention and social media trends were fueling interest and increasing speculative demand. During this period, many investors rushed to buy SHIB on easy-to-use platforms as its popularity surged and exchanges quickly listed the token to meet demand.
- Shiba Inu’s price action has been marked by significant volatility, with historical price movements shaped by community hype, investor sentiment, and broader crypto trends.
- In 2022, SHIB started near $0.000025 but dropped to around $0.000008 by May, then moved between $0.000007 and $0.000010 for the rest of the year.
- In early 2023, Shiba Inu briefly spiked to $0.000015 in February but declined gradually, stabilizing around $0.000010 by June 2023 and closing the year at $0.00001033.
- In March 2024, SHIB climbed to $0.000045 before consolidating between $0.000017 and $0.000029. By late 2024, the price moved between $0.000015 and $0.000033.
- In 2025, SHIB gradually declined from $0.000021 to below $0.000009 by December, despite brief rebounds during the year, and the period was marked by heavy consolidation compared with earlier phases that relied more on social media hype. This reflected a more utility- and ecosystem-driven phase for SHIB than prior hype cycles.
- In early 2026, SHIB briefly recovered to $0.0000098 in January but fell to the $0.0000065 range in February.
- During the first half of 2026, Shiba Inu (SHIB) remained under bearish pressure, falling from around $0.0000098 in January to the $0.0000054–$0.0000062 range by May, despite brief recovery attempts and short-term bullish rebounds. SHIB has also fallen by almost 11.04% in the last 7 days.
FAQs
Where can I buy Shiba Inu?
You can buy Shiba Inu on Uniswap decentralized exchange and Binance cryptocurrency exchanges.
What are Shiba Inu dogs?
Shiba Inus are a type of short dog with prick ears, short paws white markings on their face and chest (white ventral collar) and a brown outer coat with a spirited boldness and good nature. Shibas were originally bred in Japan to hunt small game and dog sports. Their grooming requires regular bathing and daily brushing unlike most breeds (Other dogs). It is a number 1 companion dog after undergoing obedience training. Hip dysplasia is one of the common health conditions for Shibas. Organizations involved with Shibas include the American kennel club, the national breed club, and the Shiba Inu rescue association.
Where can I buy Shiba Inu coins?
You can buy Shiba Inu at Binance, Okex and Bitfinex.
Disclaimer. The information provided is not trading advice. Cryptopolitan.com holds no liability for any investments made based on the information provided on this page. We strongly recommend independent research and/or consultation with a qualified professional before making any investment decisions.

Emman Omwanda
Emmanuel Omwanda’s expertise lies in cryptocurrency markets, spanning both fundamental and technical analysis. He previously worked with various crypto media sites before joining Cryptopolitan, including CoinEdition, The Crypto Basic, CryptoNews Flash, and DroomDroom.He holds a Bachelor of Science (BSc.) in Mathematics and Computer Science from Kenyatta University, Kenya, and is currently in his final year pursuing a Bachelor of Arts in Communication and Media Studies.


