


Best crypto insights delivered straight to your inbox.
Mastering Bitcoin’s Top On-Chain Indicators Ahead Of The BTC Halving Event: NUPL, NVT Signal And More


The much-anticipated Bitcoin halving event is just six months away, set to occur in 2024’s first half. As a result, investors and enthusiasts seek reliable strategies to maneuver through the speculative market storms. One method of securing an investment advantage involves the mastery of essential on-chain indicators, crucial navigational tools in a sea of unpredictable market trends.
Understanding these indicators, especially with a milestone like Bitcoin Halving on the horizon, could be the compass investors need to chart a course toward more confident and informed decisions. This article dives into prominent on-chain metrics such as Net Unrealized Profit/Loss (NUPL), Network Value to Transactions Signal (NVT Signal), and more, elucidating how these tools can fortify an investor’s strategy as the halving event approaches.
The Halving Phenomenon: A Quick Overview
Every four years, or upon the mining of 210,000 blocks, the reward that Bitcoin miners receive for processing transactions undergoes a reduction by half, an occurrence known as “the halving.” This phenomenon effectively diminishes the pace at which new bitcoins are introduced into the system.
This protocol is projected to remain in operation until around the year 2140, at which point the intended cap of 21 million bitcoins should be realized. Beyond this juncture, transaction processing rewards for miners will consist solely of fees paid by network participants. This shift ensures that miners retain ongoing incentives to contribute their efforts, thereby sustaining the network’s functionality.

The halving is a pivotal event, signaling a further decline in the generation rate of new Bitcoins as the currency edges closer to its maximum supply limit. Initially, in 2009, each mined block yielded 50 bitcoins. However, as of October 2023, approximately 19.5 million bitcoins have been brought into circulation, indicating that only about 1.5 million remain to be unearthed through mining rewards.
What Is On-chain And Its Indicators?
On-chain analysis is about using blockchain data to figure out market trends. It involves checking transaction details and how crypto is spread across wallets to make smart investment choices. If only a few “whales” hold most of a crypto, and it’s not being traded much, it might be risky to invest in.

There are tools to help with this. You can use sites like EtherScan or SnowTrace to see details for specific wallets or contracts, but they don’t give you a big-picture view. That’s why platforms have come up that offer charts and tracking tools to understand overall crypto movements better. These platforms, including Glassnode, IntoTheBlock, Nansen, Dune Analytics, and Messari, often have free features, though some may need a subscription.
However, these tools don’t give direct advice. You have to create your own plan based on the data. This is especially true for Bitcoin, as its movements impact the whole crypto market. Services like Glassnode provide detailed Bitcoin data, tracking things like big holders’ activities and market changes. Some of this info is free, but some might require a paid account.
Bitcoin Halving: The Critical Role of On-Chain Indicators
The Bitcoin world gets busy around the “halving” every four years, when miners start earning half the bitcoins for their work. This makes new bitcoins rarer, and people start guessing about prices. Investors use special tools called “on-chain indicators” for hints on what might actually happen instead of just making wild guesses. Here’s the role of on-chain indicators:
- Predicting Market Sentiment: On-chain indicators offer real-time blockchain data, reflecting genuine actions and changes within the network. Metrics such as the Net Unrealized Profit/Loss (NUPL) can help investors gauge market sentiment—whether the majority of market participants are in profit or loss. This insight is particularly crucial as the halving approaches, signaling potential sell-off or holding trends.
- Assessing Network Health: Metrics like the Hash Rate and Mining Difficulty provide live data on miners’ activity, which is crucial for keeping the network secure and efficient. A consistent or increasing hash rate ahead of the halving indicates strong network health and miner commitment, positively influencing investor confidence.
- Understanding Economic Throughput: The Network Value to Transactions Signal (NVT Signal) helps investors discern whether the asset’s price is justified by its on-chain activity. As the halving event often attracts speculative trading, the NVT can indicate if the asset is overvalued, guiding investment decisions.
The halving event underscores the importance of robust on-chain analysis. As the reward for mining new blocks decreases, ensuring Bitcoin’s network health becomes paramount. Investors must pay attention to several specific on-chain metrics to make informed decisions:
- Miner Activity: By observing miner behavior through metrics like Miner’s Rolling Inventory (MRI), investors can predict potential market sell-off or accumulation, as miners may decide to sell their holdings to cover reduced profits or hold, anticipating a post-halving price increase. An increase in miner outflow around the halving event will suggest a bullish scenario for Bitcoin price. On the other hand, an increase in miner netflow will suggest that miners are increasingly sending their Bitcoins to exchanges for selling purposes, which can lead to downward pressure on the price chart.
- Transaction Volume and Fees: Analyze the total volume of transactions and the fees paid for each transaction. An increase in user activity and transaction fees can indicate a healthy network with sustained demand, which is particularly important when miner rewards are halved.
- Spent Output Age Bands: This metric shows the age of coins moved in transactions, indicating market cycles. For instance, older coins becoming active after long periods might suggest long-term holders capitalizing on speculative interest around the halving event.
Top On-Chain Indicators To Watch Ahead Of The Bitcoin Halving Event
Given the historical significance, understanding various on-chain indicators becomes an essential task for investors wanting to potentially capitalize on market trends and patterns related to these events.
Net Unrealized Profit/Loss (NUPL)
One of the most prominent indicators in the Bitcoin investment world is the Net Unrealized Profit/Loss (NUPL). NUPL provides insights into market sentiment by calculating the difference between “unrealized” profits and losses in the network, essentially showing how many coins in the network are in a state of profit or loss.
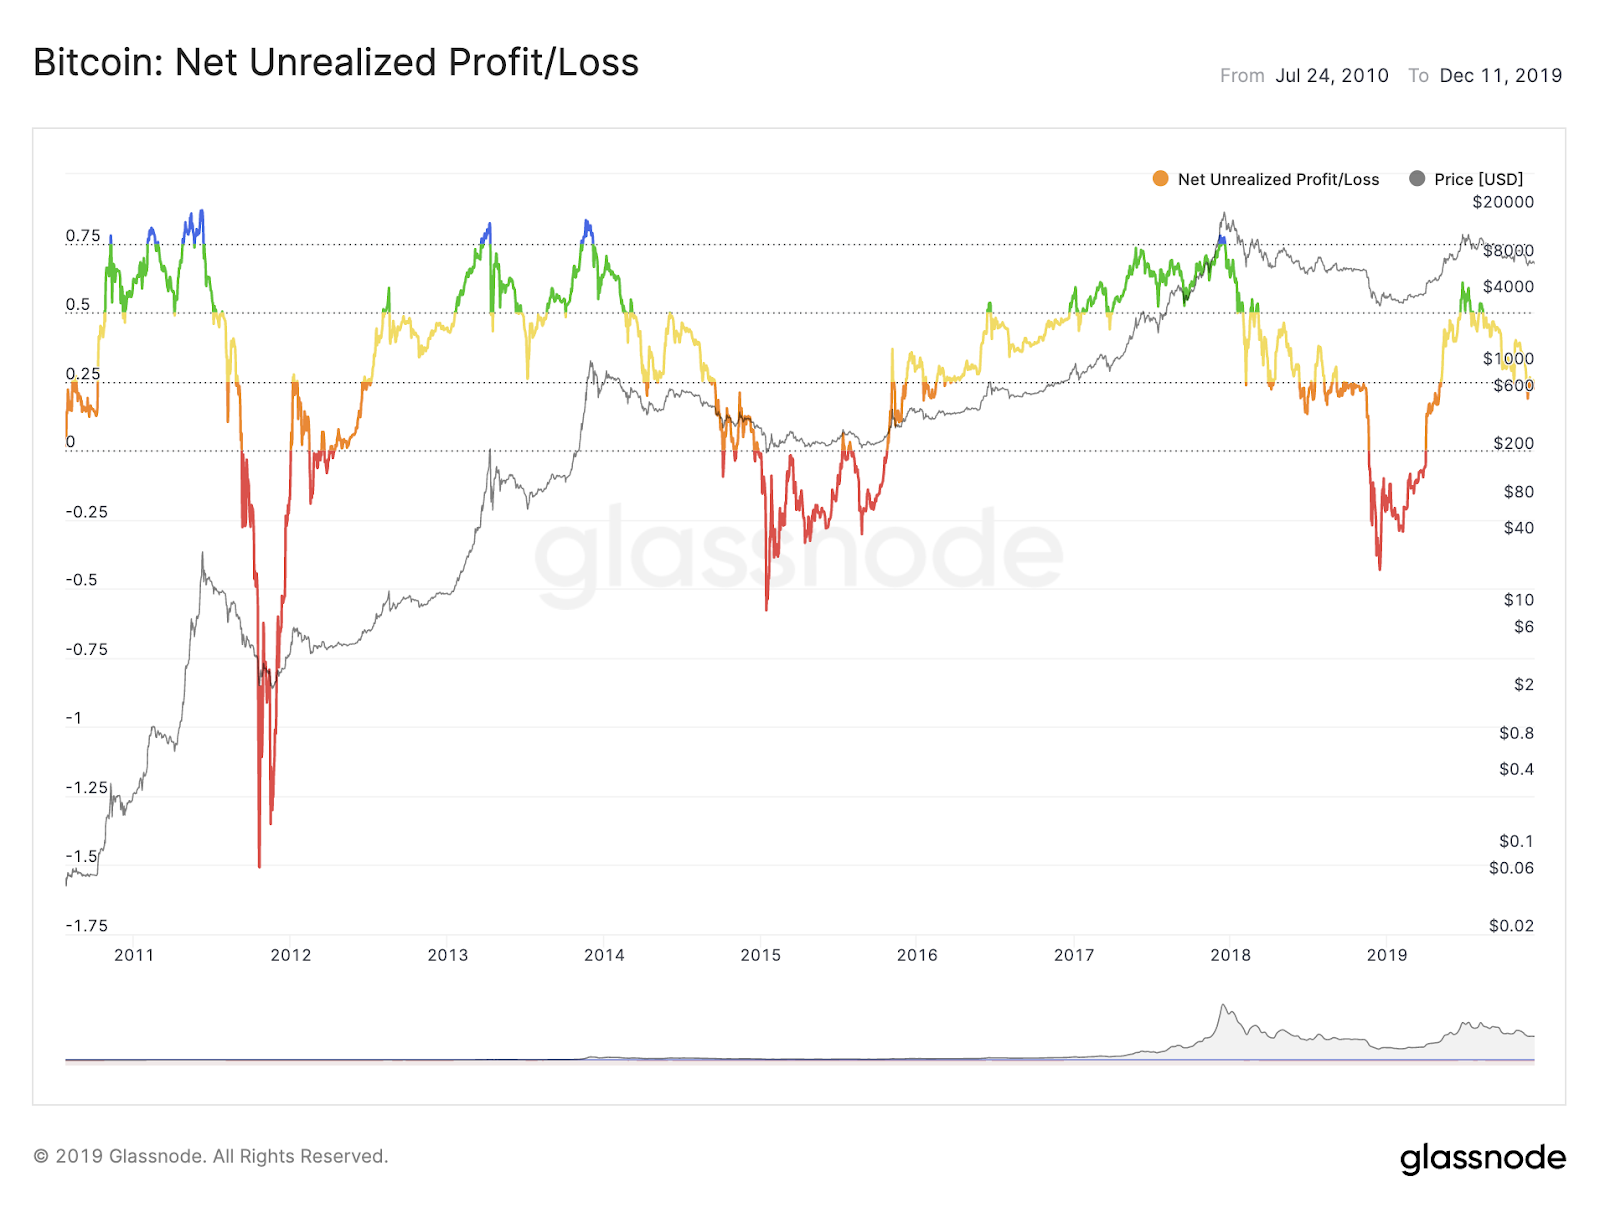
- Understanding NUPL: When the NUPL value is high, it indicates that most investors are profiting, often signifying a potential market peak. Conversely, low NUPL values suggest that more investors are experiencing losses or that the market is undervalued, possibly indicating an opportune time to buy.
- NUPL and Bitcoin Halving: As the halving approaches, keen observation of the NUPL can provide insights into how holders are likely to react post-halving. For instance, a high NUPL leading into the halving might suggest that after the event, there could be profit-taking, leading to a price correction.
By understanding these trends, investors can make more informed decisions about when to buy or sell, leveraging market sentiment to anticipate shifts that often accompany the halving.
Network Value to Transactions Signal (NVT Signal)
The NVT Signal enriches an investor’s analytical toolset by measuring Bitcoin’s value relative to the volume of transactions on its network. This indicator can be likened to the stock market’s price-to-earnings ratio, offering a sense of whether Bitcoin is undervalued or overvalued at any given point.
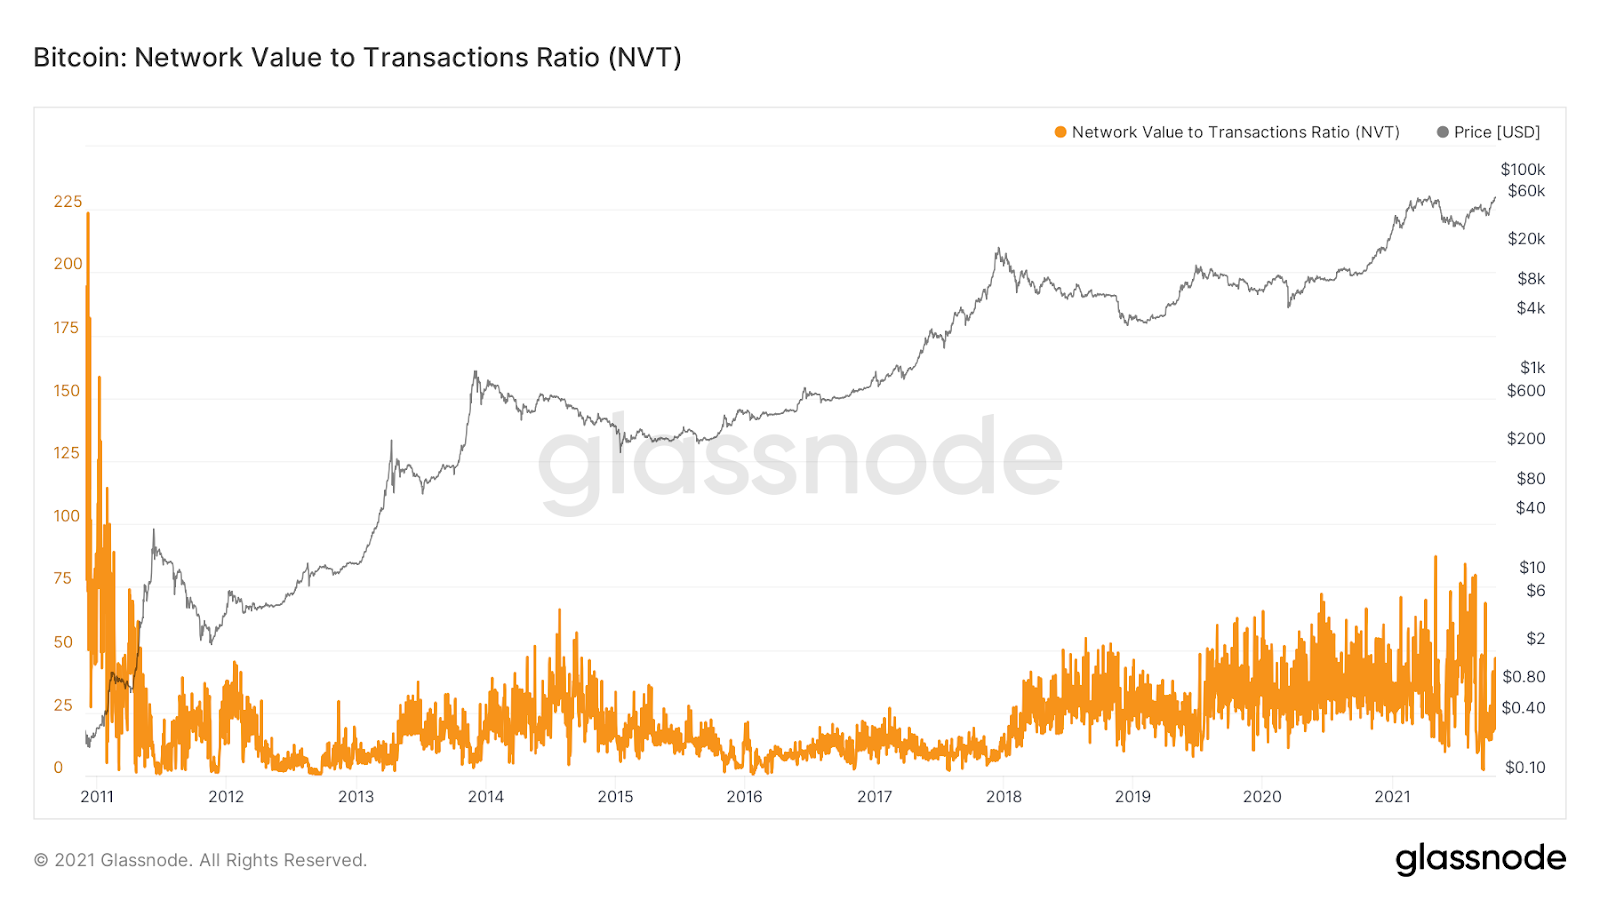
- Deciphering NVT Signal: A high NVT signal indicates that the network value is high relative to the number of transactions, potentially pointing to overvaluation and speculatively driven price actions. In contrast, a low NVT signal suggests increased transactional activity, justifying the network’s value, often a bullish indicator.
- The Halving Context: The halving event traditionally drives increased attention and speculative activity in Bitcoin. Monitoring the NVT signal around this time helps investors discern whether the price hikes are supported by genuine transactional adoption and usage or merely speculative interest.
For instance, if the NVT is exceptionally high during a halving period, it might imply that the market is driven by speculation and could potentially correct post-halving. Understanding this can guide strategic entry and exit points, allowing investors to navigate the halving with increased confidence.
More Essential Indicators
While NUPL and NVT Signal are critically valuable, they become even more powerful when used alongside other on-chain indicators. As the halving approaches, investors should also consider:
- MVRV (Market Value to Realized Value) Ratio: This indicator shows whether Bitcoin is over or undervalued by comparing its market cap to its realized cap. An elevated MVRV hints at a market peak, whereas a lower value suggests a bottom. Watching MVRV trends before and after halving can signal potential price reversal points.
- Stock-to-Flow (S2F) Model: Popular among cryptocurrency investors, the S2F model analyzes the scarcity of Bitcoin by comparing the total stock (circulating supply) to the flow (newly mined coins). Historically, Bitcoin’s price has followed the S2F ratio closely, and the halving event impacts this ratio directly by reducing the flow. This model can help investors understand the long-term price implications of Bitcoin’s diminishing supply.
- SOPR (Spent Output Profit Ratio): SOPR looks at the price sold versus the price paid for Bitcoin, reflecting overall market profit and loss. A SOPR above 1 indicates sellers are selling at a profit, while below 1 suggests they are selling at a loss. During the halving, a rising SOPR could indicate a strong market, as investors are holding onto their assets and waiting for higher profits.
Strategic Application of On-Chain Indicators
As the halving event approaches, the strategic application of these on-chain indicators becomes crucial. Here’s how investors can prepare:
- Monitor in Real-Time: On-chain metrics require real-time monitoring, as Bitcoin’s high market volatility means situations can change rapidly. Utilizing platforms and tools that provide live data is essential.
- Historical Analysis: By studying how these indicators behaved in relation to previous halving events, investors can better predict potential trends.
- Diversify Analysis: No single indicator offers a complete picture. Instead, using them in conjunction provides a more holistic view of market sentiments and possible trends.
- Stay Informed: The crypto market is influenced by more than just historical events and current trends. News, regulations, and technological advancements also play a significant role. Investors must stay abreast of wider industry developments.
Conclusion
The upcoming Bitcoin halving event in 2024 presents both opportunities and challenges for investors, and the key to navigating this tumultuous time lies in understanding and leveraging on-chain indicators. These indicators, like NUPL and NVT Signal, serve as financial compasses, offering insights into market sentiment, network health, and Bitcoin’s value relative to its transaction volume. Historical data shows that these metrics have played significant roles during previous halving events.
In simple terms, think of on-chain indicators as tools in an investor’s toolbox. Just as a carpenter wouldn’t rely solely on a hammer to build a house, investors shouldn’t rely on just one indicator. By monitoring these metrics in real-time, considering their historical behavior, diversifying their analytical approach, and staying informed on broader market dynamics, investors stand a better chance of capitalizing on the halving event. As the old saying goes, “Knowledge is power,” and in the ever-evolving world of Bitcoin, that knowledge is rooted deeply in on-chain indicators.
FAQs
What is the significance of the NUPL indicator for Bitcoin investors ahead of the halving event?
NUPL, or Net Unrealized Profit/Loss, tracks the proportion of coins in the network that are in profit versus those at a loss. High NUPL values can signal that the market is overheated, with many investors in profit and potentially looking to sell. Conversely, low values suggest the opposite. Ahead of the halving, if NUPL is exceptionally high, it might indicate a looming sell-off as investors look to cash in on profits.
How does the NVT Signal help in understanding Bitcoin's market value?
NVT Signal, or Network Value to Transactions Signal, assesses Bitcoin's valuation based on the amount of value being transmitted over the network relative to the asset's valuation. A high NVT Signal suggests that Bitcoin’s price is not supported by corresponding on-chain transactional activity, indicating overvaluation and potential correction. Observing this ratio can help predict speculative bubbles or periods of undervaluation.
Why is monitoring miner activity important, especially around the halving event?
Miner activity, including hash rate and miner outflows, reflects network health and potential market pressure. A consistent or rising hash rate suggests network stability. However, significant increases in miner outflows (Bitcoins being moved from miner wallets to exchanges) may signal an intent to sell, potentially forecasting a downward price trend, especially critical when the block reward is about to halve, affecting miner revenue.
Can the MVRV Ratio signal a market top or bottom for Bitcoin?
Yes, the MVRV (Market Value to Realized Value) Ratio compares the market cap of Bitcoin (a perception-driven metric) with the realized cap (based on when coins were last moved), providing insight into market peaks or bottoms. A high MVRV ratio indicates most holders are in profit, potentially a market top, while a low ratio suggests undervaluation, often a good buying opportunity.
How does the Stock-to-Flow (S2F) model relate to the halving event?
The Stock-to-Flow model is crucial around the halving as it measures Bitcoin's scarcity by comparing the total supply with new production. The halving event cuts the flow (newly mined Bitcoins) in half, affecting the S2F ratio. Historically, a higher S2F ratio (increased scarcity) post-halving has been associated with a bullish market cycle for Bitcoin, highlighting the potential for price increases in line with reduced supply.
Disclaimer. The information provided is not trading advice. Cryptopolitan.com holds no liability for any investments made based on the information provided on this page. We strongly recommend independent research and/or consultation with a qualified professional before making any investment decisions.

Shayan Chowdhury
Shayan is a professional crypto journalist specializing in cryptographic modules and blockchain development. He was a news reporter at CoinPedia and a news editor (intern) at Binance. He has been a crypto price prediction editor at Cryptopolitan since October 2022. Shayan went to Bidhannagar Government College where he gained a BSc in Mathematics.


CRASH COURSE
- Which cryptocurrencies can make you money
- How to boost your security with a wallet (and which ones are actually worth using)
- Little-known investment strategies that the pros use
- How to get started investing in crypto (which exchanges to use, the best crypto to buy etc)