Binance Coin price analysis shows a bearish trend in place, after price dropped down to $308 yesterday from previous level at $326. After the 5 percent decline, BNB price settled at the $308 mark over the past 24 hours, with the support level sitting at $304. BNB price has largely been supported at the $324 mark over the current month. However, yesterday’s decline indicated that buying had exhausted over the previous trend that caused price to decline. Binance Coin continues to occupy the 4th rank in the crypto market, with a market cap of $48,721,023,732.
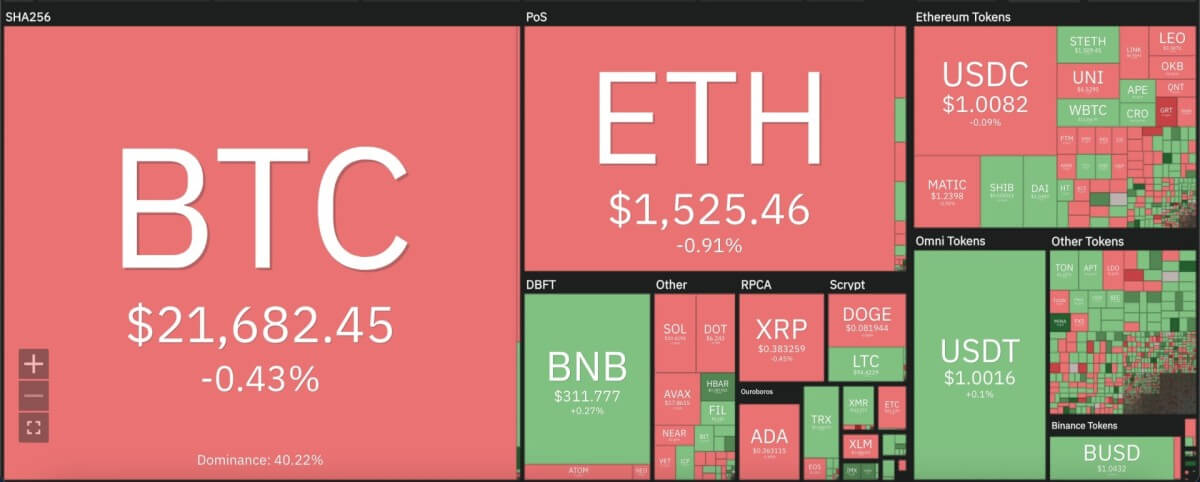
The larger cryptocurrency market continued to stay in the red zone after yesterday’s downtrends, with Bitcoin and Ethereum both recording minor dips at $21,600 and $1,500, respectively. Among leading Altcoins, Ripple stayed at $0.38, whereas Dogecoin dropped to $0.81 and Cardano to $0.36, both recording a 1 percent drop. Polkadot also continued its bearish trend, dropping 1 percent to $6.24.

Binance Coin price analysis: 24-hour RSI drops as price turns bearish
On the 24-hour candlestick chart for Binance Coin price analysis, price can be seen forming an evening star pattern to change trends over yesterday’s price action. Although price stemmed the drop over today’s trade, majority technical indicators show that the bearish trend is set in place. Price moved and remained below the 9 and 21-day moving averages, along with the crucial 50-day exponential moving average (EMA) at $315.3.

The 24-hour relative strength index (RSI) can be seen dropping severely since yesterday’s 5 percent drop and is now headed into the oversold zone. The RSI is expected to drop further below the current level at 49.70, before price can consolidate the next uptrend. Meanwhile, the moving average convergence divergence (MACD) curve also shows a bearish divergence in place, whereas the 38% drop in trading volume over the past 24 hours also indicates a bearish sight for price action.
Disclaimer. The information provided is not trading advice. Cryptopolitan.com holds no liability for any investments made based on the information provided on this page. We strongly recommend independent research and/or consultation with a qualified professional before making any investment decisions.


