

Best crypto insights delivered straight to your inbox.

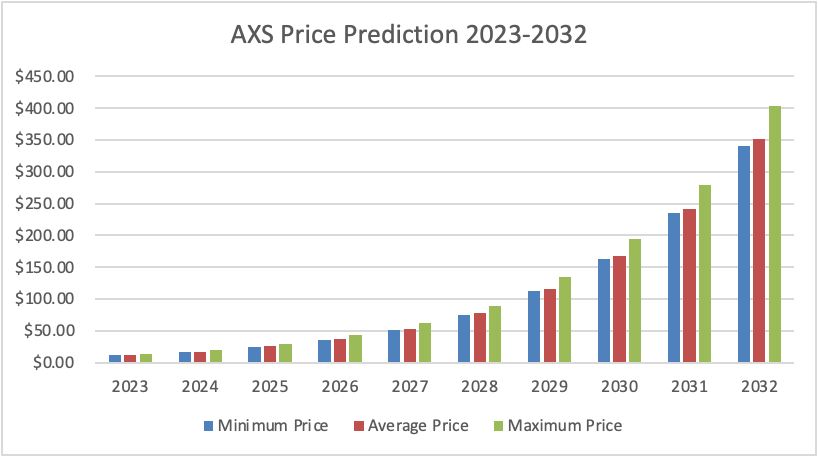
Axie Infinity Price Prediction 2023 – 2032
- Axie Infinity Price Prediction 2023 -up to $13.71
- Axie Infinity Price Prediction 2026 -up to $43.41
- Axie Infinity Price Prediction 2029 -up to $134.84
- Axie Infinity Price Prediction 2032 -up to $402.94
Now we realize the power of $HODL, and it is community. If you believe AXS is a stable and trustworthy token, you won’t be swayed/persuaded by everything else that goes on like a whirlpool outside your house, right? How did the current crypto exchange chaos affect Axie Infinity Price Prediction? Trust is the key and we will see that through the price movements of AXS in 2023.
Despite the bearish sentiment and limited demand for AXS, the network kept building, as shown by the uptick in development activity. Such a massive hike could boost the token’s value in the long run. However, prevailing macroeconomic headwinds could undermine a strong rebound, especially if BTC breaks below $22K. Can shorting yield gains?
As the Metaverse, blockchain gaming, and NFTs rise as emergent industries spanning from decentralization, Axie Infinity takes root as one of the most adopted blockchains for governance, gameplay, and Non-fungible tokens. In this Axie Infinity price prediction, we will look at how the token shaped the industry in 2022 and use the data in our future price predictions, starting with the brand-new 2023.
Blockchain has evolved rapidly over the years and is now finding a solid footing across various facets of software development. From the development of smart contracts to DApps, DeFi software, DAOs, NFTs, and now Metaverse, the technology has continued to disrupt several industries while also gaining more use cases.
One of the growing trends in crypto is blockchain gaming, and Axie Infinity is worthy of mention. Let’s learn more about the Axie Infinity project, Axie Infinity price, its features, gameplay, governance token, and price analysis.
How much is AXS worth?
Today’s Axie Infinity price is $8.02 with a 24-hour trading volume of $62,050,627. Axie Infinity is down 6.09% in the last 24 hours. The current CoinMarketCap ranking is #51, with a live market cap of $913,326,798 USD. It has a circulating supply of 113,918,073 AXS coins and a max. supply of 270,000,000 AXS coins.
Also, Read:
What is Axie Infinity?
Axie Infinity is a widely known blockchain-based game built on top of the Ethereum network. The game was created by Trung Nguyen, the current CEO of Sky Mavis, a gaming studio based in Vietnam. The idea behind the creation of Axie Infinity is to showcase the potential of blockchain technology in an educational and fun way while also offering economic opportunities. It has executed this successfully by becoming a prominent cryptocurrency ramp to the blockchain technology space.
Its development was inspired by the viral success of the Pokemon and Tamagotchi video game series. Furthermore, it features versatile, enjoyable, and open-ended gameplay that rewards players with various virtual token-related creatures, otherwise called Axies. These creatures can be traded, raised, or battled in real-time throughout the accrescent Axie Infinity ecosystem. Axies are NFTs (represented by ERC 721 tokens) with differing strengths and attributes, and they can be used to earn experience points in 3v3 battles.
Axies are available in four (4) rarity scales: common, rare, ultra-rare, and legendary. They can evolve or level up stats with experience points gained in battles.
Also, Axies can be bred together to create unique and new offerings traded or used in the Axie ecosystem. Axie Infinity utilizes a play-to-earn model that allows players to receive crypto rewards for playing games on the network.
Axie Infinity Price Overview
Axie Infinity Governance Token
The native crypto of the Axie Infinity universe is AXS (Axie Infinity Shard) – an ERC-20 token – and it is used for governance, staking, and payment.
Staking
Players in the Axie universe can stake their tokens to earn newly generated AXS. In addition, stakers are required to play and vote to earn rewards.
Payment
AXS crypto is utilized as the official currency of the Axie ecosystem or NFT Marketplace. Furthermore, it may be used as an eligibility criterion or tender for participation in auctions and sales carried out by the Axie team.
Governance and Axie Infinity shards
The ecosystem’s treasury launched in early 2021, and it began receiving revenues generated within the network and particular portions of rewards from staking. Since the design of Axie Infinity supports the transition to entirely decentralized governance, some of the developmental decisions on the network are taken by AXS stakers. As soon as the network becomes sufficiently decentralized by October 2023, Axie Infinity is expected to transition to a fully community-owned decentralized organization.
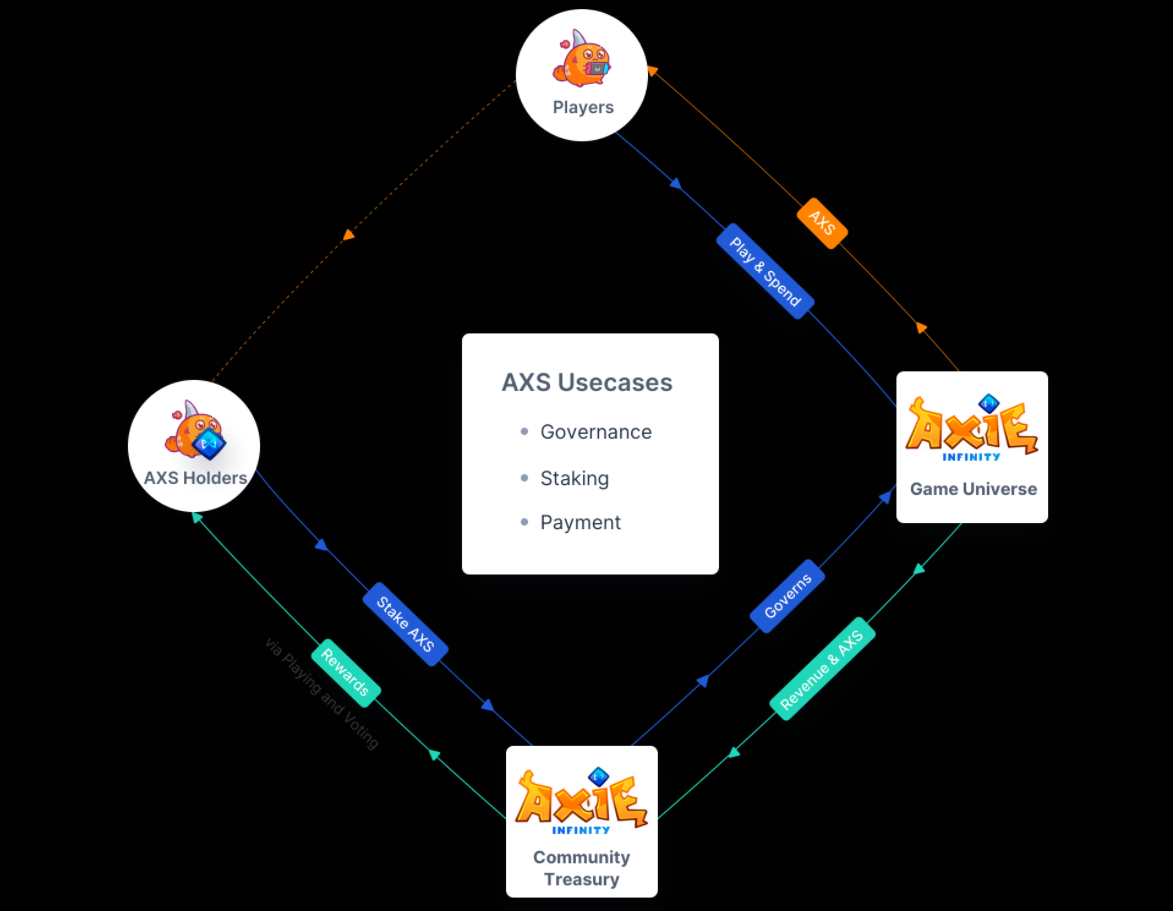
Axie Infinity price prediction Source: Axie Whitepaper
AXS was developed to align the rewards/incentives between developers and game players in an exciting way. The mechanism in the diagram above describes the goal to attain simultaneous incentivization of a token holder(s) or players for interacting with the Axie universe. Also, it depicts the decentralization of the network’s governance and ownership.
The other token on the network is the SLP or Small Love Portions, an in-game token utilized in the nurturing of Axies.
How Axie Infinity ecosystem works
The core of Axie Infinity’s gameplay is focused on breeding (nurturing) and battling Axies on the Axie Infinity shards – the token-based creatures integral to the ecosystem’s experience. Typically, Axies are differentiable by two features, class and body parts. These features can help determine their rarity level and distinguish them from one another. In addition, each Axie is characterized by four (4) stats, namely Speed, Morale, Health, and Skill, which are all integral to the gameplay mechanics. These stats decide the damage tolerance of each Axie, its attack potency, etc.
Axies are available in three (3) secret categories, Mech, Dawn, or Dusk, and six (6) regular classes, Reptile, Aquatic, Plant, Beast, Bug, or Bird. Each class is characterized by its weaknesses and strengths, which indicate how they match up against other classes. By the rules of the Axie Universe, Aquatics have a strength advantage over the Mech, Beast, and Bug classes but are weak compared to Dusk, Reptile, and Plant Axies. Additionally, Axies have six (6) body parts: eyes, tail, back, mouth, ears, and horns. Except for the ears and eyes, other parts have distinct abilities influencing their battle capacities.
Axie Infinity can be played in Adventure mode or Arena mode. Players can earn SLP or AXS in either game mode. The game also allows you to battle built-in non-player combatants known as Chimera to earn rare treasures and additional tokens to upgrade your characters. Like in the real world, gamers can create new and unique offspring creatures with unique capabilities and features. Breeding or nurturing can take place up to seven (7) times; each time it occurs, more AXS and SLP are required. Usually, Axie offspring will undergo development for five (5) days and become battle-ready afterward. They can also be sold in the Marketplace or continue breeding.
The Axie ecosystem not only allows players to trade and collect creatures; it also affords them tokenized virtual lands, known as Lunacias, that will serve as a habitat for their Axies. In the future, third-party developers can leverage the Lunacia SDK to create exclusive games.
The Axie Marketplace
The Axie Infinity marketplace is the best place to access Axies put up for sale or recent sales history. Players can engage the filter feature to optimize the search query when looking for Axies that suit their desired price, stats, body parts, class, etc. Axies can be bought via a Ronin Wallet by first funding it with ETH.
Now that we have provided you with detailed information about Axie Infinity, will AXS be profitable in 2023 and beyond? Let’s get into its past price analysis, current market status, and price forecasts.
Axie Infinity Price History
According to data obtained from Coinmarketcap, AXS began trading at a market price of $0.1798 and soon hit its all-time low at $0.1234 by November 6, 2020. By January 27, 2021, the coin attained the $1 mark for the first time, and by February 13, 2021, it had already experienced a price gain of over 90% and traded at a maximum market price of $2.07. By July 6, 2021, AXS reached a maximum price of $11.81, and it continued on a bullish trend until it attained its current all-time high of $165.37 on November 6, 2021.
The 90-day low of AXS is $48.25, and its highest price within this period is $165.37. The chart shows that the price momentum has been bullish over the past 90 days, with uptrends since the start of October 2021. Based on the last 30 days, Axie Infinity has had a bearish run. Its lowest price within this period is $49, and it has retested that level thrice within that duration.
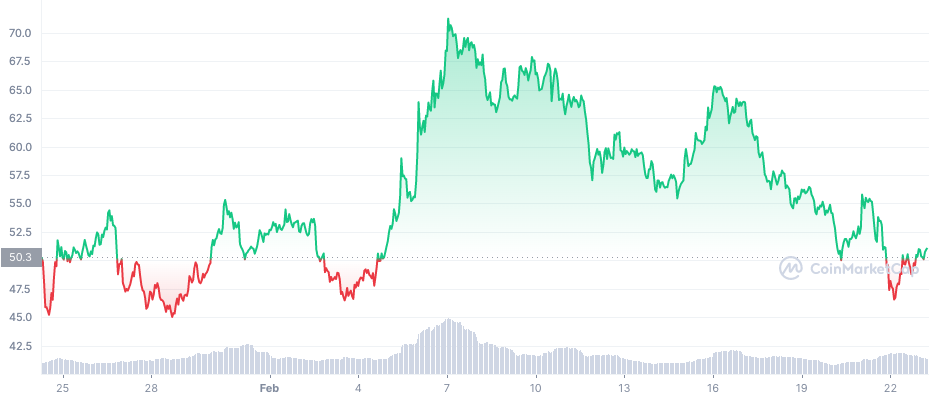
Over the past 7 days, AXS’s lowest price is $49, and its highest price is $65, as shown in the chart below. The chart shows that AXS has been on a bearish run in the past few days.

However, if bought at the earliest known market price, per Coinmarketcap, the ROI on AXS is over 134,000%. The past price analysis of AXS is typical of a coin with long-term potential.
Axie Infinity Latest Developments
The blockchain-powered game Axie Infinity has been a very popular application during the last 12 months, as the game’s NFTs have outpaced every NFT collection today in terms of all-time sales. While Axie Infinity has seen $3.85 billion in all-time sales, according to a report on how Ronin, Axie Infinity’s sidechain, has seen exponential growth. In their first-ever Conference, Axiecon, Sky Mavis announced a series of new features and products for their famous play-to-earn game. These Include:
- Axie Infinity: Origin will be renamed a more distinct brand for “Origin” Axies.
- Upgrading, or Level 2 parts, will unlock vertical progression for Axies, where they can evolve to have more powerful parts accompanied by brand-new visuals. The gameplay will require using resources and materials obtained throughout the Axie Infinity universe.
- Sky Mavis also announced an ambitious multi-year project aimed at pushing the boundaries of Web3 games and being the gathering place for the Axie Infinity digital nation to play, socialize, and build. It will incorporate multiple gameplay genres like simulation, strategy, and role-playing and have metaverse elements for the community to socialize.
- Sky Marvis will launch Axie Infinity Ray lights, a mini-game that uses Land NFTs. Land NFTs will be like primitives in the Axie Infinity universe like Axies, which can be used across infinite experiences.
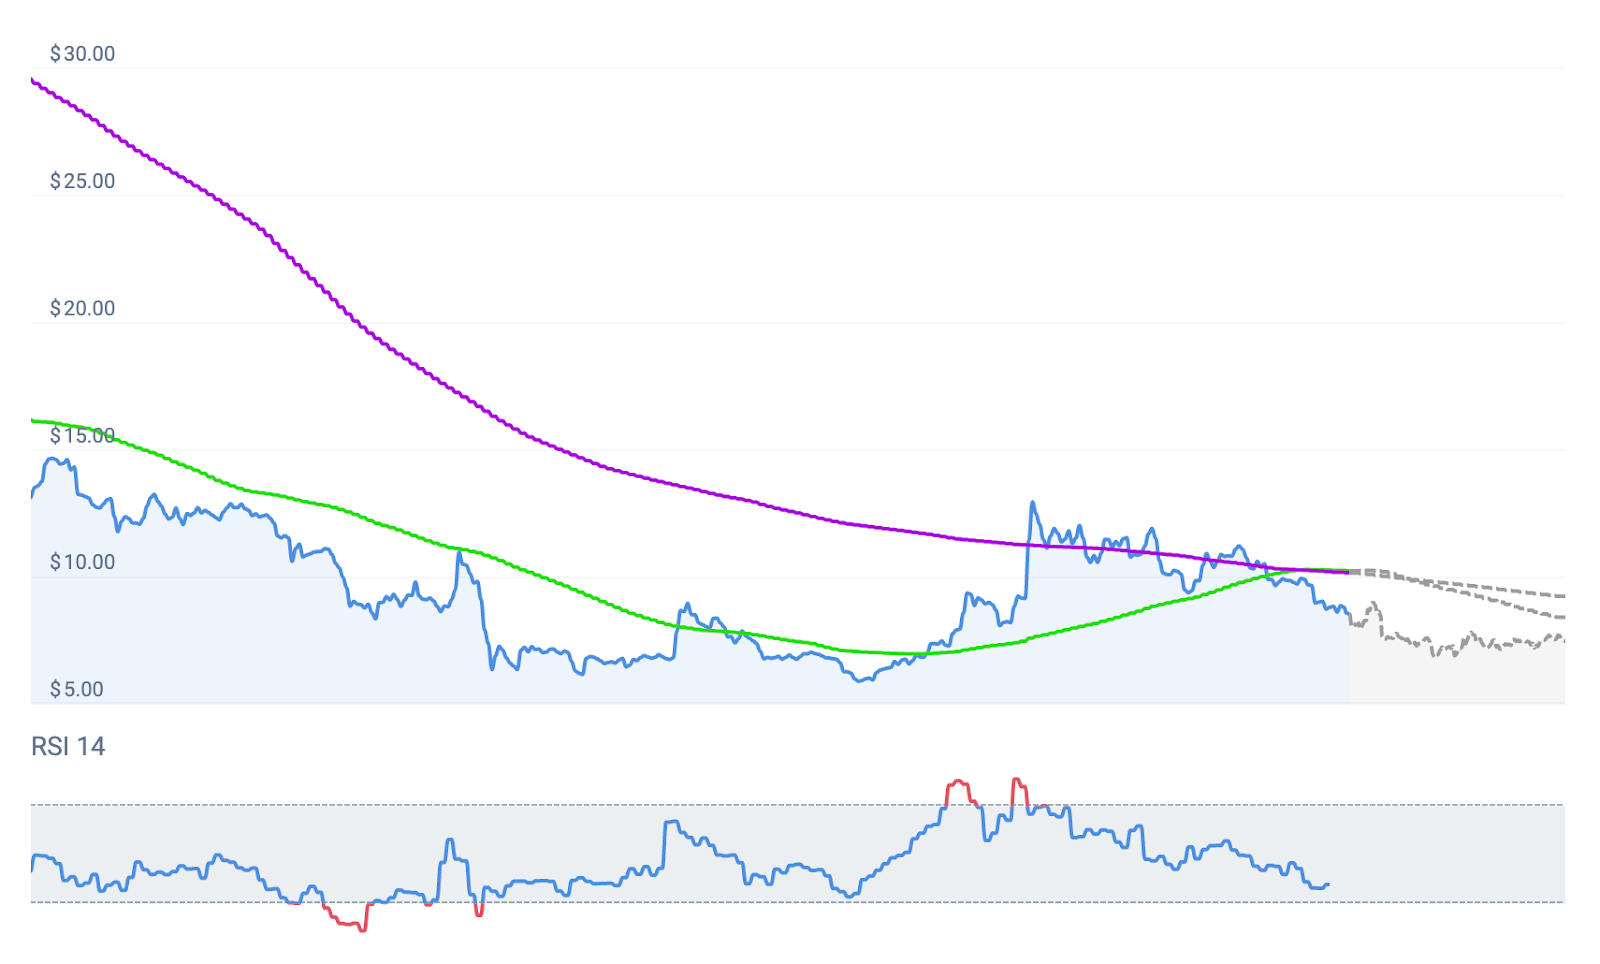
Axie Infinity Technical Analysis
The price of Axie Infinity is currently below the 200-day simple moving average (SMA). Since February 24, 2023, the 200-day SMA has been indicating SELL.
Axie Infinity’s price is currently below the 50-day simple moving average, and this indicator has been signaling SELL for the last 11 days since February 24, 2023. The most recent Bitcoin Death Cross occurred 410 days ago, on January 21, 2022. Meanwhile, a Golden Cross last occurred on Mar 01, 2023, which was 6 days ago.
According to our technical indicators, Axie Infinity’s 200-day SMA will fall in the coming month and reach $ 9.27 by April 6, 2023. The short-term 50-Day SMA for Axie Infinity is expected to reach $ 8.44 by April 6, 2023. The momentum oscillator Relative Strength Index (RSI) is a popular indicator that indicates whether a cryptocurrency is oversold (below 30) or overbought (above 70). The RSI value is currently 37.96, indicating that the AXS market is in a neutral state.
Axie Infinity Price Prediction Cryptopolitan
Axie Infinity Price Prediction 2023
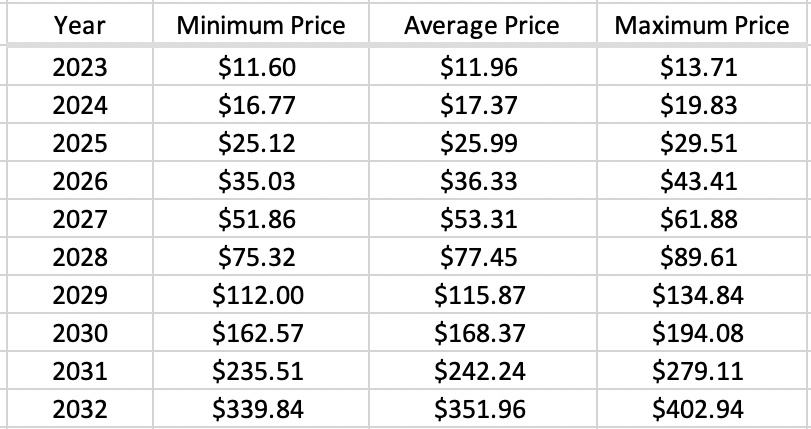
According to our in-depth technical analysis of AXS price history, the price of Axie Infinity is expected to reach a minimum price of $11.60 in 2023. With an average trading price of $11.96, the AXS price can reach a maximum of $13.71.
Axie Infinity Price Prediction 2024
The price of Axie Infinity is expected to be a minimum price of $16.77 in 2024. As per our findings, the AXS price could reach a maximum price of $19.83 with an average trading value of $17.37.
Axie Infinity Price Prediction 2025
In 2025, the price of Axie Infinity is expected to be a minimum price of $25.12. The Axie Infinity price could reach a maximum price of $29.51 with an average trading price of $25.99 throughout 2025.
Axie Infinity Price Prediction 2026
The price of 1 Axie Infinity is expected to reach a minimum price of $35.03 in 2026. Throughout 2026, the AXS price can reach a maximum price of $43.41, with an average price of $36.33.
Axie Infinity Price Prediction 2027
In 2027, the price of Axie Infinity is expected to be a minimum price of $51.86. Throughout 2027, the Axie Infinity price could reach a maximum price of $61.88, with an average trading price of $53.31.
Axie Infinity Price Prediction 2028
The price of Axie Infinity is expected to reach a minimum price of $75.32 in 2028. According to our findings, the AXS price could reach a maximum price of $89.61, with an average forecast price of $77.45.
Axie Infinity Price Prediction 2029
According to our in-depth technical analysis of AXS price history, the price of Axie Infinity in 2029 is expected to be around $112.00. The Axie Infinity price can reach a maximum price of $134.84 in USD, with an average trading value of $115.87.
Axie Infinity Price Prediction 2030
In 2030, the price of Axie Infinity is expected to be a minimum price of $162.57. Throughout 2030, the Axie Infinity price can reach a maximum price of $194.08 and a low of $168.37.
Axie Infinity Price Prediction 2031
According to the forecast and technical analysis, the price of Axie Infinity is expected to reach a minimum price of $235.51 in 2031. The AXS price can reach a maximum price of $279.11, with an average price of $242.24.
Axie Infinity Price Prediction 2032
According to the forecast price and technical analysis, the price of Axie Infinity in 2032 is expected to be a minimum price of $339.84. The AXS price can reach a maximum price of $402.94, with an average trading price of $351.96.
Axie Infinity Price Prediction by Coincodex
According to Coincodex’s current Axie Infinity price prediction, the value of Axie Infinity is expected to fall by -12.03% and reach $7.59 by March 12, 2023. According to Coincodex technical indicators, the current sentiment is bearish, with the Fear & Greed Index reading 49(Neutral). Axie Infinity had 12/30 (40%) green days with 7.42% price volatility over the last 30 days. According to Coincodex’s Axie Infinity forecast, now is not a good time to buy Axie Infinity.
Comparing Axie Infinity to other significant technological innovations and trends can help predict where the Axie Infinity price will go in the long run. In the best-case scenario, AXS’s price prediction for 2026 is $428.84 if it follows Facebook’s growth. If Axie Infinity follows Internet growth, the prediction for 2026 is $ 49.20.
Axie Infinity Price Prediction by Wallet Investor
It appears like Axie Infinity (AXS) and its market environment has been in a bearish cycle for the past twelve months, based on the most recent available data. Artificial intelligence (AI) cryptocurrency analyst predicts a downward trend in the market and says that AXS are not a suitable financial investment. The long-term prospects for this cryptocurrency are poor, so you should diversify your holdings by investing in other projects. Keep away from this currency if you are not a seasoned trader, as trading during bad markets is always more challenging. If you’re a novice investor, it’s important that you educate yourself on best practices.
Axie Infinity Price Prediction by DigitalCoinPrice
Axie Infinity reached $13.38 in the first week of January 2023 before falling below $5.96 for the first time since January 2021. Axie Infinity 2026 Price Prediction is likely to double in price, but it is also possible that it will not reach its expected maximum of $39.44. The Axie Infinity Price Prediction and technical analysis predict that the price of Axie Infinity will reach $61.51 by the beginning of 2029, and the price of AXS will reach $61.51 by the end of the year. Axie Infinity will attempt to reach the lowest level of $160.73 in 2032. With an average forecast price of $166.21, it may try to get the maximum and next top tier of $167.01.
Axie Infinity Price Prediction by Coincodex
According to Coincodex’s current Axie Infinity price projection, the value of Axie Infinity is expected to rise by 0.93% by January 3, 2023, reaching $ 6.26. Technical indicators reveal that the current sentiment is bearish, with the Fear & Greed Index reading 28(Fear). Over the last 30 days, Axie Infinity has 13/30 (43%) green days and 8.81% price volatility. According to our Axie Infinity forecast, now is not the time to acquire Axie Infinity.
Comparing Axie Infinity to other significant technological advancements and trends is one method of projecting where the Axie Infinity price may go in the long run. In the best-case scenario, AXS’s price projection for 2025 is $ 193.32, assuming it grows at the same rate as Facebook. If Axie Infinity follows Internet growth, the forecast for 2025 is $ 38.11.
Axie Infinity Price Prediction by Industry Influencers
Star Trading Friend Youtube channel’s latest update on Axie Infinity suggests that the coin has upside potential if it breaks above support and breaks out upwards. The presenter suggests it will likely pump to $6.29. He advises placing your stop loss at $5.41. Future price targets are $9.0, $15.0, and $20.0. comments that investors should be on the lookout for a break out on the daily chart. AXS has traded sideways for a while now consolidating before its next major breakout.
Moon333 Youtube channel’s latest update on Axie infinity suggests that the coin has potential despite its massive loss of value. The presenter follows the Axie infinity performance from March, highlighting the double bottom formation on the weekly chart. The chart shows the long-term downward trend with intense resistance levels. AXS broke resistance in July but has since corrected it.
The daily chart expounds on the long-time resistance, which, when broken, AXS could potentially cross the $20 mark and further to $160 in the most bullish scenario.
Conclusion
Axie Infinity has proven to be a popular digital collectible game with a bright future. The game rode the hype of play to earn games and was able to amass millions of users. The platform provided income opportunities to many players setting the pace for Play to earn and NFT games. Axie Infinity has a lively community despite hemorrhaging players after the Ronin hack. Axie Infinity has a strong community and constantly expands its features and content.
Axie Infinity platform drives NFT adoption by providing its gaming community with real-world valuable crypto and mainstream-friendly access to crypto and web3 services, thus, continuing to draw more players who use the platform to seek opportunities its ecosystem presents, including Defi, the crypto market, and NFTs.
AXS has however lost more of its value despite premiering the GameFi market. The roughly four-year-old GameFi market, a sector of the cryptocurrency economy, might prove to be a dud for investors if their developers do not innovate to prevent the loss of players.
You can buy Axie Infinity on top-tier crypto markets like Binance, Coinbase, and Kraken. Always conduct your research before purchasing Axie Infinity coins.
The value of Axie Infinity is projected to rise further as scarcity encourages price increases. Please keep in mind that any investment involves some risk. Simply invest in what you can accomplish before drawing any conclusions and conducting as much research as possible.
FAQs
Where to trade Axie Infinity (AXS)?
AXS is listed on several exchanges, including major crypto exchanges, with various trading pairs, including AXS/USDT, AXS/USDC, AXS/BNB. AXS/BUSD, AXS/BTC, AXS/EUR, AXS/ETH, AXS/USD, and so on.
Is Axie Infinity legit?
Axie Infinity is one of several legitimate play-to-earn games that gained popularity in pandemic-stricken 2021. With around 2.8 million active players, it is firmly positioned to become part of a growing metaverse trend in 2023. However, it is crucial to keep in mind that market trends can always change. Always do your research on every project.
How to invest in AXS?
You can buy AXS through different crypto exchanges, including Kraken and Katana. It can also be earned as a reward when playing the Axie Infinity game and staking the tokens. Remember, though, that cryptocurrencies are highly volatile, and the price can always fall – so never invest more than you can afford to lose.
Can you earn AXS by playing?
Players can earn AXS coins by playing various games in the Axie Infinity metaverse and participating in user-generated content projects. AXS coin holders will also be eligible for incentives if they stake their tokens, play the game, and vote on crucial governance issues.
Disclaimer. The information provided is not trading advice. Cryptopolitan.com holds no liability for any investments made based on the information provided on this page. We strongly recommend independent research and/or consultation with a qualified professional before making any investment decisions.

Alden Baldwin
Journalist, Writer, Editor, Researcher, and Strategic Media Manager: With over 10 years of experience in the digital, print and public relations industries, he has been working with the mantra, Creativity, Quality and Punctuality. In his waning years promises to build a a self sustaining institute that provides free education. He is working towards funding his own startup. As a technical and language editor, he has worked with multiple top cryptocurrency publications such as DailyCoin, Inside Bitcoins, Urbanlink Magazine, Crypto Unit News and several others. He has edited over 50,000+ articles, journals, scripts, copies, sales campaign headlines, biographies, newsletters, cover letters, product descriptions, landing pages, business plans, SOPs, e-books, and several other kinds of content.


CRASH COURSE
- Which cryptocurrencies can make you money
- How to boost your security with a wallet (and which ones are actually worth using)
- Little-known investment strategies that the pros use
- How to get started investing in crypto (which exchanges to use, the best crypto to buy etc)