


Key takeaways
- In 2026, Polkadot might reach a maximum price value of $2.01 and an average value of $1.53.
- In 2029, the DOT price is expected to range from a maximum of $6.32 to a minimum of $5.16.
- The price of Polkadot is predicted to reach a maximum value of $18.44 in 2032.
Polkadot (DOT) is a next-generation blockchain network designed to connect and secure multiple blockchains, enabling them to share data and operate together seamlessly.
Created by Ethereum co-founder Gavin Wood, Polkadot aims to solve key issues such as scalability, interoperability, and security through its unique multi-chain architecture.
The network’s central relay chain coordinates specialized blockchains known as parachains, allowing transactions to be processed in parallel for greater efficiency.
DOT, the native token, is used for network governance, staking to secure the ecosystem, and bonding to add new parachains, making it a core component of Polkadot’s growing Web3 infrastructure.
Will DOT reach new heights soon? Let’s get into the Polkadot price prediction for 2026-2032.
Overview
| Cryptocurrency | Polkadot |
| Token | DOT |
| Price | $0.8328 |
| Market Cap | $1.41B |
| Trading Volume | $71.47M |
| Circulating Supply | 1.693B DOT |
| All-time High | $55.00 Nov 4, 2021 |
| All-time Low | $1.15 Feb 06, 2026 |
| 24-hour High | $0.8574 |
| 24-hour Low | $0.8252 |
Polkadot price prediction: Technical analysis
| Volatility | 7.20% (High) |
| 50-Day SMA | $0.9724 |
| 14-Day RSI | 40.75 (Neutral) |
| Market Sentiment | Bearish |
| Fear & Greed Index | 28 (Fear) |
| Green Days | 13/30 (43%) |
| 200-Day SMA | $1.38 |
Polkadot price analysis
- The daily trend remains weak, with DOT trading below the 20-day SMA despite a still-positive MACD.
- The 4-hour chart has turned bearish, with RSI below 40 and price below all Alligator averages.
- Watch $0.80 as key support and $0.85-$0.86 as the first resistance needed to improve the outlook.
Polkadot daily price chart
On the daily chart for July 13, DOT is trading around $0.834, down 1.18% on the session and slipping below the 20-day SMA at $0.849, reinforcing the broader bearish structure. Price has failed to sustain last week’s rebound toward $0.89, falling roughly 6% from that local high.

Although the price action has softened, the MACD remains in bullish territory, with the MACD line still above the signal line and the histogram positive, suggesting upside momentum has weakened but has not completely disappeared. The Bollinger Bands show price drifting toward the middle band, while support sits near $0.80. A recovery above $0.85 could reopen the path toward $0.89-$0.90, whereas losing $0.80 would strengthen the bearish outlook.
Polkadot 4-hour price chart
The 4-hour chart shows increasing selling pressure after DOT failed to hold above $0.88. Price now trades around $0.834, below all three Alligator averages ($0.854, $0.851 and $0.847), indicating bears have regained short-term control.

The RSI has fallen to 39.2, below the neutral 50 level and approaching oversold territory, reflecting weakening buying momentum rather than panic selling. Unless buyers reclaim $0.85, DOT is likely to remain range-bound with downside risk toward $0.82-$0.80. A move back above $0.86 would be the first indication that bullish momentum is returning.
Polkadot technical indicators: Levels and action
Daily simple moving average (SMA)
| Period | Value | Action |
|---|---|---|
| SMA 3 | $ 0.8611 | SELL |
| SMA 5 | $ 0.8474 | SELL |
| SMA 10 | $ 0.8626 | SELL |
| SMA 21 | $ 0.8573 | SELL |
| SMA 50 | $ 0.9724 | SELL |
| SMA 100 | $ 1.12 | SELL |
| SMA 200 | $ 1.38 | SELL |
Daily exponential moving average (EMA)
| Period | Value | Action |
|---|---|---|
| EMA 3 | $ 0.8524 | SELL |
| EMA 5 | $ 0.8534 | SELL |
| EMA 10 | $ 0.8562 | SELL |
| EMA 21 | $ 0.8768 | SELL |
| EMA 50 | $ 0.9669 | SELL |
| EMA 100 | $ 1.12 | SELL |
| EMA 200 | $ 1.50 | SELL |
What can you expect next for Polkadot (DOT)?
DOT remains bearish across both timeframes, although the daily MACD suggests the broader recovery attempt has not completely failed. Holding $0.80 is critical. A break above $0.85-$0.86 could revive bullish momentum, while losing support would likely expose another leg lower.
Is Polkadot a good investment?
Polkadot (DOT) shows cautious short-term price behavior, trading in a tight range between $1.25 and $1.30. For investors, this range-bound movement suggests monitoring price action carefully before committing, as the market is currently indecisive.
Long-term potential depends on Polkadot’s continued network development, adoption, and overall crypto market conditions. Traders seeking short-term gains should wait for a clear breakout above resistance or breakdown below support, while long-term investors may consider DOT’s technology and ecosystem growth as part of their evaluation.
Will Polkadot reach $10?
Yes, according to long-term predictions, Polkadot is projected to reach up to $10 by 2031.
Will Polkadot reach $15?
Yes, according to the long-term predictions, Polkadot is projected to reach up to $15 by 2040.
Will Polkadot reach $100?
Reaching $100 for Polkadot (DOT) is highly ambitious and unlikely in the near term.
Does Polkadot have a promising long-term future?
Based on Polkadot’s ongoing buying demand and positive community support, the DOT price is set to make new highs in the coming years. However, you are advised to do your research before investing in the volatile market, especially considering future performance.
Recent news/opinion on Polkadot
Polkadot has opened referenda #1909 and #1910 to overhaul staking economics, tighten validator requirements, and lower costs for nominators. The proposals introduce self-stake rewards and permissionless chilling for under-bonded validators, while also removing nominator slashing and cutting the unbonding period from about 28 days to roughly 48 hours.
Polkadot price prediction July 2026
For July, Polkadot is expected to trade between $0.70 and $ 1.01, with an average around $0.86.
| Month | Potential Low | Potential Average | Potential High |
| July 2026 | $0.70 | $0.86 | $1.01 |
Polkadot price prediction 2026
The DOT price prediction for 2026 anticipates a minimum value of $0.92 and a maximum value of $2.01. The token price and the coin’s average value could be around $1.53.
| Polkadot Price Prediction | Potential Low | Potential Average | Potential High |
| 2026 | $0.92 | $1.53 | $2.01 |
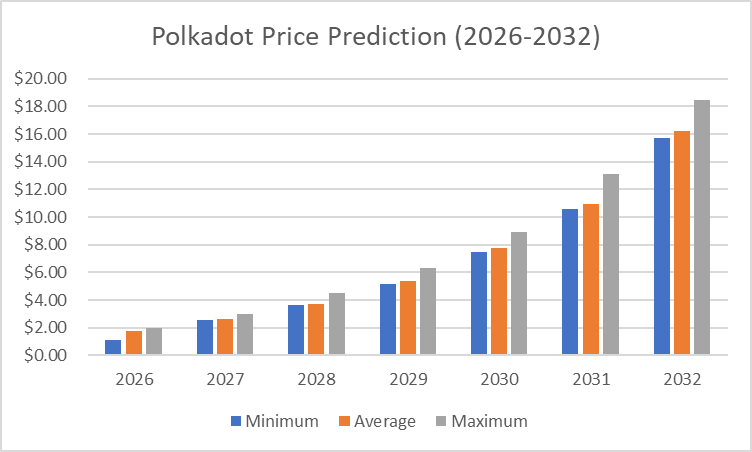
Polkadot Price Predictions 2027-2032
| Year | Minimum Price | Average Price | Maximum Price |
| 2027 | $2.56 | $2.63 | $3.01 |
| 2028 | $3.65 | $3.75 | $4.51 |
| 2029 | $5.16 | $5.35 | $6.32 |
| 2030 | $7.50 | $7.77 | $8.93 |
| 2031 | $10.57 | $10.96 | $13.13 |
| 2032 | $15.69 | $16.24 | $18.44 |
Polkadot price prediction 2027
According to the Polkadot prediction for 2027, DOT could reach a maximum price of $3.01, with the lowest price expected to be $2.56, and an average forecast price of $2.63.
Polkadot price prediction 2028
The price of Polkadot is predicted to reach a minimum value of $3.65 in 2028. Per expert analysis, DOT tokens could reach a maximum value of $4.51 and an average trading price of $3.75.
Polkadot price prediction 2029
In 2029, the Polkadot coin could reach a minimum price level of $5.16, a maximum price of $6.32, and an average trading price of $5.35.
Polkadot forecast 2030
The price of Polkadot is predicted to reach a minimum value of $7.50 in 2030. Traders can anticipate a maximum value of $8.93 while monitoring key support levels and an average trading price of $7.77.
Polkadot price prediction 2031
According to the Polkadot price prediction for 2031, DOT could reach a maximum price of $13.13, a minimum price of $10.57, and an average forecast price of $10.96.
Polkadot price prediction 2032
In 2032, Polkadot’s price is predicted to reach a minimum level of $15.69. Should positive market sentiment persist, DOT can attain a maximum cost of $18.44 and an average trading price of $16.24.
Polkadot market price prediction: Analysts’ DOT price forecast
| Firm | 2026 | 2027 |
| Priceprediction.net | $5.03 | $3.58 |
| Coincodex | $0.8522 | $0.8268 |
Cryptopolitan’s Polkadot (DOT) Price Prediction
For 2026, Polkadot is expected to trade between $0.7 and $1.31, with an average price near $1.01. Continued network growth and adoption could support gradual gains. By 2032, DOT could reach up to $10.44.
Polkadot historic price sentiment
- After spending most of late 2020 around $4–$5, Polkadot broke above its previous $7 high on December 29 and quickly reached $10.

- Polkadot saw rapid growth in 2021, rising from around $3 in January to an all-time high near $57.50 in May before dropping to about $10 in July and later recovering above $40 in November.
- In 2022, DOT entered a steep decline, falling from around $30 at the start of the year to below $10 by mid-year and stabilizing near $5 by year-end.
- Through 2023 and early 2024, DOT mostly consolidated between $5 and $7 before briefly recovering toward $10.40 in December 2024.
- In 2025, DOT weakened again, falling from a January high of $7.98 to around $4.30 in March, then drifting below $4 through April and May. By June, it dropped toward $3.30, briefly stabilized near $4.00-$4.30 from August to October, then fell to around $2.10 by late November and early December.
- In 2026, DOT remained under pressure, trading between $1.66 and $2.33 in January, $1.15 and $1.74 in February, $1.23 and $1.65 in March, and $1.22 to $1.27 in April. In May, DOT averaged approximately $1.24, based on CoinGecko historical data.
- In June, DOT extended its decline, trading between roughly $0.89 and $1.19. In July, it has remained under pressure, trading around $0.84-$0.93 so far, with the current price near $0.84.
FAQs
Where can Polkadot be traded?
Polkadot may be traded on BKEX, Digifinex, and WOO Network. Polkadot's market trading pairings include DOT/USD, DOT/CAD, DOT/EUR, DOT/PHP, DOT/INR, and DOT/IDR.
What is the Grandpa Consensus Mechanism?
Polkadot takes a different approach to consensus mechanisms. The platform introduces the market to a new consensus mechanism known as GRANDPA (GHOST-based Recursive Ancestor Deriving Prefix Agreement). This mechanism provides Polkadot with a more secure and resilient network. Specifically, it allows networks to pool security. The added protections are then aggregated and applied to all.
What is staking and what's the process?
You may learn more here about staking DOT: https://www.cryptopolitan.com/how-to-stake-polkadot/
Disclaimer. The information provided is not trading advice. Cryptopolitan.com holds no liability for any investments made based on the information provided on this page. We strongly recommend independent research and/or consultation with a qualified professional before making any investment decisions.

Micah Abiodun
Micah Abiodun makes good use of his Environmental Engineering and Management (MSc) at Tallinn University of Technology (TalTech) to polish content and price prediction news at Cryptopolitan. Now on his 7th year in the crypto media space, he covers major cryptos, altcoins, DeFi, stablecoins, macro trends, and emerging tech.


