


Best crypto insights delivered straight to your inbox.

Compound Price Prediction 2023-2031
- Compound Price Prediction 2023 – up to $59.88
- Compound Price Prediction 2025 – up to $123.52
- Compound Price Prediction 2028 – up to $401.12
- Compound Price Prediction 2031 – up to $1,193.47
- Compound Price Prediction 2023-up to $59.88
- Compound Price Prediction 2025-up to $123.52
- Compound Price Prediction 2028-up to $401.12
- Compound Price Prediction 2031-up to $1,193.47
Compound is an algorithmic, autonomous interest rate protocol built for developers, to unlock a universe of open financial applications. The network is managed by a decentralized community of COMP token-holders and their delegates, who propose and vote on upgrades to the protocol.
Observers of Compound see the critical factor behind Compound’s growth over the past 24 hours in January this year as the launch of a new DeFi cryptocurrency called YAM for the Yam protocol. Compound is a coin supported to “farm” the cryptocurrency; demand for the asset has picked up, increasing the ongoing price. A year ago, Compound proved its mettle when all the other cryptos fell.
How much money would you have today, if you had invested $5,000.00 in #Compound-usd-coin $CUSDC 3 years ago? Your investment today would have a value of $5,440.22 (8.80%).
Today’s Compound price is $32.91 with a 24-hour trading volume of $9,394,153. Compound is down 1.16% in the last 24 hours. The current CoinMarketCap ranking is #102, with a live market cap of $239,144,328. It has a circulating supply of 7,267,152 COMP coins and a max. supply of 10,000,000 COMP coins. Compound is 96.35% below the all-time high of $911.20.
Also Read:
- DeFi Token YAM fails after making $400 million in 90 minutes
- Yam protocol secures $400M investment within 24 hours of launch
- Bitcoin, Binance Coin, Compound, and Icon Daily Price Analyses – 9 June Morning Price Prediction
- Compound decentralized oracle ready to go live
- DeFi protocol Compound hits 1B USD in crypto loans
Overview
What is Compound?
Compound is a special decentralized finance (DeFi) protocol that is popularly known to pioneer yield farming. The protocol runs on the Ethereum network, and it essentially allows its users to borrow and lend money without any central entity or governance. The success of this project is a direct boost to the Ethereum token as well.
The DeFi protocol is governed by its native token, Compound coin, with the ticker name of COMP. Compound coin allows community members to make governance decisions about the protocol through a voting system. Voting rights are given to those who hold the Compound governance token.
Users of the platform can vote on several issues such as interest allocation, which coins to add to the platform, and many more. Therefore, it promotes transparency and trust, which is a vital aspect of any blockchain project.
Impressive Bull Run
Arguably, Compound Comp has had an impressive bull run since its launch in 2018. The Compound coin has increased significantly in price over the years. Essentially, the Compound protocol has witnessed significant growth margins due to the increase in activity within the network. The platform has attracted several investors, which, in turn, has led to enormous increases in its Total Value Locked (TVL).
TVL is the total value of assets locked within a particular protocol. In this case, the Compound platform’s TVL covers its Liquidity pool and collateral deposits available.
According to various compound forecasts, Compound price prediction indicates an excellent token to invest in due to its steady increase in price and powerful technology that is believed to withstand the test of time.
How Compound Works
The Compound project is a decentralized platform that runs on the Ethereum blockchain. The Compound coin governs it. The compound governance coin has appreciated over the years since its launch in 2018. As a DeFi protocol, Compound hosts lending pools to earn interest on various cryptocurrencies. These pools allow token holders to supply their tokens to others who borrow them at algorithmically set interest rates based on supply and demand.
The platform provides cryptocurrency holders with an opportunity to earn extra coins through yield farming. Its governance token, Compound, is used to pay for transaction fees within the Compound blockchain.
When Compound was launched, it aimed to create a platform for users to use their cryptocurrency coins that sit idle on exchanges. It offers an automated lending platform that allows users to take out loans against their collateral. At Compound, cTokens are issued as a token representation of the total amount of collateral deposit.
The Compound coin is a good investment that propels DeFi to the next level, assuring users of the project’s longevity. Comp tokens are expected to continue to rise in value despite the short bearish momentum that has clouded cryptocurrencies recently.
Compound Price History
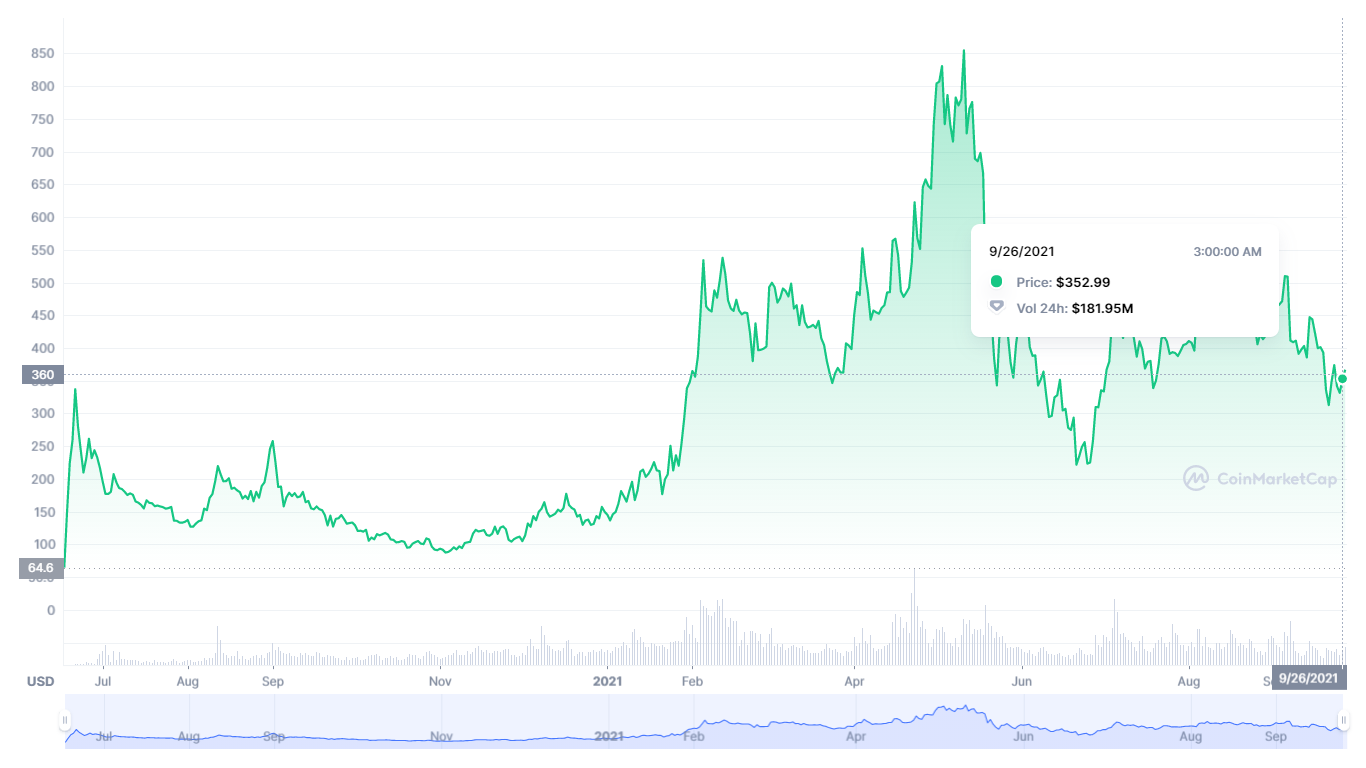
Courtesy: CoinMarket Cap
The price history of Compound tokens is exceptionally vital in determining the future price of Compound tokens. We try to establish a Compound coin forecast using advanced trend analysis combined with fundamental price action analysis.
The Compound price has been stable since its launch and has increased steadily. It has a total supply and maximum supply of 10,000,000 tokens with 5,708,902 tokens in circulation.
Compound comp price recorded its all-time low price on June 18th, 2020, when it traded at a daily price of $$61.32. Consequently, the asset price of Compound rose tremendously after that until May 12th, 2021, when it recorded an all-time high price of $$910.54.
Compound price analysis of the trend line indicates that Compound prices will continue to increase in value in the following years. According to some analysts, the price of Compound could easily surpass that of Ethereum in the future.
Based on the live Compound coin price, we establish its price forecast for the future years to determine if crypto enthusiasts should consider investing in it for both the short and long term.
Compound’s all-time high price was $179.77 on October 31st, 2019. Since then, the price has been on a steady decline, reaching its all-time low of $61.32 on March 13th, 2020. Prices have recovered since then and Compound is currently trading at $65.29.Consequently, the asset price of the Compound rose tremendously until May 12th, 2021, when it recorded an all-time high price of $$910.54.
In the long run, the COMP price has yet to break out of a substantial downward trend, and the flip may not be confirmed as a breakout.
Compound Technical Analysis
According to the recent Compound price analysis, a falling wedge pattern has formed on the weekly chart after hitting a monthly low of $31.41.Compound prices fell sharply from a peak of $40.2, and have since been trading within the wedge pattern. The price action suggests a possible bullish breakout to occur at any moment and could send prices toward new highs.
The compound cryptocurrency is trading at $33.21 and has declined by over 14 percent in the last 30 days. The monthly RSI is exhibiting a bearish scenario for the next few days. However, the bulls have been able to hold the $30 support level for the last 3 weeks, preventing any further declines.
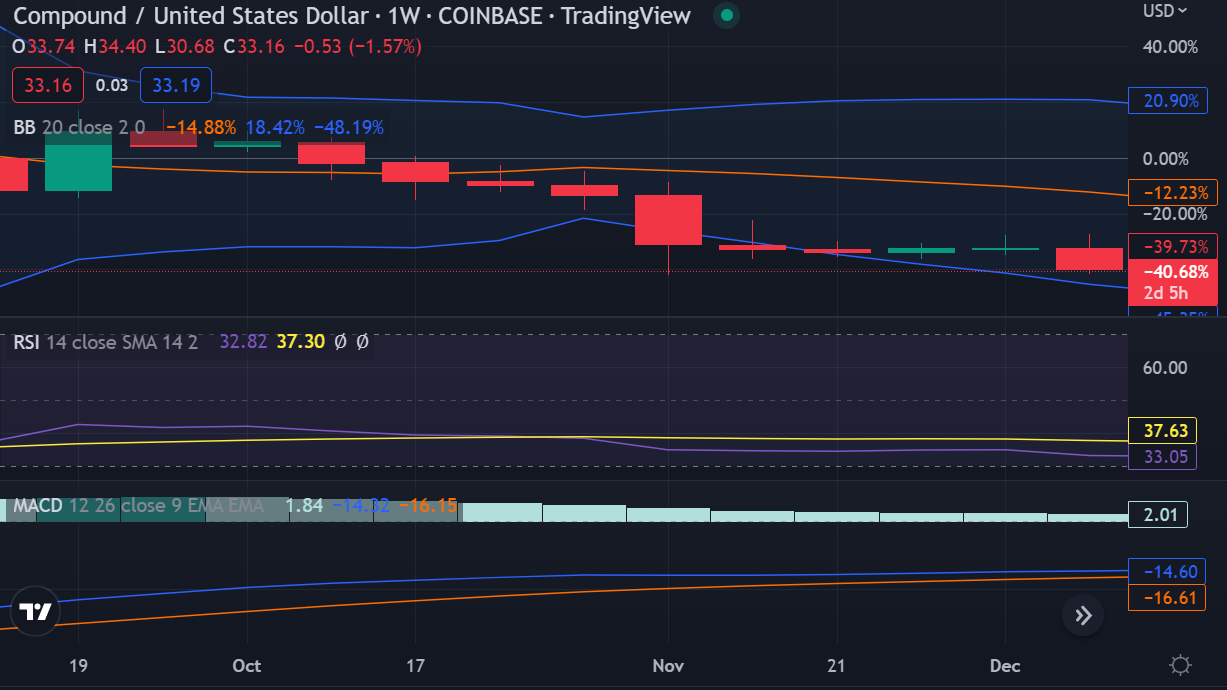
The moving averages are also in line with the bearish momentum, as the 50 and 200-day MAs are below the price action. The SMA (50) is hovering around $33, while the long-term EMA (200) is just below the price action at $31.32.With the moving average lines exhibiting a bearish trend, the price action could remain subdued in the near future.
Further technical indicators show the Chaikin Money Flow Indicator (CMF) suggests that capital inflow into the Compound coin has dropped significantly in the past 24 hours. This could mean that investors are expecting a short-term bearish trend in the coming days.
The MACD indicator has remained in the bearish zone but is gradually starting to show signs of a possible bullish crossover. The Stochastic RSI also showed a potential bullish divergence which could signal an upcoming uptrend.
The Fibonacci retracement levels have also been playing an important role in containing the price of Compound. The 50% retracement level has been providing strong support, while the 61.8% level is proving to be a major resistance point.
It is likely that if the bulls can break above the 61.8% Fibonacci retracement level, then we could see a strong rally in Compound prices. Sustained buying pressure above this level could push the price toward the next key resistance at $40. On the other hand, if the bulls fail to break above $36.6, then the price could drop back down toward the 50% Fibonacci retracement level of $30.
Overall, the Compound price analysis indicates that the bulls are in control and if they can push above the 61.8% Fibonacci retracement level then we could see a strong rally in Compound prices toward new highs.
Compound Price Predictions by Cryptopolitan
Looking at the crypto market sentiment, the year 2022 has experienced two bear market that has seen large sums of crypto being liquidated. On the Compound, the cryptocurrency has been resilient during these bear markets and price prediction for the same is optimistic.
The cryptocurrency has been able to maintain its value at around $32, with the potential of hitting a high of $59.88 in 2023. The crypto markets are expected to recover as we move onwards and the Compound is likely to continue its bullish trend.

Compound Price Prediction 2023
According to our Compound price prediction model, a maximum price of $59.88 is expected. The altcoin might potentially attain an average price of $ 50.76 and a minimum price of $49.36.
Compound Price Prediction 2024
Our Compound price prediction model sees the potential of reaching a maximum price of $86.42 in 2024 with an average price of $71.21 and a minimum price of $60.87.
Compound Price Prediction 2025
According to our Compound price prediction model for 2025, the price of the Compound is expected to reach a minimum price value of $104.21. The COMP price can reach a maximum price value of $123.52 with an average value of $107.16.
Compound Price Prediction 2026
According to our Compound price prediction model, the altcoin is expected to reach a maximum price of $183.98 in 2026. The Compound cryptocurrency might attain an average price of $165.03 and a minimum price of $ 165.03 by the end of 2026.
Compound Price Prediction 2027
According to our Compound forecast for 2029, the COMP coin is expected to trade at $401.12 as the highest price. The average forecast price for 2027 is $358.75 while the minimum price is expected to be $346.76.
Compound Price Prediction 2028
According to our Compound price forecast for 2028, a maximum price forecast of $401.12 is expected. The compound’s price is expected to reach a minimum of $346.76 an average trading price of $358.75.
Compound Price Prediction 2029
Our Compound price forecast for 2029 suggests that the COMP cryptocurrency will trade at a maximum price of $605.89, an average price forecast of $526.34, and a minimum price of $511.99.
Compound Price Prediction 2030
According to our Compound price forecast for 2030, a maximum price target of $876.77 and a minimum level of $695.06 is expected. The altcoin is expected to attain a minimum price of $721.38.
Compound Price Prediction 2031
According to COMP price prediction for 2031, the Compound’s price growth is expected to continue in the future, reaching a maximum price forecast of $1,193.47 and an average of $1,058.27 by the end of 2031. The minimum expected price is $1,022.20.
Compound Price Predictions by DigitalCoinPrice
DigitalCoinPrice, suggests an upswing in the year 2023 when the coin could be worth $95.29. The site suggests the token will be worth $85.38 by the end of the year and gives an average Compound coin price prediction of $95.26 in 2024 and $89.96 in 2025. The site’s Compound coin price prediction for 2025 is $124.37 but also suggests COMP may then recede to $112.27 in 2026.
Compound Price Predictions by Wallet Investor
The long-term Compound prediction from algorithm-based forecasting site WalletInvestor is bearish, projecting that the value of the coin could plunge to $3.13 in a year. The compound forecast by the website is bearish in the long term as the website projects that the price of COMP could reach a low of $3.13 in 2025 and a high of $7.68 in 2029.
Compound Price Predictions by Price Prediction net
PricePrediction.net is also hopeful for the coin’s price, suggesting a maximum price of $59.88 in 2023. The site forecasts a bullish trend with an average of $73.75 in 2024, a maximum of $123.52 by 2025, and a minimum of $104.21 by 2025. The website also predicts that the coin will reach a maximum price of $401.12 in 2028 and a high of $876.77 in 2028 before reaching a peak value of $1,193.47 in 2031.
Conclusion
Looking at the current price movements, current market sentiments, and the various price predictions for Compound, it appears that the coin has a bright future ahead. The coin has shown an upward trend and is expected to further rise in value over the next few years. The team behind the Compound network has been active in developing the platform and expanding its use cases, which could further drive the coin’s value in the future.
On 14 September 2022, Compound protocol announced the introduction of borrowing options for institutions. An official post on Medium declared: “In order to satisfy the rising need for liquidity, businesses are now able to take loans from Compound Treasury by using digital assets as collateral.” This is exciting news in the world of crypto.
When forecasting crypto prices, sentiment in the DeFi market plays a critical role; all governance tokens can face huge price changes. The value of DeFI coins is especially vulnerable to drops if there are any security vulnerabilities discovered. If you decide to invest in COMP, keep in mind that sentiments can change rapidly and it might trail Bitcoin during times when its price shoots up significantly.
COMP’s success is facing another challenge as new DeFi protocols are emerging rapidly. As crypto connoisseurs are always on the lookout for potential profits, a more modern platform could easily take away market share from Compound in only a few days – making it difficult for COMP to remain competitive.
FAQs
What are the risks in investing in Compound (COMP)?
No significant risks precede the normal risks investors take when trading in the crypto market. However, Compound faces competition from Aave, which may affect its performance if Aave offers better services than Compound in the future.
Where can I buy Compound crypto?
You can buy Compound tokens on several centralized and decentralized exchange platforms. Today, you can purchase Compound crypto on Binance, Coinbase Pro, and Huobi Global. COMP is also traded against fiat currencies such as USD on most exchanges
Should I invest in Compound crypto?
Depending on your risk tolerance and preference, a Compound coin can be an excellent investment or not. Short-term investors may not reap good profits from Compound this year considering the forecast; however, forecasts indicate a nice bullish trend from the beginning of 2022. Therefore, long-term investors can invest in Compound. Short-term interests in Compound coins are encouraged for day traders and scalpers.
Should I invest in Compound (COMP) for the short term
Short-term investment in Compound is discouraged. Do not engage in the everyday market trading as short-term fluctuations are widespread for COMP.
Should I invest and hold COMP for the long-term?
Yes. Compound coin price prediction indicates an apparent positive growth in the future. Since the DeFi project is certified as a credible long-term project, investors are encouraged to conduct more research on the project and invest wisely. However, according to the price forecast, the Compound token is an excellent investment to buy and hold for the long term. Please conduct your own research, review, analyze and verify information from reliable sources before investing the amount you can afford to lose.
Disclaimer. The information provided is not trading advice. Cryptopolitan.com holds no liability for any investments made based on the information provided on this page. We strongly recommend independent research and/or consultation with a qualified professional before making any investment decision.

Alden Baldwin
Journalist, Writer, Editor, Researcher, and Strategic Media Manager: With over 10 years of experience in the digital, print and public relations industries, he has been working with the mantra, Creativity, Quality and Punctuality. In his waning years promises to build a a self sustaining institute that provides free education. He is working towards funding his own startup. As a technical and language editor, he has worked with multiple top cryptocurrency publications such as DailyCoin, Inside Bitcoins, Urbanlink Magazine, Crypto Unit News and several others. He has edited over 50,000+ articles, journals, scripts, copies, sales campaign headlines, biographies, newsletters, cover letters, product descriptions, landing pages, business plans, SOPs, e-books, and several other kinds of content.


CRASH COURSE
- Which cryptocurrencies can make you money
- How to boost your security with a wallet (and which ones are actually worth using)
- Little-known investment strategies that the pros use
- How to get started investing in crypto (which exchanges to use, the best crypto to buy etc)