


Key takeaways
- Chiliz price prediction is bullish, projecting CHZ to increase to $0.0565 by the end of 2026.
- In 2028, Chiliz is predicted to reach a maximum price of $0.1373.
- Long term price predictions for CHZ also present a favorable outlook, with the cryptocurrency reaching $0.2825 by 2032,
Chiliz (CHZ) is the native token of Chiliz Chain, a Layer-1 blockchain for Sports and Entertainment tied to Socios.com fan engagement, where users vote in club polls and redeem rewards. Founded by Alexandre Dreyfus in 2017, Chiliz has partnered with major clubs including FC Barcelona, Manchester City, Juventus, and Paris Saint-Germain.
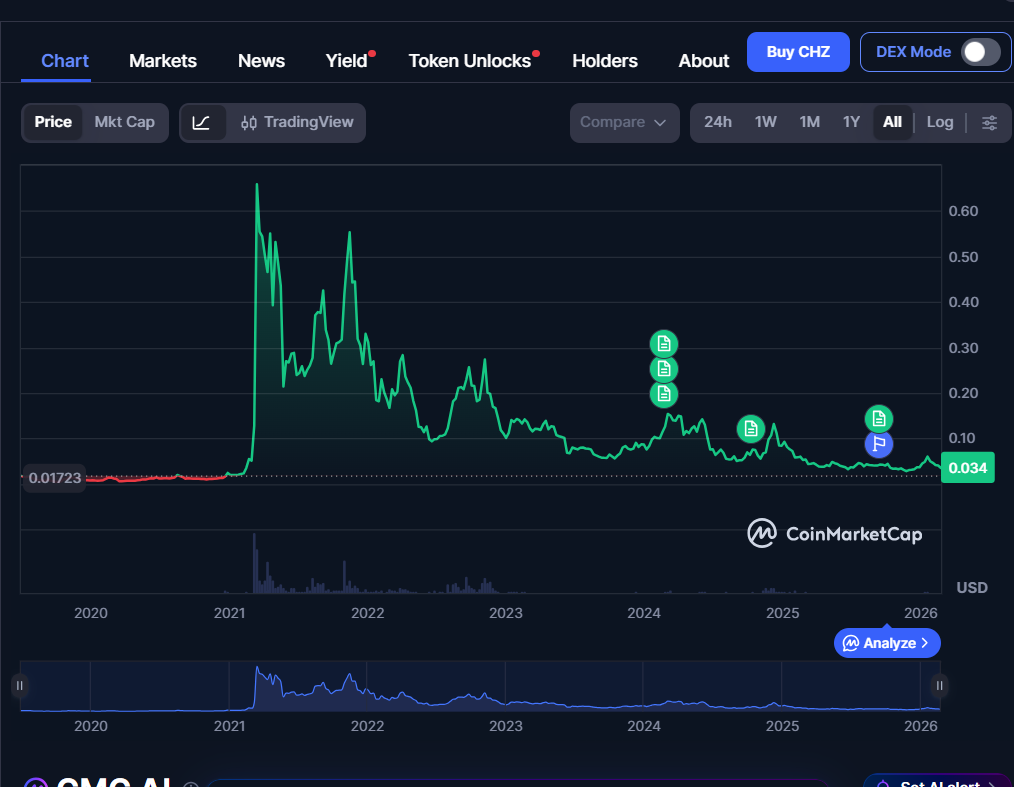
CHZ trades about 96% below its $0.8915 all-time high (March 2021) but roughly 750% above its $0.004001 all-time low (September 2019). The EVM-compatible Chiliz network uses Proof-of-Staked-Authority (PoSA) and a dynamic tokenomics model introduced with the Dragon 8 upgrade, while CHZ price movements also reflect market sentiment, trading volume, circulating supply, smart contracts activity, and broader crypto market conditions.
This Chiliz price prediction for 2026–2032 combines technical analysis (candlestick charts, moving averages, support and resistance levels) with fundamental analysis of market trends, fan tokens, and potential new revenue streams to outline Chiliz’s price forecast. This is not investment advice—do your own research before making investment decisions.
Overview
| Cryptocurrency | Chiliz |
| Token | CHZ |
| Price | $0.03675 |
| Market Cap | $377.34M |
| Trading Volume | $87.89M |
| Circulating Supply | 10.3B CHZ |
| All-time High | $0.8915, Mar 13, 2021 (4 years ago) |
| All-time Low | $0.004001, Sep 28, 2019 (6 years ago) |
| 24-hour High | $0.03698 |
| 24-hour Low | $0.03344 |
Chiliz technical analysis
| Metric | Value |
| Price Prediction | $0.03638 (-3.83%) |
| Volatility | 9.78% (High) |
| 50-Day SMA | $0.04386 |
| 14-Day RSI | 47.52 (Neutral) |
| Sentiment | Neutral |
| Fear & Greed Index | 10 (Extreme Fear) |
| Green Days | 14/30 (47%) |
| 200-Day SMA | $0.03809 |
Chiliz price analysis
- CHZ is currently trading in a range of $0.0366 and $0.0368, up by 9.35% in the last 24 hours.
- Market cap is at $377.34M, while 24h trading volume is up by 101.97% to $87.89M.
- Resistance is at $0.0372, with support around $0.0344 and $0.0340.
As of March 3, 2026, Chiliz (CHZ): the price analysis shows CHZ pushing higher as buyers step in aggressively. The move comes with a sharp jump in trading activity. CHZ’s volume-to-market cap ratio is near 22.8%, which shows a strong turnover for the session.
CHZ price analysis 1-day chart: Bulls reclaim $0.036 as momentum remains stable
On the daily candle, CHZ opened at $0.03451, hit a high of $0.03720, dropped to $0.03438, and closed at $0.03675, ending the session up by 9.35%.
Momentum is improving, but it’s not too strong yet. The RSI (14) is 47.03, so CHZ is still below the bullish zone, but buying interest is coming back.
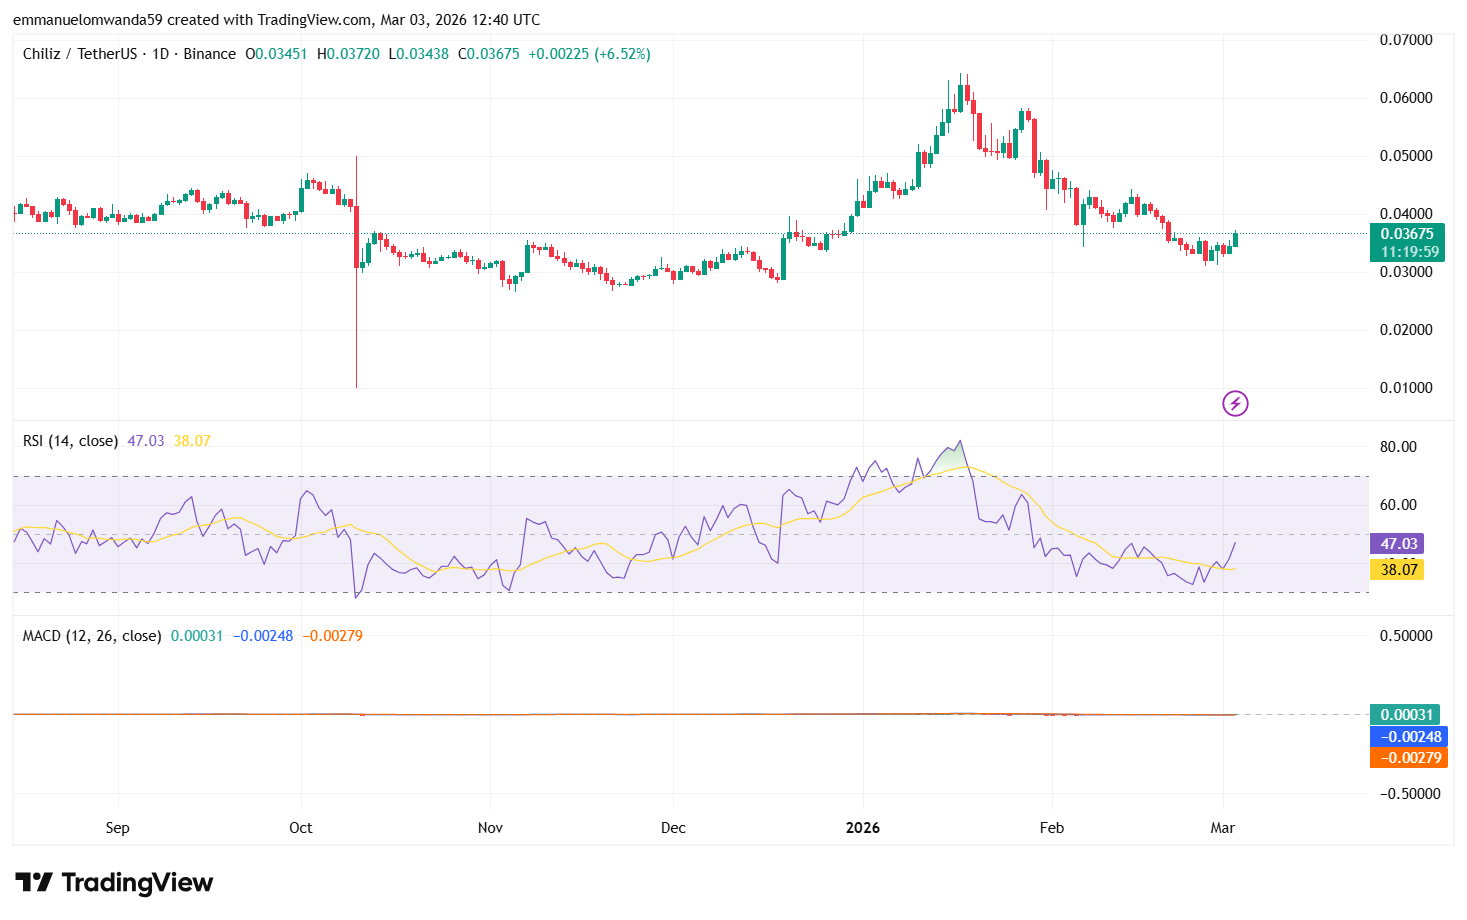
The MACD is also looking better: the MACD line (-0.00248) is above the signal line (-0.00279), and the histogram (0.00031) is positive, showing selling pressure is fading.
Immediate support sits near $0.03438, followed by $0.0340, while resistance stands at $0.03720 and then $0.0380 if buyers extend the push.
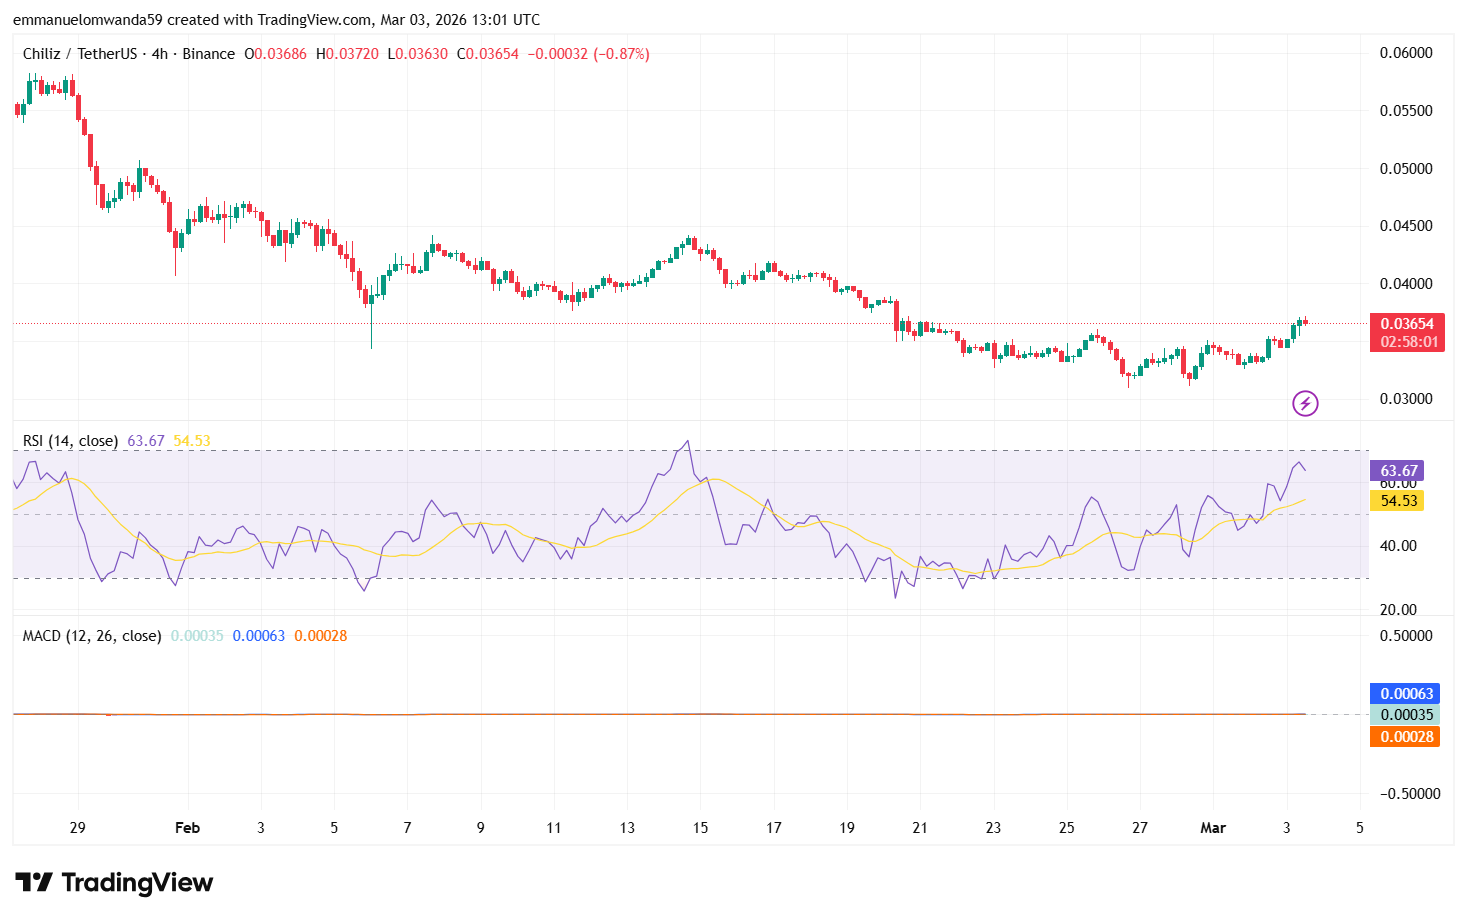
Chiliz 4-hour price chart
On the 4-hour timeframe, CHZ is trading near $0.03654 after giving back a small part of the earlier push. The latest candle opened at $0.03686, hit a high of $0.03720, dropped to $0.03630, and closed at $0.03654, ending down 0.87%.
Momentum still favors buyers overall. The RSI (14) is at 63.67, showing strong buying pressure on the 4-hour timeframe. The MACD remains positive, with the MACD line at 0.00035 and the signal line at 0.00028, which suggests the uptrend is still supported even as the price pauses.
Immediate support sits at $0.03630 and $0.03600, while resistance stands at $0.03720 and then $0.03800 if buyers push again.
CHZ technical indicators: Levels and action
Daily simple moving average (SMA)
| Period | Value | Action |
| SMA 3 | $0.03844 | BUY |
| SMA 5 | $0.03660 | BUY |
| SMA 10 | $0.03370 | BUY |
| SMA 21 | $0.03605 | BUY |
| SMA 50 | $0.04386 | SELL |
| SMA 100 | $0.04025 | SELL |
| SMA 200 | $0.03809 | BUY |
Daily exponential moving average (EMA)
| Period | Value | Action |
| EMA 3 | $0.03867 | SELL |
| EMA 5 | $0.04099 | SELL |
| EMA 10 | $0.04257 | SELL |
| EMA 21 | $0.04127 | SELL |
| EMA 50 | $0.03783 | BUY |
| EMA 100 | $0.03657 | BUY |
| EMA 200 | $0.03856 | SELL |
What to expect from the Chiliz price analysis
CHZ may keep climbing if it holds above $0.0360 and $0.0363, with buyers likely to retest $0.0372 and then $0.0380. If it slips back below $0.0360, the move could cool off and pull the price toward the $0.035 area.
Is Chiliz a good investment?
Investing in Chiliz (CHZ) might be favourable in the long term, as the broader trend remains bearish and several technical indicators still point to weak momentum. CHZ could still offer long-term upside if adoption grows, but near term, volatility and downside risk remain elevated.
Why is chilliz up today?
CHZ is up today mainly because it broke out of a bearish chart pattern and buyers backed the move with a big jump in trading volume, showing strong demand. Social sentiment and mild altcoin rotation helped the rally, but no clear coin-specific news catalyst was identified.
Will CHZ reach $0.1?
Yes, expert analysis shows that CHZ is expected to reach $0.1 in 2028.
Will CHZ reach $0.5?
Yes, CHZ has the potential to reach $0.5 and beyond. According to the long-term predictions, in the next several years.
Will CHZ reach $1?
Yes, CHZ is projected to reach $1. The highest price prediction is $1.19, suggesting that CHZ has the potential to achieve this milestone.
Does CHZ have a good long-term future?
Yes, based on the price predictions for 2026 to 2032, CHZ shows a positive long-term outlook. The predictions indicate steady growth, with maximum prices increasing gradually each year.
Recent news/opinion on Chiliz
Chiliz has recently said it is taking Fan Tokens “omni-chain,” aiming to make assets tied to major brands such as Juventus, FC Barcelona, PSG, and the UFC available across multiple Layer-1 blockchains. The company described the push as creating a single, global sports asset class that users can access on their preferred network.
Chiliz has initiated a major tokenomics upgrade. Starting in March 2026, 10% of all revenue generated from Fan Token sales will be used to conduct regular buybacks and burns of the native CHZ token. This mechanism directly ties the economic activity of the sports fan ecosystem to demand for CHZ, expanding its utility beyond simple governance.
Chiliz (CHZ) price prediction for March 2026
The price of Chiliz is predicted to reach a minimum value of $0.032 in March 2026. The price of CHZ could reach a maximum of $0.0439, with the average estimated trading value of $0.03695.
| CHZ price prediction | Minimum Price | Average Price | Maximum Price |
| CHZ price prediction March 2026 | $0.032 | $0.03695 | $0.0439 |
Chiliz price prediction 2026
In 2026, Chiliz could trade at a minimum of $0.03 and reach a maximum of $0.0565, with an average price of $0.04475 throughout the year, if current sentiment doesn’t change.
| CHZ Price Prediction | Minimum Price | Average Price | Maximum Price |
| CHZ price prediction 2026 | $0.03 | $0.04475 | $0.0565 |
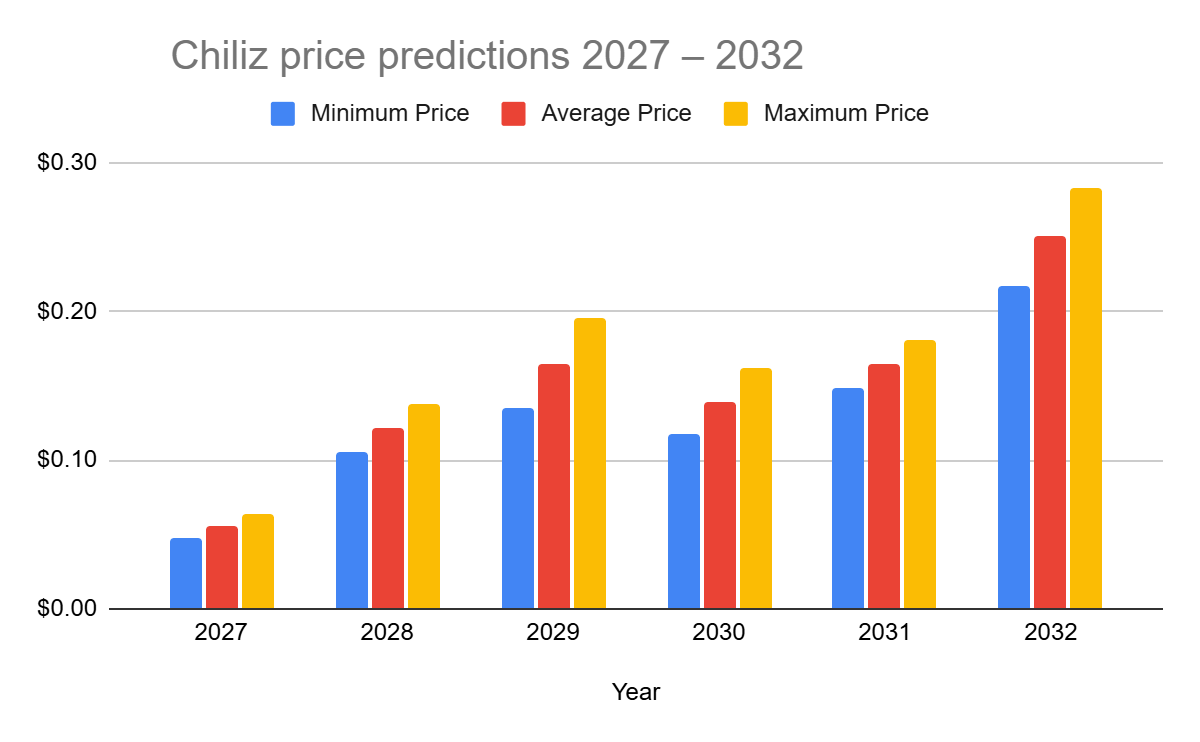
Chiliz price predictions 2027 – 2032
| Year | Minimum Price | Average Price | Maximum Price |
| 2027 | $0.0478 | $0.0556 | $0.0634 |
| 2028 | $0.1057 | $0.1215 | $0.1373 |
| 2029 | $0.1350 | $0.1650 | $0.1950 |
| 2030 | $0.1173 | $0.1396 | $0.162 |
| 2031 | $0.1483 | $0.1648 | $0.1813 |
| 2032 | $0.2175 | $0.25 | $0.2825 |
Chiliz price prediction 2027
Based on forecasts and technical analysis, in 2027, the price of Chiliz is expected to range from $0.0478 to $0.0634, with an average trading price of $0.0556.
Chiliz price prediction 2028
In 2028, the price of Chiliz is forecast to trade around a minimum of $0.1057 and could reach a maximum of $0.1373, with an average price of $0.1215.
Chiliz price prediction 2029
As per the forecasts and technical analysis, in 2029, Chiliz is expected to trade at a minimum of $0.1350 and a maximum of $0.1950, with an average price of $0.1650..
Chiliz price prediction 2030
The price of Chiliz is predicted to reach a minimum of $0.1173 in 2030 and a maximum of $0.1620, with an average price of $0.1396.
Chiliz price prediction 2031
According to technical analysis on past price data of CHZ, in 2031, the price of Chiliz is predicted to trade between a minimum of $0.1483 and a maximum of $0.1813, with an average price of $0.1648.
Chiliz price prediction 2032
In 2032, Chiliz is forecast to trade between $0.2175 and $0.2825, with an average price of $0.2500.
Chiliz market price prediction: Analysts’ CHZ price forecast
| Firm Name | 2026 | 2027 |
| Changelly | $0.0430 | $0.0661 |
| coincodex | $ 0.045683 | $ 0.045705 |
Cryptopolitan’s Chiliz (CHZ) price prediction
In a bullish scenario, Cryptopolitan estimates that Chiliz could trade at a minimum of $0.03 and reach a maximum of $0.0565, with an average price of $0.04475 throughout the year, if current sentiment doesn’t change.
Chiliz historic price sentiment
- CHZ saw significant volatility, starting strong in December 2021 at $0.2834 but dropping sharply by March 2022 to $0.2830. This period reflected intense speculative activity and price discovery in the cryptocurrency market.
- The price of CHZ continued to decline from $0.2830 in April to $0.1221 by July 2022. This decline marked a period of correction after previous highs, with market sentiment turning bearish amidst broader market volatility.
- CHZ rebounded strongly from $0.1221 in August to $0.1656 by November 2022. This recovery period suggested renewed investor confidence and a bullish trend emerging in the cryptocurrency.
- CHZ experienced mixed sentiment from December 2022 to March 2023, rising from $0.1002 to $0.1497 before dropping to $0.0773 by July 2023 due to market corrections and cautious sentiment.
- The price recovered from $0.0773 in August to $0.1078 by November 2023, reflecting renewed interest and positive developments. It continued its upward trend into December 2023.
- CHZ started 2024 at $0.0998, climbing to $0.1497 by March amid bullish sentiment, but dropped to $0.0759 by June due to market corrections and cautious sentiment.
- By late 2024, CHZ stabilized between $0.07 and $0.08, showing minor fluctuations and a gradual recovery in December, reflecting renewed buying interest.
- For January 2025, Chiliz maintained stability around $0.081, showing consistent performance without significant spikes or drops, likely reflecting steady market sentiment.
- In February and March, CHZ traded within a tight range between $0.080 and $0.085, reflecting low volatility and neutral sentiment. Despite growing interest in sports-based blockchain platforms, CHZ lacked the momentum to break out of its consolidation zone.
- April 2025 brought a moderate upward push as the token crossed the $0.090 mark, boosted by improved sentiment across the broader crypto market and growing adoption narratives within Chiliz’s ecosystem. The price gradually climbed, reflecting mild bullish activity.
- In May, CHZ sustained its upward trajectory, reaching $0.038 by the end of the month. This was accompanied by rising trading volumes and improved technical outlooks, hinting at increasing investor interest.
- By June 2025, CHZ gained traction and began showing stronger bullish signals, moving toward the $0.040 zone. This period marked the beginning of renewed accumulation, likely driven by upcoming ecosystem announcements and validator developments.
- As of mid-July 2025, CHZ traded at approximately $0.0422, extending its climb from early-year levels. The token showed consistent growth from its 2025 January base, supported by real-world integrations like PSG’s validator launch and ecosystem expansion, positioning it favorably in the Web3 sports narrative.
- By the end of 2025, CHZ eased back toward the $0.035 and $0.040 zone as buying momentum cooled after the mid-year climb.
- At the start of March 2026, CHZ is trading around $0.0349, showing a moderate rebounce as buyers defend the $0.034 and $0.035 zone while the market remains cautious.
FAQs
Is Chiliz (CHZ) a good investment?
Chiliz (CHZ) shows promise as an investment due to its role in enhancing fan engagement through blockchain technology in sports. It is increasingly adopted by major clubs, with forecasts suggesting potential growth to $0.0 and $1.1 by 2031.
What is the utility of the CHZ token?
CHZ serves as the primary currency enabling users to buy NFTs on Chiliz's Socios fan token marketplace. Without Socios, there would be no CHZ token. The Socios platform allows fans to acquire branded NFTs, connecting them with their favorite teams and entertainers, all facilitated by CHZ.
Where can I safely store CHZ?
Consider purchasing a Ledger hardware wallet to securely store your chiliZ and other cryptocurrencies. This Bluetooth® enabled wallet offers the best security for managing your crypto independently, ensuring it remains accessible and safe wherever you go. With Ledger, you can confidently manage and protect your entire crypto portfolio, including chiliZ, ensuring peace of mind and ease of use.
Where can I buy CHZ?
CHZ is available on Binance, Huobi, Coinbase and many other exchanges.
Can CHZ crash?
Yes, like any cryptocurrency, Chiliz (CHZ) can experience price crashes due to various factors such as market volatility, regulatory changes, macroeconomic events, or shifts in investor sentiment. These crashes can lead to significant price declines over short periods.
Is CHZ a scam or legit?
Chiliz (CHZ) is considered a legitimate cryptocurrency and blockchain project. It serves a specific purpose in the sports and entertainment industries through its Socios platform, allowing fans to engage with their favorite teams and influencers via blockchain-based fan tokens. The platform has partnerships with major sports clubs globally, enhancing its credibility.
Disclaimer. The information provided is not trading advice. Cryptopolitan.com holds no liability for any investments made based on the information provided on this page. We strongly recommend independent research and/or consultation with a qualified professional before making any investment decisions.

Emman Omwanda
Emmanuel Omwanda’s expertise lies in cryptocurrency markets, spanning both fundamental and technical analysis. He previously worked with various crypto media sites before joining Cryptopolitan, including CoinEdition, The Crypto Basic, CryptoNews Flash, and DroomDroom.He holds a Bachelor of Science (BSc.) in Mathematics and Computer Science from Kenyatta University, Kenya, and is currently in his final year pursuing a Bachelor of Arts in Communication and Media Studies.


