


Best crypto insights delivered straight to your inbox.

Through Celo Connect, Celo aims to align and empower the world’s changemakers with tools, knowledge, and inspiration to contribute to a new financial system that creates conditions of prosperity for all. The Celo Connect Mobile Hackathon was held on April 1st-3rd at Attico Bogatell in Barcelona.
One of the strong points of Celo is that they are extremely environmentally friendly, thanks to many initiatives and their proof of stake (PoS) consensus model. Some of the most recent news for this project includes an uplisting to major crypto exchange WazirX, one of India’s largest crypto exchanges. WazirX is owned by Binance too!

Today’s Celo price is $1.27 with a 24-hour trading volume of $23,463,529. Celo is down 4.58% in the last 24 hours. The current CoinMarketCap ranking is #77, with a live market cap of $565,552,162. It has a circulating supply of 445,012,828 CELO coins and a max. supply of 1,000,000,000 CELO coins.
What is the foreseeable effect of these developments and Web3 on the CELO price? Let’s dive right in.
What is Celo?
The Celo ecosystem is a blockchain-based network seeking to raise the number of smartphone cryptocurrency users. The platform founders identified a wide gap between the number of smartphone users and cryptocurrency users.
The overall adoption of cryptocurrencies has been relatively slow, but it has recently begun to pick up. The Celo team is determined to integrate smartphones numbers and use their public keys to facilitate blockchain-based transfers of cryptocurrencies.
The Celo project aims to crack the smartphone industry and promote the adoption of cryptocurrencies to a broader audience. The Celo system aims to connect billions of smartphones to the cryptocurrency space, making crypto a household name.
Celo is also a payments infrastructure platform aiming to make decentralized finance products available on mobile devices. The platform has cUSD and cEUR, stablecoins pegged to the value of dollars and euros native to the Celo platform. There is also a Celo token which has both utility and governance applications.
The project aims to ensure that everyone has access to decentralized finance (DeFi) by using a broad range of smart contracts within its blockchain network.
Through its robust catalog of decentralized applications (DApps), Celo will help provide much-needed financial services to both the banked and the unbanked.
Celo new developments
The Celo Foundation will commit $10 million of CELO in Uniswap-specific user incentives and grants and $10 million in financial incentives for Uniswap specifically. The main focus of deployment would be the introduction of green asset liquidity pools with natural capital-backed assets such as tokenized carbon credits. The foundation also plans to briefly introduce nature-backed assets issued on Celo, like land and forests.
The Celo Foundation aims to rebalance its reserves using natural blacked assets with the help of Uniswap’s decentralized mechanism. Currently, the foundation is dependent on centralized exchanges for rebalancing; however, these exchanges don’t support green assets, and thus, the role of Uniswap becomes even more prominent.
What are Celo’s two native tokens?
The Celo ecosystem operates two native digital tokens, the CUSD (Celo dollar)- a stablecoin already in use within the platform, and the CELO cryptocurrency. We will be analyzing the latter’s price predictions in this article.
Essentially, the CELO price prediction is massively dependent on the current CELO price and the historical price of the CELO cryptocurrency. However, before we have a deeper analysis of the future price of CELO, let’s look at the Celo protocol and what it entails to have a better understanding of the project and transaction fees between CELO wallet and another.
The Celo blockchain is unique because it provides a special focus on the financial sector. When the internet began, every product was fixated on serving desktop users until the designers realized the importance of mobile users.
We often use mobile phones more than we use our desktop computers. The Celo team aims to absorb mobile users into the world of cryptocurrencies to make transactions more straightforward and accessible.
The Celo project is optimized for mobile and allows users to pay gas fees instantly, and it’s calculated instantly on the application.
Additionally, the native token of Celo is aimed at providing utility to marginalized regions where most people do not have access to conventional banking services. It allows smartphone users to access several aspects of decentralized finance through its arsenal of smart contracts and decentralized applications.
Since there is a wide gap between crypto adopters and smartphone users, the Celo ecosystem aims to bridge this gap and allow smartphone owners to access all DeFi features on their phones.
The CELO token is poised to benefit from this venture since smartphone users’ increasing adoption of the Celo blockchain will undoubtedly result in the CELO price increase.
There are two native coins on the Celo platform, the CELO digital token and the CUSD, a stablecoin. These two cryptocurrencies complement each other within the Celo platform. CELO has a maximum supply of 1 billion tokens.
The CELO token employs unique tokenomics, which are meant to benefit CELO price today and the price of CELO in the future.
The Celo platform users can utilize the CELO cryptocurrency to make governance decisions helps forecast through a voting system. Also, the proof of stake consensus algorithm allows the network to be sufficiently secure, ensuring the safety of CELO coin investors in the long run.
Aside from being a speculative cryptocurrency with the ability to increase in value, the token has a wide range of utilities. Crypto traders can buy and sell cryptocurrency on popular exchange platforms to make short-term profits. Similarly, users of the platform use the token to pay for transactions within the Celo ecosystem, putting the cryptocurrency in demand.
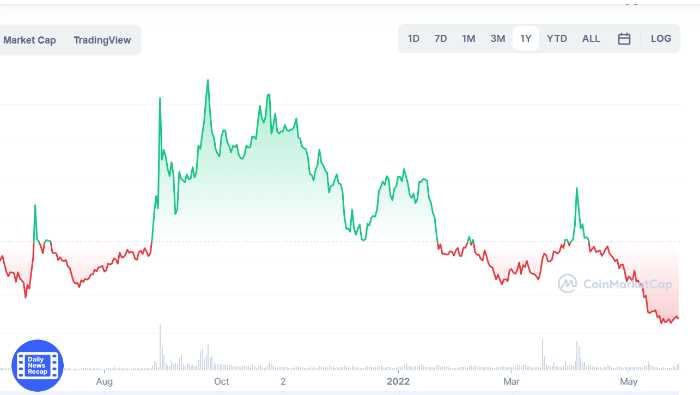
Having understood the Celo platform, it is prudent to look at the historical price of CELO to determine its expected future price and give aspiring holders a glimpse of what our data says about CELO price prediction.
Celo Price Overview
Celo Overview
[mcrypto id=”141364″]
C
While previous performance is never a perfect predictor of future results, understanding the Celo price history can help us make and comprehend a Celo price prediction.
Celo was trading at or near $2.50 when it initially hit the open market in May 2020, but it quickly dropped to roughly $1.70 by the summer. Then, in August, the coin experienced a brief bullish trend, momentarily reaching $4 before reverting to previous values.
Things changed in 2021 as more and more investors became interested in Celo due to the growing number of buyers in the cryptocurrency market.
Pros and Cons of investing in CELO
The Celo network provides a significant amount of utility to the financial sector. Much has been discussed about the scalability of blockchain technology and the ability to get the technology to reach all corners of the world. Currently, Celo is at the forefront of this mission to make cryptocurrencies a household name among the unbanked and the underprivileged.
The project will reach billions of users by targeting everyone with a smartphone since the world is currently home to billions of smartphones. The platform fronts the idea of using phone numbers as public keys on its blockchain to facilitate the transfer of cryptocurrencies between users.
The potential of the Celo ecosystem is massive and successful penetration of smartphone users will undoubtedly be a big boost to CELO token investors. Here are some pros and cons of investing in CELO at this stage.
Pros of investing in CELO
- At the moment, CELO is trading below its ATH; however, price predictions indicate that the token will resume a bullish momentum that will see it begin to restest its resistance level. Our analysis suggests a strong bullish momentum in the future that will benefit long-term holders of CELO.
- The Celo platform provides a credible solution to the cryptocurrency space; unlike other shitcoins, the project aims to solve an actual problem in the cryptocurrency space. Massive adoption of the Celo blockchain will undoubtedly ensure that the price of CELO goes up, and early investors stand a chance to make huge profits from the forecasted price increases.
- Currently, the trading volume of CELO has been on the rise, indicating an increasing demand by cryptocurrency traders. If the trend continues, the token will certainly realize even further price gains that will, in turn, result in more profits making CELO a profitable investment in the long term.
- Smartphone users comprise the majority of internet users and make up the Celo team’s primary target. Suppose the Celo network adopts a majority of smartphone users and integrates cryptocurrency transactions using phone numbers. In that case, the token holders will benefit from the massive profits from their CELO tokens which will be in high demand for transactions.
- Trend analysis on the price chart of the CELO cryptocurrency indicates a possible bullish momentum to resume next year. However, the projected bull momentum appears to be relatively slow, with an exponential growth in CELO price expected to happen two years from now. Therefore, holders with a longer time horizon benefit more from holding the token.
Cons of investing in CELO
- CELO is a speculative digital asset with a market dominance of 0.07% today. With a market cap of $2,120,782,365.69, this token is easily susceptible to induced market volatility by whales. If whales decide to pump and dump, weak hands may lose a significant part of their investments out of fear.
- Considering the short-term CELO forecast, it is evident that the is an anticipated drop in its value over the coming years. The decline, however, is projected to last a short while, with the token resuming its bullish momentum later in 2022. However, if the crypto market experiences another bear run, CELO holders can witness a prolonged downward trend.
Where can I buy CELO cryptocurrency?
CELO virtual currency can be bought on several cryptocurrency exchanges today. Since the coin has an average market dominance of 0.08%, it already has a large following due to increasing crypto usage on the Celo blockchain ecosystem with automatic fee calculation. CELO markets are available on Binance, Coinbase Exchange, Binance US, KuCoin, and Gate.io. The crypto exchange platforms offer several market pairs, including CELO/USDT, CELO/BUSD, CELO/BTC, and CELO/USD.
Celo produces its own wallet software that is available for download on its website, which allows you to store Celo on your computer. For maximum security, you can store your cryptocurrencies on a dedicated hardware wallet such as a TREZOR wallet or a Ledger Nano X. If you do not wish to buy a hardware wallet, you may consider using a mobile wallet such as Atomic Wallet, Jaxx, or Coinomi to store multiple cryptocurrencies with some added security benefits.
CELO Technical Analysis
Celo (CELO) current price is $1.36 with a market cap of $1,348,578,683. Its price is -8.52 percent down in the last 24 hours. Celo (CELO) is on rank #72 with a dominance of 0.05 percent in the entire cryptocurrency market. The price of Celo decreased by -0.52% during the last 7 days. Over the last month, the price of Celo has decreased by -51.07%. As a result, all the given values could change day by day from exchange to exchange.
The overall technical indicator point to the bearish trend in the short term as well as in the long term. The moving averages are bearish and they are pointing down. The MACD is currently in a bearish mode with a downward crossover. The RSI is oversold at the moment and it looks like it could go further down.
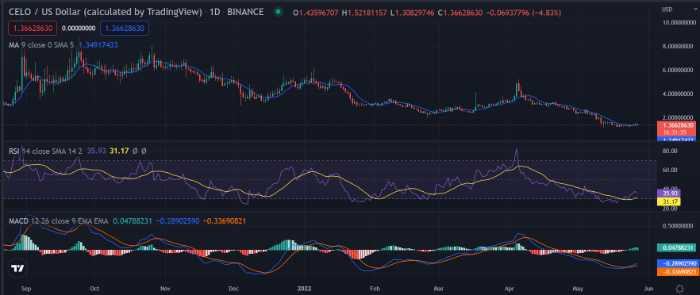
The CELO coin price has been stagnant for about a week, with a bullish breakout from the $2.79 overhead barrier suggesting a long-term investment opportunity.The bears were, however, anticipated by the lengthy higher price rejection candle at the end of May, resulting in a fakeout from the $2.79 support level.
CELO Price Predictions by Authority Sites
Wallet Investor
According to the Wallet investor, the present condition for Celo (CELO) and, if applicable, its market environment has been in a bearish trend for the previous year According to the experts the digital asset will have a negative trend in the future, and that the CELO is an unwise investment for financial gain. Since this virtual currency has a negative outlook they predict CELO to reach a maximum price of $2.34 by the end of 2022 and an average price of $0..893.
PricePrediction.net
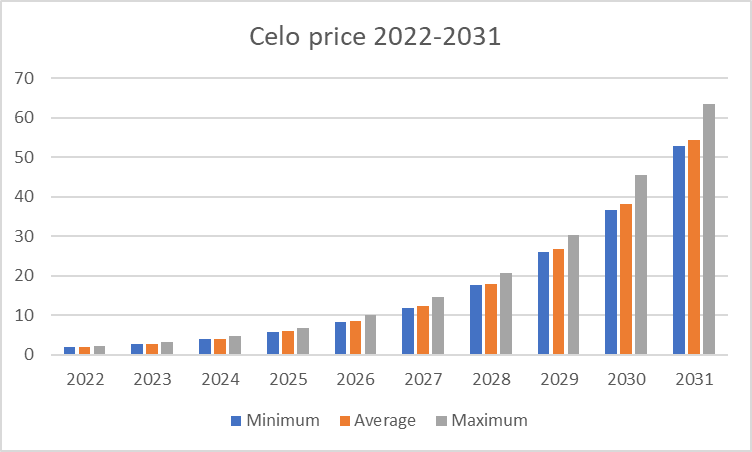
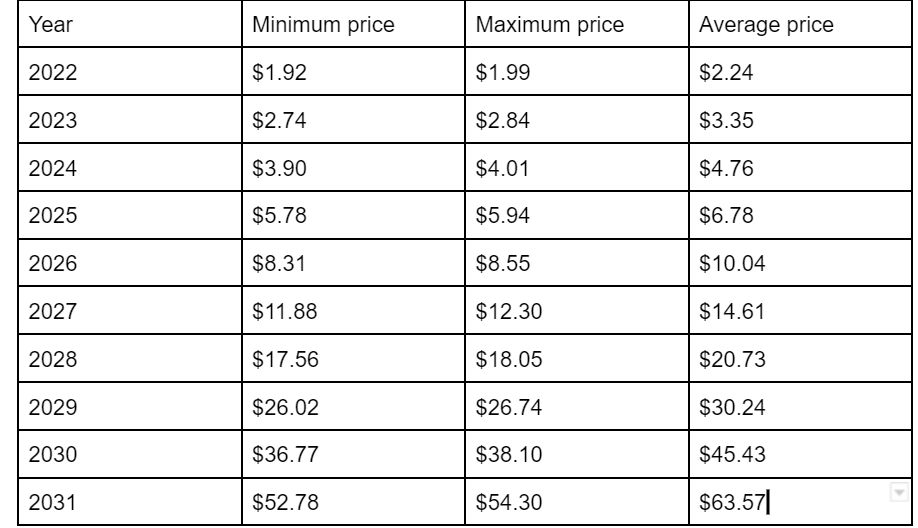
This website has a more optimistic outlook for Celo. They are projecting that CELO will reach a minimum price of $5.78in 2025 and a maximum price of $63.57 by 2030.
DigitalCoinPrice
This website has a five-year forecast for Celo (CELO). CELO is expected to cross the level of $1.86. By the end of the year, Celo is expected to reach a minimum fee of $1.67. In addition, the CELO price is capable of getting a maximum level of $1.93. They are predicting that CELO will have an ATH in 2023 with a minimum price of $1.076 and a maximum price of $2.55. From 2024-2025 the prices will drop again with a minimum price of $1.95 in 2024 and a maximum price of $2.88 level in 2025.
Cryptopolitan
Celo price prediction 2022
According to our in-depth technical analysis of previous CELO price information, the price of Celo is expected to reach a minimum price of $1.92 by 2022. With a trading price of $1.99 on average, the CELO price is likely to rise to its maximum level of $2.24 by the end of 2022.
Celo Price Prediction 2023
As per our technical analysis, the price of Celo is expected to reach a minimum price of $1.96 by 2023. However, with a trading price of $2.03 on average, the CELO price is likely to rise to its maximum level of $2.29 by the end of 2023.
Celo Price Prediction 2024
For the year 2024, our technical analysis shows that the price of Celo is expected to reach a minimum price of $2.74. Even though the average trading price will be around $2.84, the CELO price is likely to rise to its maximum level of $3.35 by the end of 2024.
Celo Price Prediction 2025
The value of the Celo network will rise as a result of the network builders and community investors’ efforts. Therefore, the calculated price for the year 2025 is bullish. CELO was anticipated to touch a maximum price level of $6.78 by the end of 2025, according to analysts. An average price of $5.94 is expected in 2025 depending on the market.
Celo Price Prediction 2026
Celo Price forecast, or CELO, will experience tremendous growth in 2026 as it has the potential to achieve a maximum price of $8.31 and an average price of $8.35.The minimum price for CELO is exected to be $8.31 by the end of 2026.
Celo Price Prediction 2027
Celo’s price is forecasted to reach $11.0 by the end of 2027. According to our in-depth analysis, the minimum price for CELO will be $11.88, and the maximum price will be $14.61. The average price is expected to be around $12.30 in 2027.
Celo Price Prediction 2028
According to market analysts and experts predict say that Celo price is expected to reach a minimum price of $17.56,a maximum price of $20.23 and an average price of $18.05.
Celo Price Prediction 2029
Celo price may cross $30.02 if the market sees a good bull run in 2029. Given that it is expected to be held by long-term investors, its average price for 2029 will be around $26.74 and a minimum price of $26.02.
Celo Price Prediction 2030
With an anticipated price of $45.43 for 2030, it has a good chance of surpassing the present trend and establishing new highsThe price tagline may fluctuate based on the cryptocurrency market’s progress toward 2030.Celo price may reach an average price of $38.10 and a minimum price of $36.77.
CELO Price Prediction by Industry Influencers
Nicky Buffet
In his video, Nicky goes through the blockchain layer project Celo. Through their cryptocurrency and stablecoins, Celo has been working to make cross-border transactions easy. Celo currently offers three major stablecoins in the US Dollar, Euro, and Brazilian Real..Celo is environmentally friendly due to a variety of activities and its proof-of-stake (PoS) consensus mechanism, which is one of its most notable characteristics.
DYOR net market analysts have also listed CELO in the list of the most promising cryptocurrency with a huge potential to generate massive ROI in the long term.
As we stated earlier, influencers have different opinions about Celo’s future price. However, all these predictions are based on a thorough analysis of the CELO project and the current trends in the crypto industry.
Conclusion
CELO cryptocurrency price shows all the bullish tendencies and therefore is a good investment for cryptocurrency enthusiasts. The token can ensure that users earn significant profits from their investments over a more extended period. Although market volatility is unpredictable, the price analysis of the cryptocurrency allows us to predict a relatively positive growth over five years and beyond.
The CELO price analysis based on the CELO price forecast shows that cryptocurrency enthusiasts can buy CELO and hold it for the long term. Price prediction CELO from several mathematical predictions is bullish. A project that the current downward trend of CELO will be flipped and a bullish run will begin in 2022, and the trend is poised to continue over the next few years.
Cryptocurrency price is highly unpredictable. Nobody knows what the future holds for cryptocurrency, but as you can see crypto market cap has increased many folds over the past several years.
The CELO market cap will grow more in the coming year. If you want to hold cryptocurrency for a long time, stay away from pump-and-dump coins that may look attractive but may crash soon.
[the_ad_placement id=”writers”]
FAQs
Is Celo built on the Ethereum blockchain?
Celo is a layer one protocol and blockchain platform that operates independently of the Ethereum network. While the Celo client began as a fork of Ethereum’s Go language client, go-Ethereum, it has some notable features, including a PBFT consensus process based on Proof-of-Stake.
What is the future of Celo?
Professional analysts forecasted a bright future, with the coin averaging $3.95 in 2022, rising to $5.63 in 2025, and $13.7 in 2030.
Is CELO profitable for short-term investors?
Depending on the crypto holders’ needs, the CELO cryptocurrency can be profitable in the short term. A short-term investment that could last a year or less can benefit if the coin follows our CELO price forecasts.
Should I buy and hold CELO for the long term?
Yes, CELO projections on a prolonged time frame indicate an incredible bullish trend. The token is expected to continue rallying high and retest its resistance level in a few years. Therefore, the cryptocurrency will ensure crypto holders enjoy a profitable investment option for the long term. Take this as a guide but DYOR.
Disclaimer. The information provided is not trading advice. Cryptopolitan.com holds no liability for any investments made based on the information provided on this page. We strongly recommend independent research and/or consultation with a qualified professional before making any investment decisions.

Alden Baldwin
Journalist, Writer, Editor, Researcher, and Strategic Media Manager: With over 10 years of experience in the digital, print and public relations industries, he has been working with the mantra, Creativity, Quality and Punctuality. In his waning years promises to build a a self sustaining institute that provides free education. He is working towards funding his own startup. As a technical and language editor, he has worked with multiple top cryptocurrency publications such as DailyCoin, Inside Bitcoins, Urbanlink Magazine, Crypto Unit News and several others. He has edited over 50,000+ articles, journals, scripts, copies, sales campaign headlines, biographies, newsletters, cover letters, product descriptions, landing pages, business plans, SOPs, e-books, and several other kinds of content.


CRASH COURSE
- Which cryptocurrencies can make you money
- How to boost your security with a wallet (and which ones are actually worth using)
- Little-known investment strategies that the pros use
- How to get started investing in crypto (which exchanges to use, the best crypto to buy etc)