Bitcoin Cash Price Prediction 2024-2033
- BCH Price Prediction 2024 – up to $440.02
- BCH Price Prediction 2027 – up to $1,407.00
- BCH Price Prediction 2030 – up to $3,995.00
- BCH Price Prediction 2033 – up to $11,712.00
Bitcoin Cash emerged in August 2017, born from a pivotal fork of Bitcoin, the pioneering cryptocurrency. While it shares its lineage with Bitcoin, BCH has carved out its niche in the crypto space, with an emphasis on transaction efficiency and scalability. At present, the cryptocurrency market is a complex and dynamic arena, with an unprecedented surge in interests and investments, leading to increased market capitalization and a proliferation of new digital currencies.
However, the market has faced regulatory scrutiny, security concerns, and debates over the environmental impact of mining operations. These factors collectively contribute to the market’s volatility and the varying fortunes of cryptocurrencies, including Bitcoin Cash. As investors and enthusiasts look towards the future, the big question is “Does Bitcoin Cash present a compelling investment opportunity?” Let’s get into the analysis of BCH.
How much is BCH worth?
The current Bitcoin Cash price is $268.74, with a 24-hour trading volume of $167,710,829. Bitcoin Cash is up by 1.01% in the last 24 hours. The current CoinMarketCap ranking is #20, with a live market cap of $5,280,695,543 USD. It has a circulating supply of 19,645,581 BCH coins and a max. supply of 21,000,000 BCH coins.
BCH Price Analysis: Will support hold or bears take over?
- BCH above support at $258.4
- Bitcoin Cash (BCH) is consolidating between $258.8 to $282.9
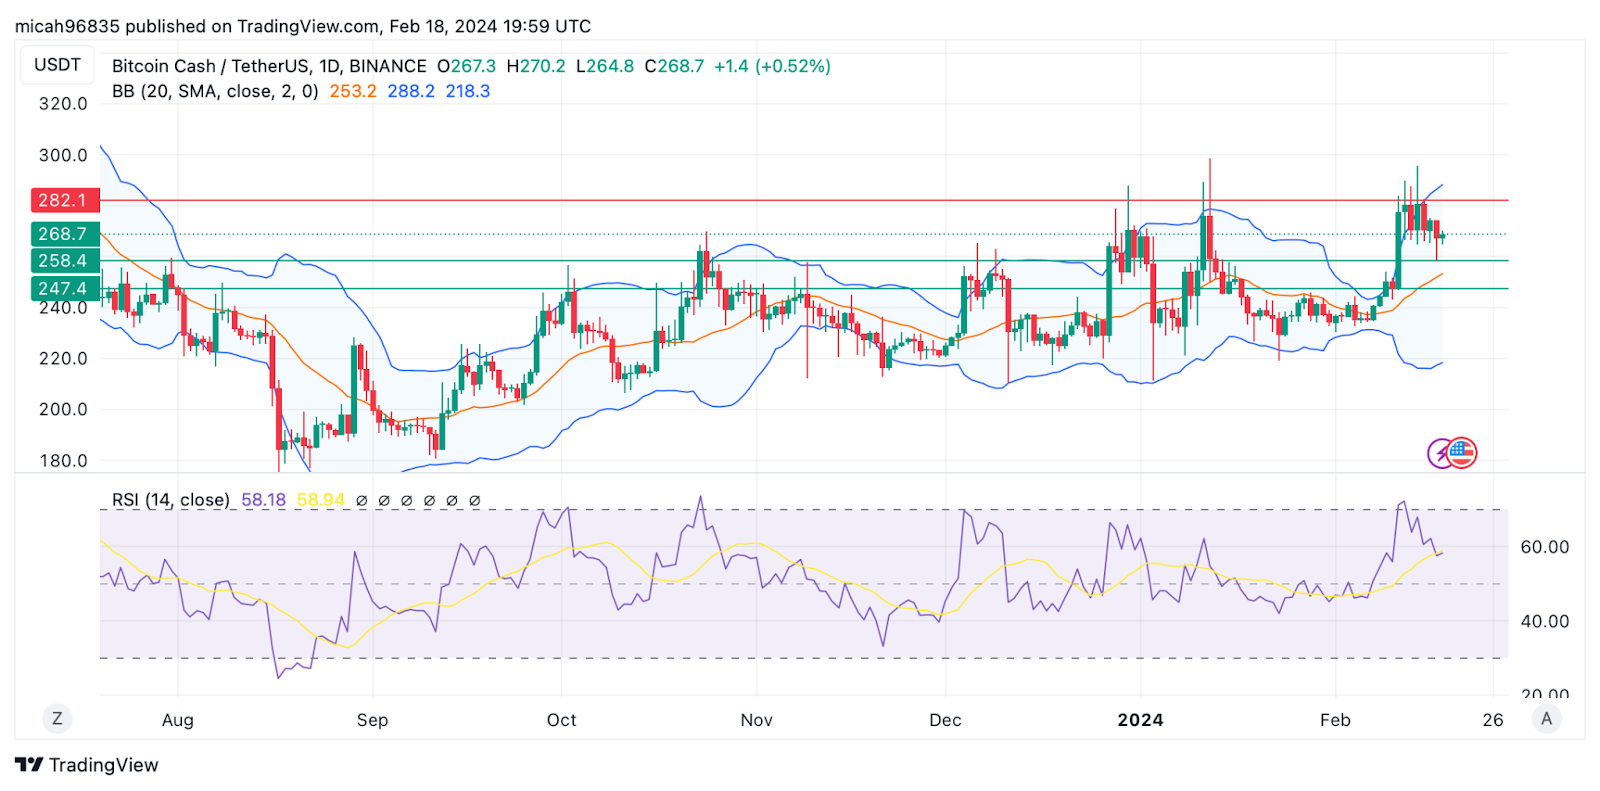
BCH price analysis 1-day chart: Potential sell pressure to take BCH to $258?
Based on the daily price chart of BCH/USD, Bitcoin Cash is currently trading above its support level of $258.4. Conversely, the current resistance level for BCH is at $282.1. If the price of BCH falls below support at $258, it could indicate a weakening in buying interest and potentially lead to a price decline, with the next support levels at $247.4. The Bollinger Bands are wide, suggesting that there has been notable volatility within this period. On the other hand, the RSI is close to 59, suggesting a relatively balanced momentum with a slight tilt towards selling pressure.
BCH price analysis 4-hour chart: BCH consolidating between $258 to $283
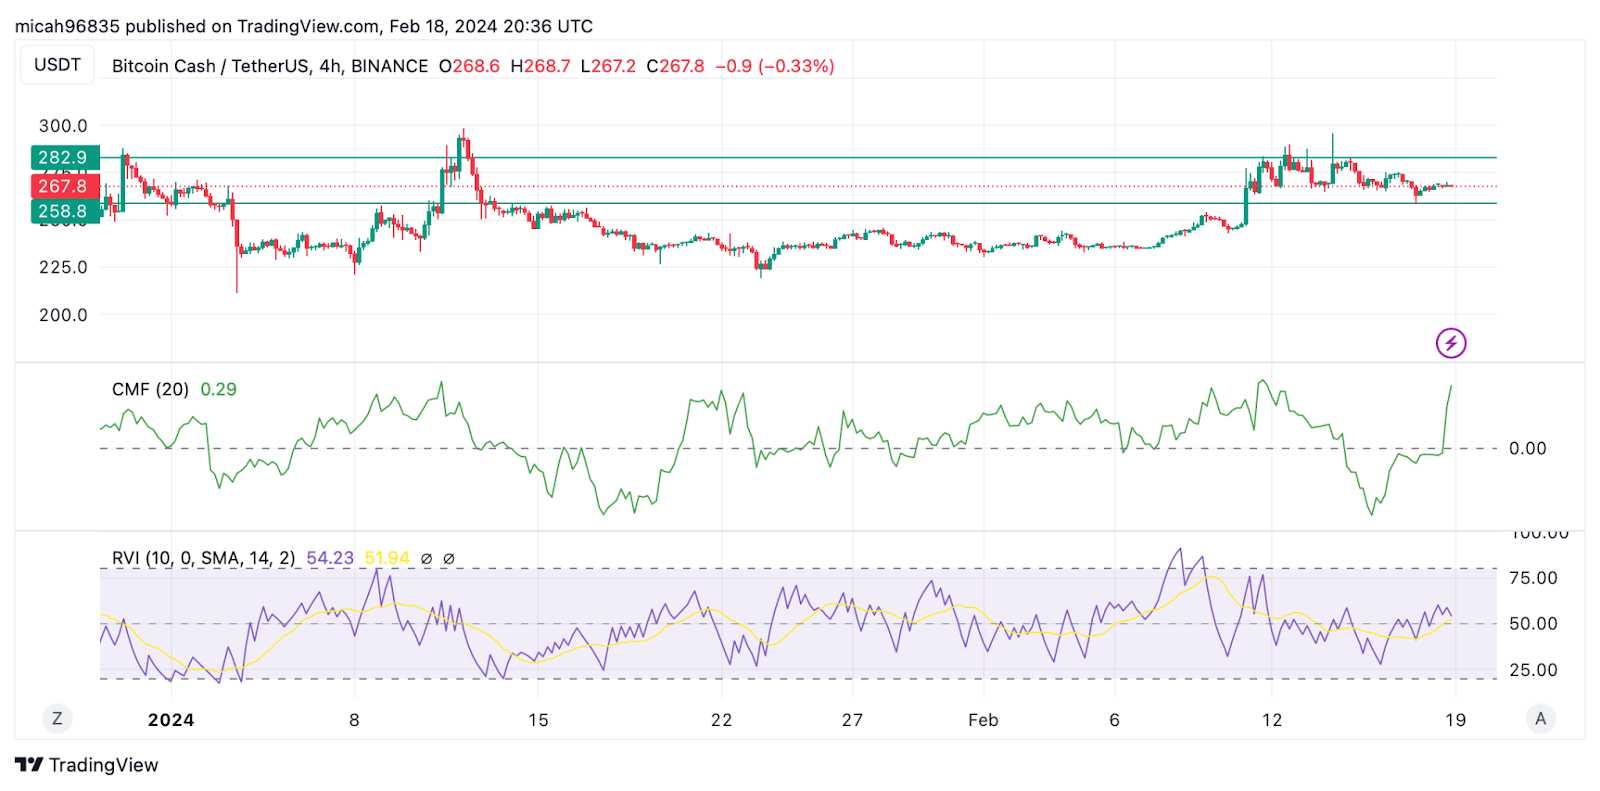
The 4-hour price chart of Bitcoin Cash (BCH) shows the cryptocurrency consolidating within a range of $258.8 to $282.9. The Chaikin Money Flow (CMF) is at 0.29 indicating buying pressure and potential bullish sentiment surrounding the security. Meanwhile, the Relative Volatility Index (RVI) at 52.39 points to average market volatility, aligning with the ongoing consolidation phase and providing no strong indication of a significant price movement in the near future.
Is BCH a good Investment?
Since its inception as a Bitcoin hard fork in 2017, BCH has been dedicated to enhancing transaction volume with faster speeds and decreased fees. The network has prioritized enhancements for scalability, security, and ease of use; adoption in e-commerce further proves the effectiveness of BCH as an exchange medium. Despite grappling with market fluctuations, competition, and the necessity for broader adoption rates, BCH has remained resilient and its current market capitalization surpasses $5 billion- solidifying it as the 19th most popular crypto. Does the resilience of BCH affirm its profitability? Our Bitcoin Cash price forecast section will examine the potential ROI for investors over the coming years.
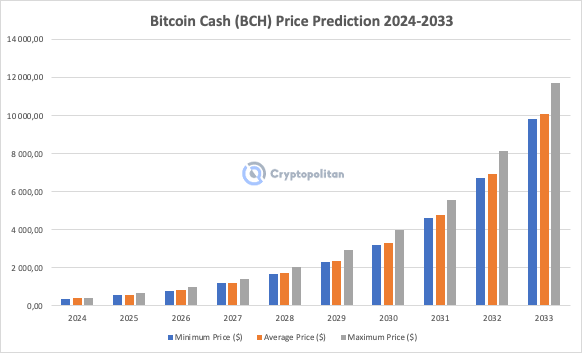
Bitcoin Cash Price Predictions 2024-2033
Price Predictions by Cryptopolitan
| Year | Minimum Price ($) | Average Price ($) | Maximum Price ($) |
| 2024 | 382.99 | 393.84 | 440.02 |
| 2025 | 552.46 | 572.16 | 665.72 |
| 2026 | 800.48 | 823.37 | 975.13 |
| 2027 | 1,187.00 | 1,220.00 | 1,407.00 |
| 2028 | 1,689.00 | 1,738.00 | 2,028.00 |
| 2029 | 2,296.00 | 2,383.00 | 2,917.00 |
| 2030 | 3,202.00 | 3,298.00 | 3,995.00 |
| 2031 | 4,627.00 | 4,792.00 | 5,563.00 |
| 2032 | 6,722.00 | 6,962.00 | 8,165.00 |
| 2033 | 9,837.00 | 10,116.00 | 11,712.00 |
Bitcoin Cash Price Prediction 2024
Our Bitcoin Cash price prediction for 2024 assumes a continuation of Bitcoin’s ascent, which coils see BCH reaching a maximum value of $440.02. We anticipate a minimum price of $382.99 and an average value of $393.84.
Bitcoin Cash Price Prediction 2025
According to the Bitcoin Cash price prediction for 2025, the maximum price of BCH is expected to reach $665.72. Investors can anticipate an average price of $572.16 and a minimum of $552.46.
Bitcoin Cash Price Prediction 2026
Per our Bitcoin Cash price prediction for 2026, the coin’s value could reach a maximum price of $975.13. Sustained upsides could see the coin maintain a minimum price of $800.48 and an average price of $823.37.
Bitcoin Cash Price Prediction 2027
Our Bitcoin Cash price prediction for 2027 projects a maximum value of $1,407.00. The average trading price of the coin could potentially remain above $1,200.00 with a floor price of $1,187.00.
Bitcoin Cash Price Prediction 2028
According to our Bitcoin Cash price prediction for 2028, the coin’s market price will reach a maximum value of $2,028.00. We anticipate that BCH’s price will be between a minimum of $1,689.00 and an average of $1,738.00.
Bitcoin Cash Price Prediction 2029
Our Bitcoin Cash price prediction for 2029 expects BCH to hit a maximum price of $2,917.00. The projected minimum and average prices for 2029 are $2,296.00 and $2,383.00, respectively.
Bitcoin Cash Price Prediction 2030
According to our Bitcoin Cash price prediction for 2030, BCH will reach a peak market value of $3,995.00. The minimum price estimate for BCH is $3,202.00, while the average price is $3,298.00.
Bitcoin Cash Price Prediction 2031
According to our Bitcoin Cash price prediction for 2031, the value of this cryptocurrency is expected to increase to a maximum of $5,563.00. Based on our price analysis, BCH’s expected minimum and average price will be $4,627.00 and $4,792.00, respectively.
Bitcoin Cash Price Prediction 2032
Our BCH price forecast for 2032 estimates a maximum price of $8,165.00 for the coin. Investors can anticipate the price of BCH to trade at a minimum price of $6,722.00 and an average price of $6,962.00.
Bitcoin Cash Price Prediction 2033
Our Bitcoin Cash price prediction for 2033 is a maximum of $11,712.00. Investors can expect the price of BCH to be around an average of $10,116.00 and a minimum of $9,837.00.
Wallet Investor Bitcoin Cash price prediction
According to Wallet Investor, the market price of Bitcoin Cash will fall to 157.936 USD by 2025, and a further price drop of 85% in 2026. Therefore, they do not consider the coin to be a good long-term investment.
Cryptopredictions.com Bitcoin Cash price prediction
Cryptropredictions.com forecasts a challenging short-term outlook for Bitcoin Cash (BCH), predicting a decline to a minimum of $169 and a maximum of $248 by the end of 2024. A brief recovery is expected in early 2025, with a peak price of $393.666, but a bearish trend is anticipated to bring prices down to a range of $175 – $256 in July and $179 – $264 by December. The predictions suggest a stabilization in 2026, followed by a bullish turnaround in 2027 with a maximum price of $289 and an average of $223. For 2028, a further increase is expected, with BCH potentially reaching a maximum price of $365 and an average of $293.
Digitalcoinprice Bitcoin Cash price prediction
By 2024, Bitcoin Cash prices could go anywhere from $242.02 to $589.21, according to Digitalcoinprice. They project a market price range of $1,036.63–$1,218.41 by 2027. In 2030, BCH is expected to soar past the $1,900 mark and reach a maximum value of $2,013.93, according to the predictions. Digitalcoinprice’s estimates place the price of Bitcoin Cash between $5,047.61 and $5,242.98 by the year 2033.
BCH Price Predictions by Industry Influencers
Cryptolean on YouTube is bullish on Bitcoin Cash, particularly as long as it continues trading above the key daily support level of $264. The analyst adds there is a high probability of further upside towards the $330 to $318 resistance zone. According to Cryptolean’s analysis, a bullish breakout above this resistance zone, along with a bullish weekly candle closure above $316, could propel BCH towards $374 in the coming weeks. Alternatively, he suggests that traders should consider bearish scenarios, noting that a failure to sustain price action above $264 could lead to a retracement towards $231.
BCH Price Overview
| Popularity | #19 | Market Cap | $5,280,695,543 |
| Price Change (24 hours) | 1.01% | Trading Volume (24 hours) | $167,710,829 |
| Price Change (7 days) | -3.26% | Circulating Supply | 19,645,581 BCH |
| All-time low (Dec, 2018) | $75.08 | All-time high (Dec, 2017) | $4,355.62 |
| Price from ATL | 258.89% | Price from ATH | -93.81% |
BCH Price History
Bitcoin Cash (BCH) has experienced substantial volatility in recent weeks. However, let’s analyze the historical performance of BCH over the past years. Looking at the long-term chart, we observe that during the bullish trend in 2017, the price of BCH surged to $4,000.
In the initial weeks of 2018, the BCH price declined significantly in correlation with Bitcoin’s price, finding support around the $600 level. Eventually, BCH managed to recover some of its losses and reached a temporary high of $1,800 over several days. However, during the latter half of 2018, market analysts predicted a complete crash, leading to a bearish Bitcoin Cash forecast. Consequently, by the end of 2018, BCH hit its lowest point at $62.
Following the low point in late 2018, Bitcoin Cash experienced a modest upward movement, establishing a consolidation range between $200 as support and $450 as resistance. This range persisted throughout the second half of 2019 and 2020, indicating a period of relative stability for BCH. Analyzing the technical chart for BCH over the past year, we can observe a bullish shift in price action. Towards the end of 2020, BCH broke through the resistance level around $36, signaling a positive momentum for the cryptocurrency.
The demand for Bitcoin Cash surged, resulting in a test of the $600 level for BCH/USD. However, the price retraced and revisited the previous resistance at $360, which now acted as a support level. After a period of consolidation, the cryptocurrency market reversed its direction and began an upward movement in February 2021. The bullish momentum continued for several weeks, leading to a new high of approximately $750. This higher high indicated a clear medium-term uptrend for Bitcoin Cash.
In May 2021, during the peak of the cryptocurrency market, Bitcoin Cash (BCH) surpassed the $1,200 mark. However, as the year progressed, BCH experienced a decline and fell below $500 by the end of 2021. The average price for 2022 was about $200. BCH started 2023 at $266.62 and closed the year at $225.22. Currently, Bitcoin Cash’s price is trading within the $250 to $270 range.
More on Bitcoin Cash
What is Bitcoin Cash?
Bitcoin Cash (BCH) is a cryptocurrency that emerged from a hard fork of Bitcoin in August 2017. The primary objective behind its creation was to address the scalability issues associated with Bitcoin, mainly its limited block size. Whereas Bitcoin has a 1 MB block size, Bitcoin Cash increased this to an initial 8 MB to facilitate more transactions per block, aiming to improve transaction speeds and reduce fees. This change was rooted in a long-standing debate within the Bitcoin community regarding how to scale the network to accommodate its growing user base and transaction volume.
As a separate entity from Bitcoin, Bitcoin Cash has its own blockchain and operates independently. It retains the original vision of Bitcoin as peer-to-peer electronic cash, with a focus on being a medium of exchange for daily transactions. Despite sharing many technical similarities with Bitcoin, including the same proof-of-work consensus mechanism and a supply cap of 21 million coins, Bitcoin Cash differentiates itself through its scalability solutions.
Since its inception, Bitcoin Cash has undergone several additional forks and updates to further enhance its network capabilities. However, like all cryptocurrencies, it faces volatility and differing opinions on its utility, adoption, and future potential.
What’s the difference between Bitcoin Cash and Bitcoin?
Like Bitcoin mining, the Bitcoin Cash network uses something called ASIC miners to validate network transactions in mining, with various Bitcoin miner pools distributed across the world.
Here are some differences between the two:
- Due to increased block size, BCH is harder to mine since it requires more energy per block.
- Additionally, BCH was the first of all cryptocurrencies to introduce and effectively test the Segregated Witness (SegWit) upgrade, which separates the transaction data to allow more transactions to be sent at once.
- Another advantage that BCH has over Bitcoin is developing smart contracts by using CashScrypt.
- Bitcoin Cash processes transactions more quickly and at a lower cost than Bitcoin because it requires less mining power to verify new blocks. This makes the system less secure than Bitcoin.
Conclusion
Bitcoin Cash is a highly rated cryptocurrency with proven market resilience. As a cryptocurrency with great fundamentals, Bitcoin Cash potentially could someday go to the moon again. But that will depend on the crypto market’s behavior in the coming months. The recent surge of Bitcoin (BTC) beyond the $50,000 level for the first time in September 2021 has led to speculations that there may be substantial gains awaiting Bitcoin Cash (BCH). With BTC currently on an upwards path, BCH could ride this momentum and attain unprecedented high values.
Despite the overall positive outlook of our Bitcoin Cash prediction, there are still several issues investors should consider. Regulation is a significant factor most experts agree affects cryptocurrency prices. Individuals considering this coin an investment option should do their own research and due diligence before engaging the market.