


WEEKLY CRYPTO PRICE ANALYSIS: BTC, ETH, BNB, XRP, SOL, ADA And DOGE

Weekly Crypto Price Analysis
- Weekly crypto price analysis reveals major coins have been trading at their lower levels for the past week.
- Bitcoin has been trading in bearish territory, hovering around $26,500 with a few spikes.
- The selling pressure on most other major coins has been quite significant for the past week.
Weekly crypto price analysis reveals that most cryptocurrencies have been trading around the support levels, with bearish momentum dominating the market. Bitcoin and most major altcoins are plummeting, but the charts suggest a recovery could be around the corner. The BTC has dropped below $45k after a considerable sell-off.
Ethereum (ETH) has been hit hard by the recent market downturn and is currently trading below $2,300 resitance level. The selling pressure on ETH has been significant, but it has found support at this level. The BNB token, the native cryptocurrency of the Binance exchange, has also been affected by the market downturn and is trading near $300.
In a volatile market, Solana’s price recently had a correction, retreating from a brief peak of $112 to a more limited range between $95 and $100. The currency’s rise over the last few months has been remarkable, notwithstanding recent consolidation. XRP, the sixth-largest cryptocurrency by market cap, has also been downward in the past few days, with bulls and bears fighting for control. Dogecoin (DOGE), the meme-inspired cryptocurrency, has also been experiencing a significant drop in its price, with a current value of around $0.07900 levels after bulls failed to maintain the $0.0800 resistance level. The Cardano (ADA) price has also steadily declined, breaking below the $0.5500 support level and trading at around $0.5159.
BTC/USD
Bitcoin price analysis shows that BTC has been trading in a bearish trend in the start of the week, with some bullish momentum seen at the start of the week. However, this was short-lived, as bears returned to the market later in the week. The BTC/USD pair currently trades around $43,557, with a 24-hour dip of -0.82%. The overall market sentiment for BTC is still bearish, with the key resistance level observed at $45k and support at $40k.

BTC/USD weekly chart, source: TradingView
BTC fell below the 20-EMA and the 50-EMA, indicating a strong bearish trend. The 50-EMA is also below the 200-EMA, with significant downward pressure. The MACD indicator indicates bearish divergence, with the MACD line remaining below the signal line. The Relative Strength Index (RSI) has also been trending upwards around the 70 levels, indicating a bullish trend for BTC in the near term.
ETH/USD
Ethereum price analysis shows that ETH has been trading below its key resistance level of $2,300 for the past few days. The second-largest cryptocurrency by market cap currently trades at around $2,220 with a 24-hour decrease of -0.78%. The bearish sentiment for ETH is still strong, with the key resistance level observed at $2,300 and support at $2,000. If bears continue to dominate, a further drop toward the $1,80000 level could be seen; however, if bulls manage to take control, ETH could see a push toward the $2,500 level.

ETH/USD weekly chart, source: TradingView
The MACD indicator shows bearish momentum as it has formed a negative crossover. The RSI is currently hovering near 62, suggesting that bears are slowly gaining market control. The 50-weekly MA is below the 200-weekly MA, indicating that the price will likely remain bearish soon. The moving averages have been in neutral territory, meaning ETH could consolidate before making its next move.
BNB/USD
The weekly price analysis for Binance Coin (BNB) reveals that bears have controlled the market for the past few days. BNB broke and closed below the symmetrical triangle pattern, signifying that bears prevailed over bulls. At the time of writing, BNB is trading at $318, with a minimal surge of 0.58% in the past 24 hours; however, in the past seven days, BNB has recorded a 5.26% loss. The market sentiment for BNB is still bearish, with the key resistance level observed at $330 and support at $290.

BNB/USD weekly chart, source: TradingView
The MACD and signal lines have crossed over in a bearish divergence, indicating that bears dominate the market and could continue to push the price down soon. The RSI is also currently trending in the neutral zone, suggesting that BNB could see further correction before a bullish trend emerges.
SOL/USD
The altcoin Solana (SOL) has been one of the top losses this week, with a price decrease of over 10% in the past seven days. SOL is currently trading at $100, with a 24-hour dip of 7%. The market sentiment for SOL is still bearish, with the key resistance level observed at $100 and support at $95. The coming week will be crucial for SOL, with bulls and bears fighting for control.

SOL/USD weekly chart, source: TradingView
The MACD indicator shows that bears dominate the market, with the signal line above the MACD line. The RSI is currently hovering around 71, indicating a bullish sentiment for SOL. However, if bulls push the price above $105, SOL could recover towards $110; however, if bears continue to dominate, a drop towards $95 could be seen. The 50-weekly MA is also below the 200-weekly MA, indicating that bears are now in market control.
XRP/USD
XRP price analysis shows that bears have controlled the market for most of the week, pushing the price to record lows. In the past seven days, XRP has seen a 10% loss in its value and is currently trading at $0.5559, with a 24-hour surge of -2%. After the SEC’s lawsuit against Ripple, the market sentiment for XRP has been bearish, with the key resistance level observed at $0.5800 and support at $0.500. The price of XRP is currently below the 200-EMA, indicating a strong bearish trend in the near future.

XRP/USD weekly chart, source: TradingView
The MACD indicator also shows that bears dominate, as the MACD line is below the signal line. The RSI has been trending down and is currently hovering around 30, which indicates a bearish trend for XRP. The 20-SMA is below the 50-SMA, indicating that the bears still control the market. If bulls push the price above the $0.555 level, XRP could recover towards $0.5800; however, if they fail, XRP could break further below its current support level.
DOGE/USD
Weekly crypto market price analysis for Dogecoin (DOGE) shows that bears have dominated the market, with DOGE trading below its crucial support level of $0.0800. The meme-inspired cryptocurrency currently trades at $0.07926, with a 24-hour surge of -4 % and a seven-day decrease of -12 %. The bears and bulls have been fighting for control, and the market sentiment is still bearish, with the key resistance level observed at $0.800 and support at $0.0700.

DOGE/USD weekly chart, source: TradingView
The moving averages show a strong bearish trend, with the 20-EMA below the 50-EMA and both below the 200-EMA. The MACD indicator also shows that bears are still in control, as the MACD line is below the signal line. The RSI has been trending down and is currently hovering around 51, indicating a bearish trend for DOGE. If bulls push the price above the $0.07800 level, DOGE could see a rally toward $0.0800; however, if bears continue to dominate, a further drop toward $0.0700 could be seen.
ADA/USD
According to the weekly price analysis, Cardano (ADA) has been trading within a range of $0.50-0.60 for the past week, with a light downward trend. The coin had briefly crossed above $0.5500, only to see it slipping back down again due to strong bearish pressure from the markets. At the time of writing, ADA is currently trading at around $0.5154, with the support of the coin being quite weak.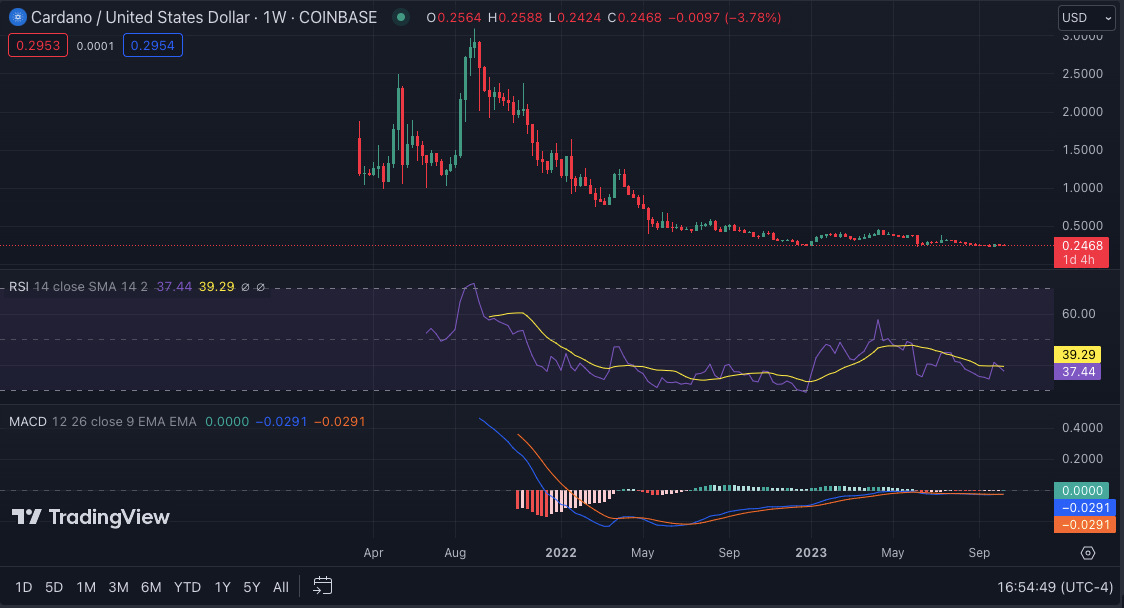
ADA/USD weekly chart, source: TradingView
The RSI is close to the 37 levels, indicating that selling pressure is increasing and that further losses could be in store for this currency. The MACD remains bearish, and a break below the $0.25000 support level could lead to further declines in the near term. The 20-EMA is moving below the 50-EMA, meaning bears dominate the market. The MACD is also in the red, indicating that bearish sentiment is strong.
Weekly Crypto Price Analysis Conclusion
In conclusion, despite some minor price surges in certain cryptocurrencies, overall bearish sentiment remains strong in the crypto market. Bulls must work hard to turn the tide and push prices back up, with many major coins trading below crucial support levels. Monitor key resistance levels and market trends for potential trading opportunities in the coming weeks.
Don’t just read crypto news. Understand it. Subscribe to our newsletter. It's free.


