Polkadot price analysis for today shows a strong bullish trend set that has seen the DOT/USD price jump to $6.33 and consolidates well above the key support level of $6.17. The market had been trading in a sideways channel for the past few days, but the bulls finally got the upper hand and pushed the price through a crucial resistance level of $6.34.
Polkadot price analysis shows the coin has been hovering around a range of $6.15-$6.34 for the past 24 hours with a trading volume of $248 million and a market cap of $7.39 billion which is however significantly low despite the increasing prices. Polkadot prices have sought firm support at the $6.17 price level and are currently bouncing back from it. The bulls will be looking to take the prices above the $6.34 resistance for a continuation of the bullish trend.
Polkadot price action on a 1-day price chart: DOT/USD prices continue to surge past $6.33
On the 1-day price chart for Polkadot price analysis, the bulls have established a strong presence in the market as the prices surged past the $6.33 level with an increase of 2.37%. The DOT/USD pair started the week with a strong bearish sentiment as the market traded sideways, however, today’s bullish movement has seen a shift in sentiment and the bulls are now firmly in control.

Looking at the indicator, the RSI is currently at 55.98 and is heading upwards which suggests that the bullish momentum is still present in the market and could see prices rise further. The Bollinger bands are also expanding which indicates that a volatile movement is likely in the near future. The upper Bollinger band is currently at $6.99 which could be the next target for the bulls., while the lower Bollinger band at $5.94 could act as support in case of a price pullback. The MACD indicator is on the bullish ground and the histogram is widening which is a sign of increasing market participation.
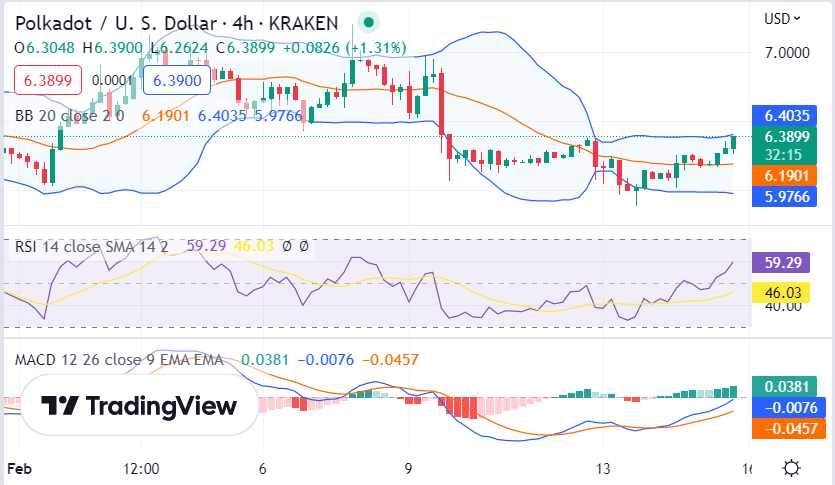
Polkadot price action on a 4-hour chart: Latest updates
The 4-hour Polkadot price analysis shows that the price made higher highs and higher lows, which is a bullish trend. The cryptocurrency has now broken out of the descending channel that it was trading in since the previous day. The breakout is a positive development and indicates that the bulls are in control of the market.

The RSI indicator is currently in the overbought region above the 46.03 level but is still climbing indicating that there is room for further price appreciation. The MACD indicator is also looking bullish as the red line is above the blue line and the histogram has widened which signals that there could be more bullish pressure on DOT prices in the future. The Fibonacci retracement level is also indicating a bullish environment as the price has broken through the 23.6% level and is heading towards the 38.2% Fibo level. The Bollinger bands on the 4-hour chart are also expanding which is a sign of increased market volatility.
Polkadot price analysis conclusion
Overall, the latest Polkadot price analysis shows that the bulls are firmly in control of the market and prices could move higher in the near future. However, as long as the market continues to remain bullish, DOT could reach new all-time highs. The resistance level at $6.34 could be the bull’s next target, while the support level at $6.17 should continue to act as a cushion in case of a price pullback.


