Harmony Price Prediction 2023-2032
- ONE Price Prediction 2023 – up to $0.031
- ONE Price Prediction 2026 – up to $0.093
- ONE Price Prediction 2029 – up to $0.29
- ONE Price Prediction 2032 – up to $0.89
Harmony One is keying into market potentials and key trends. The likes of DeFi, NFT, and bridges are all discussed together with Web3 economy and infrastructure. Since then, Harmony has upgraded the Harmony LayerZero bridge to allow the bridging of 7 previously unaffected tokens that bridge to the Binance Smart Chain side including the BEP20 versions of DAI, USDC, USDT, CAKE, ETH, ADA, WND.
For 2023, Harmony’s new buy page makes it easier than ever to get started with ONE token. Enjoy lower fees and a simplified experience. Harmony Protocol is excited to announce our development plans for 2023, which are focused on improving the scalability, decentralization, and usability of our protocol. Read them all in this report.
You may recall that Harmony was the first blockchain to combine Proof-of-stake and sharding. Sharding is the ideal scalability solution: it distributes data across multiple machines in a way that preserves both security and decentralization. Learn more about the current developments to stay warm during Crypto winter, and meet top experts, builders, web3 enthusiasts, entrepreneurs, and investors. Lunch & drinks to be provided.
In the current exchange brouhaha, you are teetering on the edge of uncertainty; this is why we are updating this guide to help you evaluate ONE for your investment portfolio. But first, let’s know more about Harmony (ONE). A friendly reminder, if you’re interested in a particular cryptocurrency, do your research and be open-minded.
How much is ONE worth?
Today’s Harmony price is $0.020871 with a 24-hour trading volume of $15,841,493. Harmony is up 0.66% in the last 24 hours. The current CoinMarketCap ranking is #130, with a live market cap of $275,584,709. It has a circulating supply of 13,204,159,944 ONE coins and the max. supply is not available.
Read also:
- Harmony Staking: How to Earn Rewards
- Harmony Horizon bridge loses $100M due to hack
- Harmony price analysis: Harmony ONE towards new discoveries as bullish momentum inflates to $0.315
What is Harmony (ONE)?
Harmony (ONE) is a decentralized blockchain platform created to bridge the gap between scalability and decentralization. The cryptocurrency development focused on sharing data and creating marketplaces of any fungible token and non-fungible assets.
Harmony has invested heavily in its blockchain, with high incentives for developers on the blockchain. Harmony is setting a pace revolutionizing the way they conduct business by ensuring equality and trust in a world filled with inequalities.
With Harmony One, you can earn compound interest by staking for over 10% and compounding your rewards. The project is also currently working on getting rewards up to 20%.
Harmony One has a 300 million grant program accelerating development in our ecosystem. We just secured a partnership with AAVE and are close to finishing a vote to secure a partnership with CURVE. Curve and AAVE have the 2 highest total values locked in the crypto space. Combine that with our Bitcoin bridge that’s launching soon, and you have even more liquidity that can flow into the Harmony ecosystem to take advantage of DeFi products.
The developments will bear fruit in the long term as more use cases continue to emerge in the blockchain space. Harmony is already invested in the metaverse, NFTs, and gaming sectors.
Cryptocurrency for Millenials
Harmony ONE might be the cryptocurrency for Millenials after solving the delicate balance of decentralization and scalability. Harmony proposes the following:
- Remove the barriers preventing cryptocurrencies from being real digital money, which is all about the scaling problem faced by coins like Bitcoin. The increased popularity bitcoin faced brought about a cost increase in how the payment system is used. This problem is solved by implementing a deep sharding protocol covering transaction validation, network communication, and blockchain.
- Set Harmony apart from other blockchain solutions by getting a greater transaction throughput than before, which forces the blockchain solutions to achieve performance gains by sacrificing other features.
Characteristics of Harmony (ONE)
After having a look at what the aims and objectives of the harmony project are, let us take a look at some characteristics of harmony cryptocurrency;
- One important characteristic of Harmony ONE is its scalability.
- Harmony’s sharding system is highly dependable because of its distributed randomness generation (DRG) infrastructure, which is scalable, verifiable, and unbiased.
- Harmony is related to Proof-of-stake, making it energy efficient and dependable. Also, the Consensus has a linearly scalable BFT approach which is a hundred times faster than PBFTs.
- Harmony (ONE) has an adaptive thresholded Proof-of-Stake system.
- Harmony supports dependable cross-shard contracts that can completely communicate directly with each other.
- Harmony also supports a scalable networking infrastructure.
Harmony (One) ensures the crypto space has a dependable blockchain system to boost its protocol and network layers. Harmony (ONE) also allows systems that were not viable on blockchain before, including high-volume decentralized exchanges, interactive fair games, visa-scale payment processes, and IoT transactions. All things considered; Harmony aims at creating an appropriate environment.
You have learned basically everything about Harmony. How beneficial will the token be now and in the future? Let us check out the harmony price analysis and price prediction together.
Harmony Overview
[mcrypto id=”141280″]
Harmony ONE staking reward
There are a number of reasons why Harmony ONE staking is growing in popularity. Some of the key reasons include:
- This blockchain has a high degree of scalability, allowing for the transfer of data and value between shards.
- The platform uses an energy-efficient consensus mechanism, making it a great choice for those who want to participate in staking to earn staking rewards
- It is safe, thanks to its use of the Byzantine Fault Tolerance protocol.
- This token has an incentivized node program that rewards harmony staking users for running nodes. This makes it a great choice for those who want to participate in staking and help secure the blockchain.
- It is compatible with Ethereum, making it a great choice for those who want to build DApps.
- It is fast, thanks to its use of the FBFT consensus algorithm. Transactions are confirmed in as little as two seconds.
- It is efficient, thanks to its use of an aggregate signature to sign transactions minus the validator fee on the frontier wallet.
How much can I earn with Staking?
For long-term holders, Harmony ONE staking is an ideal strategy since the coin might increase its value in a couple of years; at current market prices, staking 10000 ONE would return $196.
This is not financial advice; just letting you know some scenarios and how Harmony ONE staking could work. You should research more about ONE and its applications.
Harmony Price History
Harmony (ONE) started the year at $0.042 and surged to a then-high of $0.2233 on 29 March 2021. That’s a rise of $5,216%. In April 2021, ONE experienced massive price swings, falling from its March high to $0.0850 on 23 April 2021, losing 61% of its value.
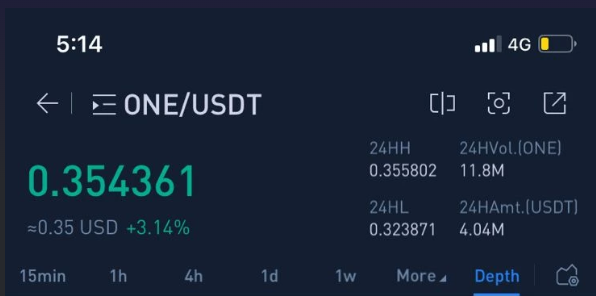
When the price crashed from 37 cents to 32 cents 5 months ago, many people panic-sold. What they didn’t look at was the depth chart. A huge buy wall and very low sell volume brought the price down. The next day, the price was back up again to 35 cents, and there was a huge sell volume and very small buy volume.

This is how whales and bots manipulate this market and paper hands fold. Before panic-selling your crypto, look at what is going on in the depth charts.
Why does this happen, and what does it mean? Here’s a toned-down explanation from a lengthy one:
- You want to buy 10M in bitcoin (or some other asset). If you just put buy orders, you will cause an increase in price which will make it more expensive for you.
- Instead, you spend a smaller amount (in this example 1M) to buy in small increments at market price. It may move the price up a bit but not as much.
- Once you have 1M worth of crypto, you put in one big fat sell order (the wall). You hope this will scare the market, as it looks like some big player knows something bad is about to happen and wants to urgently sell before it’s too late. You don’t really intend to sell, you just put the order to create panic. If the market doesn’t take the bait and they start buying from you, you simply cancel the order and maybe try again sometime later.
- People that misread the wall and want to sell, have to offer a lower price (they undercut you). Otherwise, they would have to wait until you sold all your 1M.
- You buy from them. You keep buying from them until there are no more people willing to undercut your wall. This way you can buy the rest of the 10M you wanted to buy originally, but the price never goes over the price of your sell order (the wall).
- Once you bought all you wanted to buy, or when there are no more sellers undercutting you and buyers start buying from your wall, you cancel the sell order.
In essence, you put large sell orders, not to sell, but as a way to ensure the price won’t increase while you buy from people scared of what the wall implies.
The same mechanism works the other way. When you want to sell, you put a buy wall and sell to those who want to buy, thinking it’s a bull market.
A lesson in crypto: DON’T PANIC SELL. CHECK THE DEPTH CHART. HODL.
New Developments in the Harmony Network
Harmony announced that the creation of 1.country, the world’s first platform that connects a web3 name with a browsable web2 domain; thus, unifying digital identity.
https://t.co/FLWErBi4k6 💙
— Harmony 💙 (@harmonyprotocol) March 21, 2023
Say hello to the world's 1st platform that connects a Web3 name with a browsable Web2 domain, unifying your digital identity. 🌎
(6+ character domains NOW AVAILABLE) 🔥https://t.co/PXimvIl4Hp
Furthermore, Harmony ONE network also announced the launch of Timeless, a social wallet for the Harmony community.
Timeless, a social wallet for the Harmony community
— Harmony 💙 (@harmonyprotocol) March 17, 2023
Built by former Google design and product leaders in collaboration with Harmony and its community, @timelesswallet is a non-custodial wallet with an intuitive user interface and beautiful generative profiles. https://t.co/rxEKKIidDi
Harmony Technical Analysis

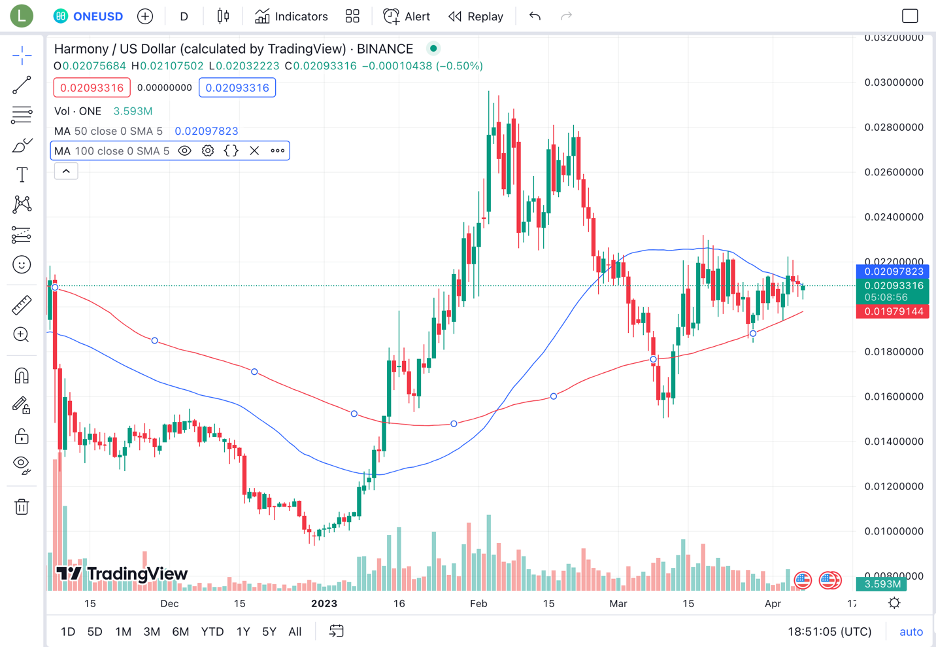
ONE’s current sentiment is bearish; the coin’s Fear&Greed index shows 64 (Greed). Harmony is currently trading above the 200-day simple moving average (SMA). The 200-day SMA has been signaling BUY for the last 25 days, since Mar 13, 2023.
The price of Harmony is currently above the 50-day SMA and this indicator has been signaling BUY for the last 0 days, since Apr 07, 2023.
The Relative Strength Index (RSI) momentum oscillator is a popular indicator that signals whether a cryptocurrency is oversold (below 30) or overbought (above 70). Currently, the RSI value is at 50.78, which indicates that the ONE market is in a neutral position.
Harmony Price Predictions by Cryptopolitan


Harmony Price Prediction 2023
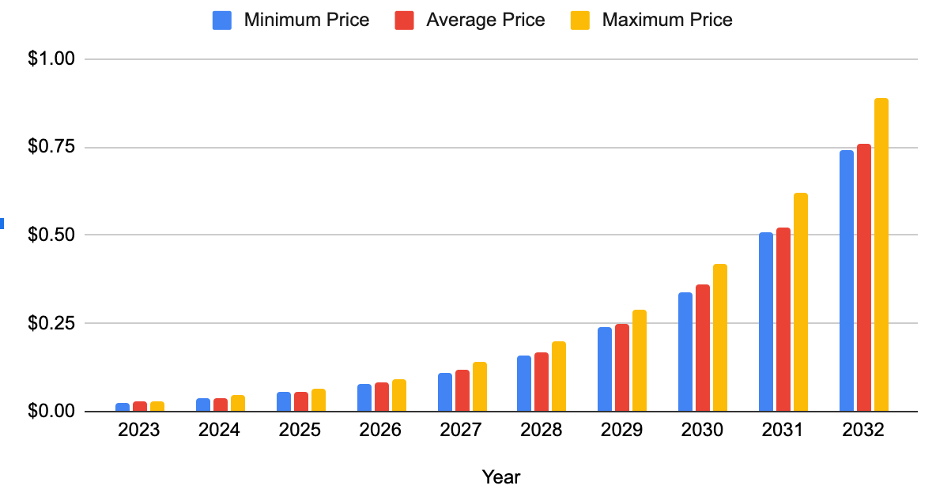
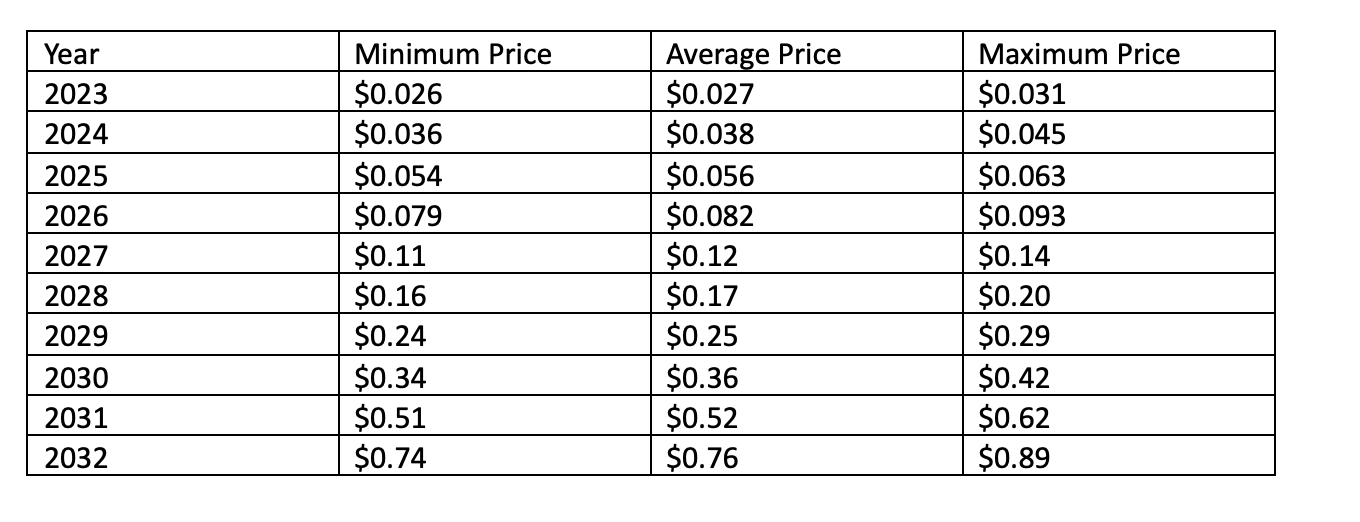
According to our Harmony price prediction for 2023, we predict an overall bullish trend leading to a maximum ONE price of $0.031, indicating a significant gain on the current price. Furthermore, we also anticipate a minimum price level of $0.026 and an average trading value of $0.027. We also anticipate that new developments and frequent updates could influence the price levels of Harmony ONE.
Harmony Price Prediction 2024
Our Harmony price prediction for 2024 is a maximum of $0.045. Also, investors can expect an average value of $0.038, with its lowest possible price at $0.036. 2024 is expected to be a good year for ONE, and much potential for bullish movement is expected.
Harmony Price Prediction 2025
Our Harmony coin price prediction for 2025 anticipates ONE to reach a maximum price of $0.063 by the end of the year. A minimum price of $0.054 and an average forecast price of $0.056 are expected. With a higher adoption of blockchain-based applications in the future, ONE price could see an enormous increase in value.
Harmony Price Prediction 2026
Our Harmony price forecasts is anticipated to have an overall bullish market based on our ONE price prediction for 2026, leading to a rise in maximum price to $0.093 and a minimum price of $0.079, respectively. An average market price of $0.082 is expected. Crypto volatility and market restrictions are forces that lead to these low prices.
Harmony Price Prediction 2027
According to our Harmony Price Prediction for 2027, ONE is expected to reach a maximum price of $0.14. Throughout the year, ONE is assumed to maintain an average price of $0.12 and a minimum value of $0.11. Due to reduced fees, transparency, security, and faster transactions, ONE could witness a surge in price.
Harmony Price Prediction 2028
Based on our Harmony price prediction for 2028, ONE is expected to have a maximum price of $0.20. The coin’s lowest price is expected to be $0.16, while the average price is expected to be $0.17.
Harmony Price Prediction 2029
According to our Harmony price prediction for 2029, the coin is expected to trade at a maximum price of $0.29, indicating an increase in the current price of up to a significant amount. The cryptocurrency is expected to maintain an average trading price of $0.25 and a minimum price of $0.24 throughout the year.
Harmony Price Prediction 2030
According to our Harmony price prediction for 2030, ONE is predicted to attain a maximum price of $0.42, showing a significant price increase. We also anticipate a substantial increase in the price support level leading to a minimum price of $0.35 and an average market price of $0.36. Even though our Harmony long-term forecasts are more optimistic, the ONE token price prediction for 2030 anticipates considerable volatility.
Harmony Price Prediction 2031
Our Harmony One price prediction for 2031 says that ONE will reach a maximum price of $0.62. The price indicates a significant increase in the current market price. We expect the coin to reach an average price of $0.52, and a minimum price of $0.51 is expected. It is essential to know that the cryptocurrency has huge potential to attract many users, which might also positively affect the price.
Harmony Price Prediction 2032
Our Harmony token price prediction for 2032 indicates that ONE investors will make significant gains since the cryptocurrency may reach a peak price of $0.89. Also, it is anticipated that ONE will have a minimum price of $0.75 and an average price of $0.76. Reduced fees, more security, and speedy transactions may cause Harmony’s price to increase.
Harmony Price Prediction by Wallet Investor
Wallet Investor predicts that Harmony is a bad long-term investment. In one year, they predict that the coin will be worth $0.00155. They expect the ONE coin to devalue in five years by 96.826%.
Harmony Price Prediction by Cryptopredictions.com
According to Cryptopredictions.com, Harmony ONE is expected to have a maximum price of $0.0010, with an average trading price of $0.000813 by the end of 2023. By that time, the lowest trading price of the coin is expected to be $0.000369.
By 2025, ONE is expected to reach a maximum trading price of $0.0018, with an average trading price of $0.0014. The lowest trading price of the coin by then is expected to be $0.0012.
Furthermore, ONE is predicted to have a maximum trading price of $0.0857, according to Cryptopredictions–with an average trading price of $0.0686 in 2026. The coin’s lowest price is expected to be $0.0583 by then.
By 2026, ONE is expected to have a maximum and minimum price of $0.002 and $0.001, respectively. The average trading price of the coin is expected to be $0.0016 by then.
Harmony Price Predictions by Digital Coin Price
Digital Coin Price expects Harmony to reach a maximum price of $0.0454 and a minimum price of $0.0185 by 2023. By 2028, the coin is predicted to have a maximum price of $0.11 with a minimum price of $0.0984
By 2032 Harmony ONE is predicted to have a maximum price of $0.40 with a minimum price of $0.39.
Harmony Price Predictions by Coincodex
According to Coincodex, the value of Harmony is expected to reach $0.0132 in six months. In one year, they predict that the coin will reach a maximum price of $0.241. Coincodex also predicted the price of ONE based on technology trends. According to them, they expect ONE to reach $0.0627 by 2026 if it follows the Internet growth.
They also expect the coin to reach $0.134 if it follows Google’s growth and $0.546 if it follows Facebook’s growth.
Harmony Price Prediction by Industry Influencers
Harmony blockchain provides seamless interactions for game developers; below is a short clip from rocket monsters universe, a play-to-earn game built on Unreal Engine 5.
Warning: This is in a completely early development stage. Animations, sounds and vfx or not finalized
— Rocket Monsters (@MonstersRocket) May 15, 2022
*Raw Footage
When we are finished though, we will have a Blockchain shooter like no other!
Sound on! @harmonyprotocol #HarmonyONE #UnrealEngine5 #RocketMonsters $ONE $BEAR pic.twitter.com/lTBuzoaLbV
Harmony, from its all-time high, is down by more than 90% — meaning that we might have seen the low for the bear market, and there are chances that soon we might see a reversal to the upper side. Industry Expert @Teshkid FX stated that there might see ONE increase in price. According to their ONE price prediction, they expect the coin to surpass its all-time high and reach new heights.
Conclusion
Harmony, a blockchain platform with the potential to revolutionize cross-chain interoperability and scalability, is set to take the industry by storm. With its energy-efficient consensus mechanism and low gas fees, it has all the hallmarks of a long-term success story. Potential investors should bear in mind that cryptocurrencies are a volatile market, and any value changes could occur without warning. As such, it is essential to do your research before investing in Harmony or any other crypto asset.


