


Key takeaways:
- The average Sonic price prediction for 2026 is $0.03789.
- Holders can anticipate a maximum price of $0.1574 in 2029.
- By 2032, Sonic (S) might touch $0.2967
Sonic is a high-performance EVM Layer 1 blockchain for DeFi applications, offering sub-second finality and high-speed transactions. Formerly called Fantom, the project rebranded itself to Sonic in 2024, after its mainnet launch, and subsequently grew its partnerships with Chainlink, Pyth Network, Alchemy, and Safe.
Recently, Sonic has been expanding its ecosystem, integrating stablecoins, upgrading infrastructure, and enhancing security features. The network also noted growing adoption of its vertical integration model, while Sonic Labs unveiled a new leadership team with Matt Visser as its new Chief Executive Officer after the resignation of its founding board members.
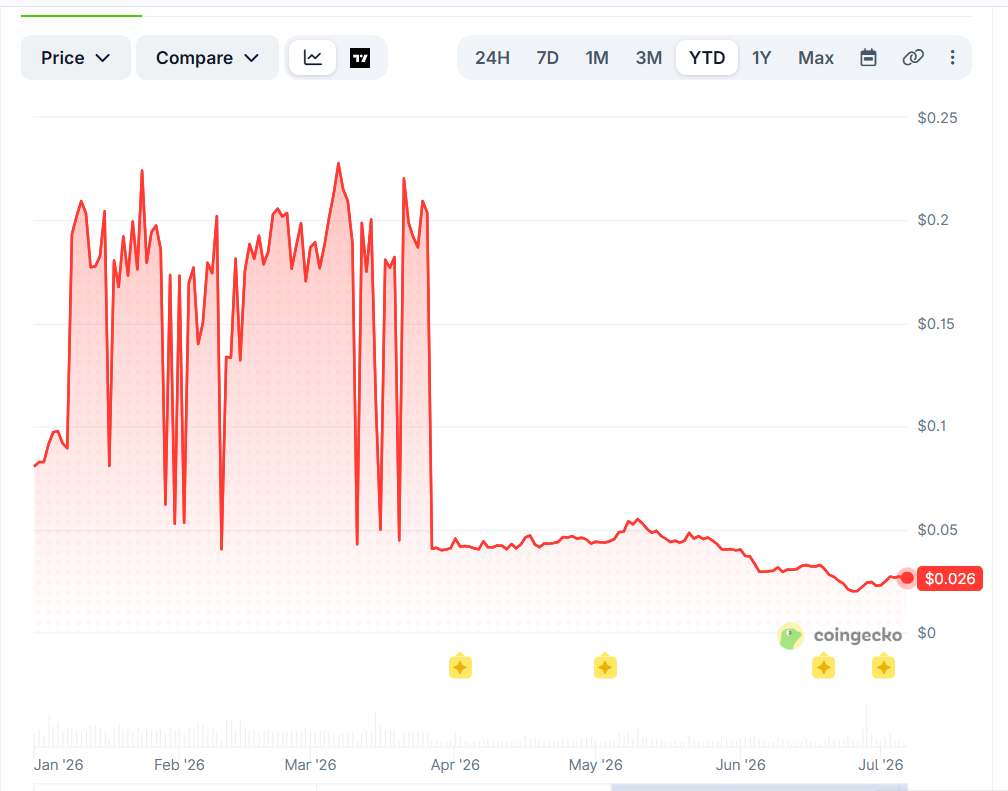
After reaching its all-time high of $1.03 in January 2025, it hit a low of $0.02768 in June 2026. Traders have been keeping a close eye on the project’s recovery efforts, and it’s unclear just how high Sonic can go in the years ahead.
Let’s dive into the Sonic price prediction and technical analysis.
Sonic Price Prediction: An Overview
| Cryptocurrency | Sonic |
|---|---|
| Token | S |
| Price | $0.02815 |
| Market Cap | $72.47 million |
| Trading Volume (24-hour) | $5.73 million |
| Circulating Supply | 2.88B S |
| All-time High | Jan 05, 2025: $1.03 |
| All-time Low | Jun 25, 2026 $0.01915 |
| 24-h High | $0.02815 |
| 24-h Low | $0.02815 |
Sonic (S) price prediction: Technical analysis
| Volatility | 13.84% (Very High) |
|---|---|
| 50-Day SMA | $0.03331 |
| Price Prediction | $0.02021 (-24.80%) |
| 14-Day RSI | 47.17 (Neutral) |
| Green Days | 18/30 (60%) |
| Sentiment | Bearish |
| Fear & Greed Index | 23 (Extreme Fear) |
| 200-Day SMA | $0.04912 |
Moving averages are commonly used indicators for Sonic’s price predictions, and this prediction suggests the current price remains below the estimated near-term target.
Sonic price analysis: S has fallen below the key support, and bears are back in control
- Today’s Sonic price analysis shows sellers regaining control after the recent recovery lost momentum.
- S is trading around $0.02815, down by 2.65% over the last 24 hours
- The immediate sonic resistance is at $0.0300, and support is seen at $0.0260
The price analysis for July 16, 2026, shows Sonic has returned to bearish momentum after failing to hold its recent gain. At the time of writing, Sonic is trading at $0.02815, which is the current high on the daily chart. This is a 2.65% decline over the past 24 hours. The latest price drop indicates that the buyers have lost momentum, allowing sellers to push the price back towards the key support levels.
Sonic (S) price analysis 1-day chart
Looking at the daily chart, Sonic faced rejection above the $0.0300 level, erasing part of his recent recovery. The latest red candles show that the sellers are back in control, keeping the overall downtrend intact.
The immediate resistance is around $0.0300. If the price goes above this level, it could improve the short-term sentiment, while failure to hold $0.0260 could trigger further losses towards the lower support levels.
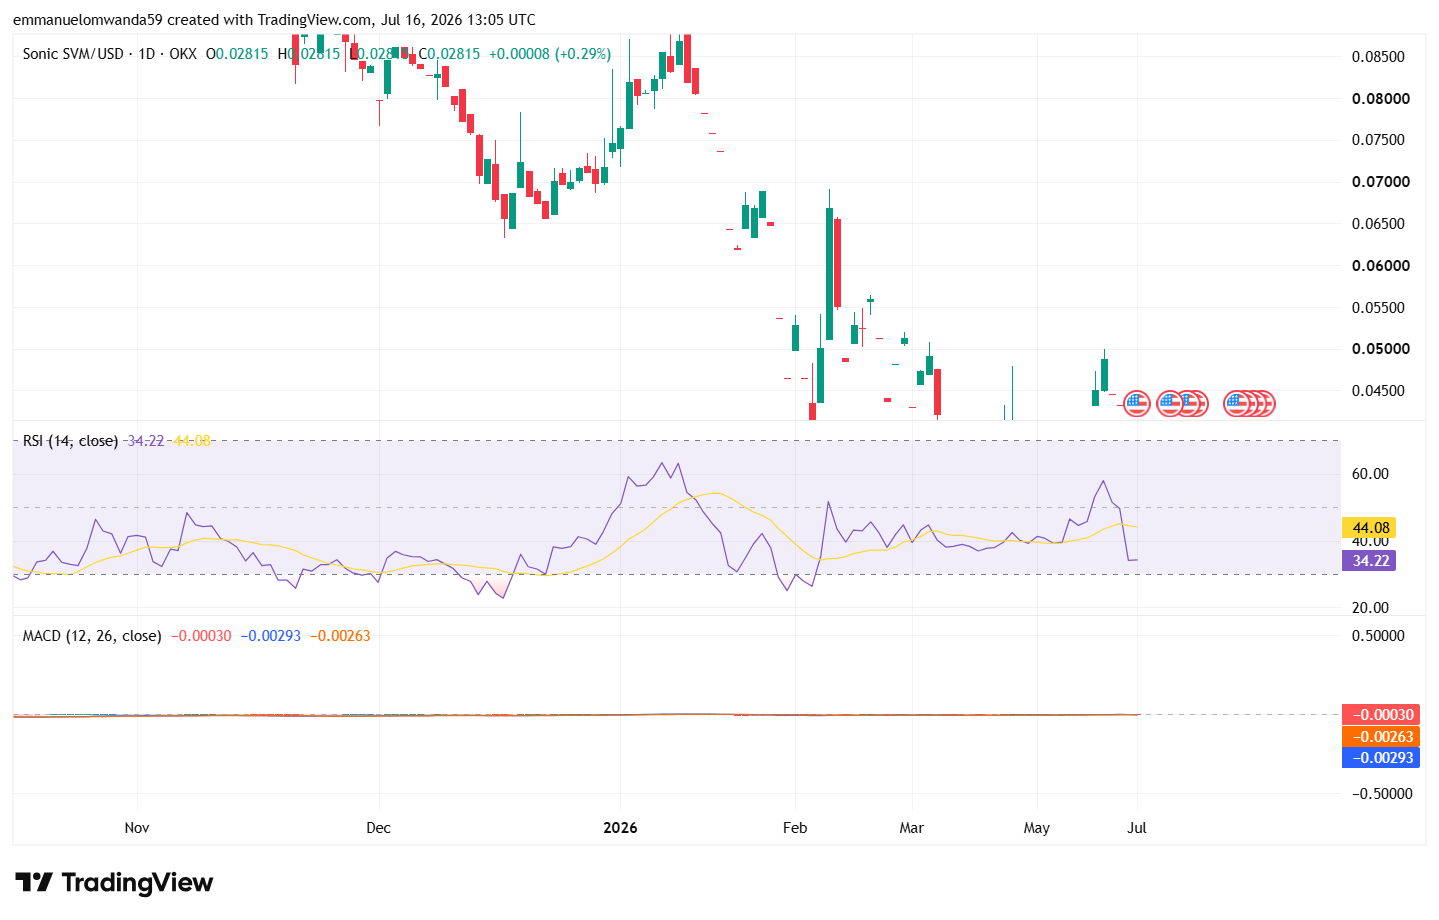
Trading activity weakened over the past 24 hours. The market cap has declined by 2.65% to $72.47 million, and the trading volume decreased by 34.27% to $5.73 million. The decline in the volume indicates that traders are becoming less active as the recent recovery has weakened.
The RSI on the daily chart has dropped to about 34, which is in the oversold zone, an indication of growing selling pressure. On the other hand, the MACD is still in negative territory and has not turned positive, making bearish momentum look very strong despite occasional recovery attempts.
S’s technical analysis 4-hour chart
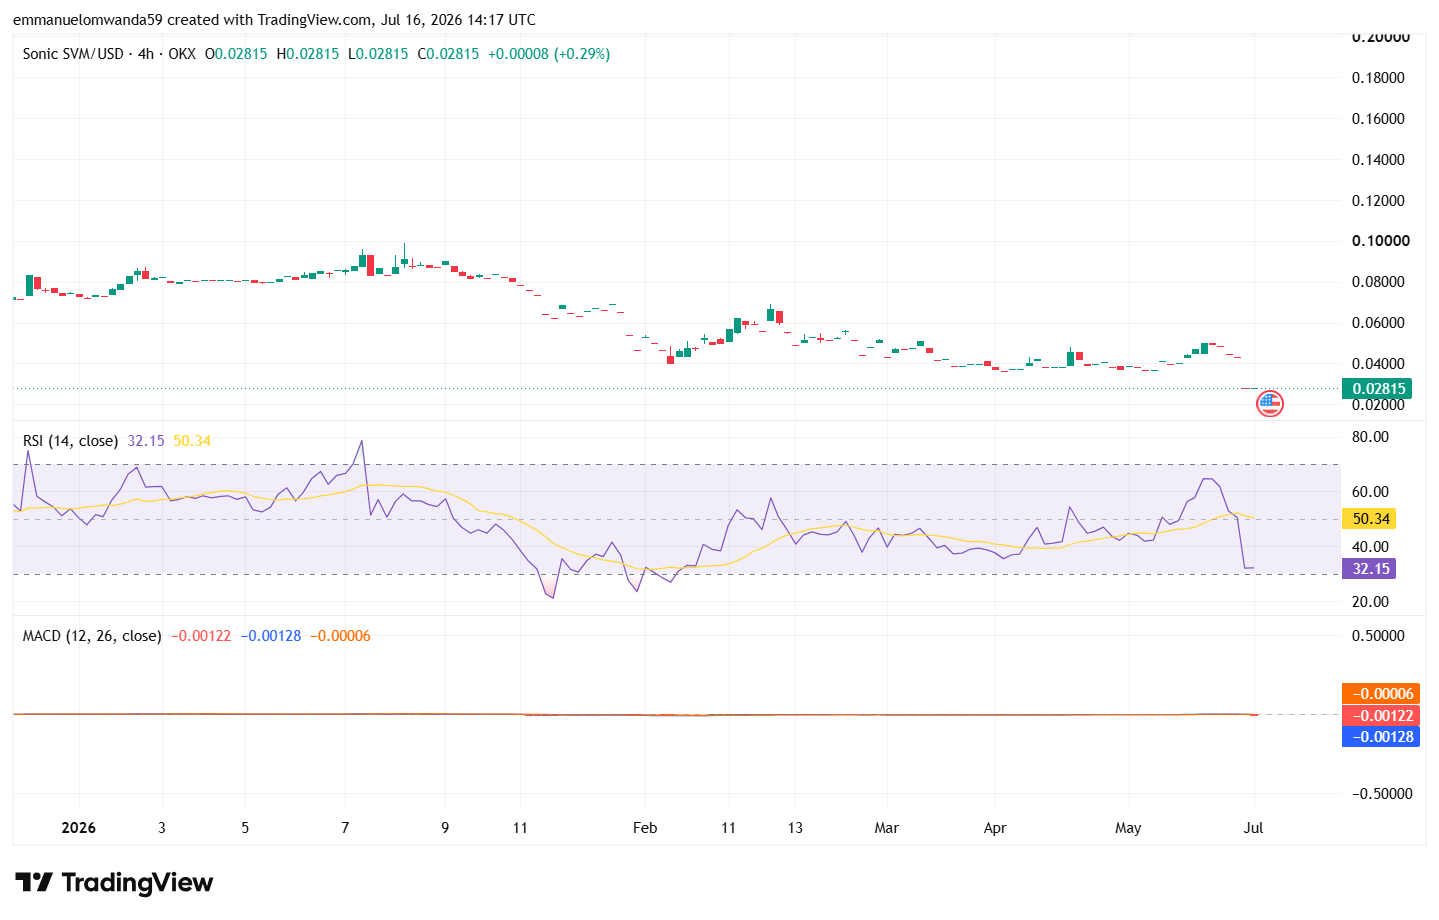
The Sonic 4-hour chart shows that sellers have taken control of the market after a recent recovery attempt. Short-term price action has remained weak, with buyers finding it difficult to hold higher levels; the token is trading around $0.02815 on the 4-hour timeframe. The immediate resistance is at $0.0300, and the nearest support is at $0.0260.
The RSI has declined significantly from its previous state, closing in on the oversold zone at 32.15. This shows increased selling pressure over the last few hours. The indicator suggests that bearish momentum is strengthening, although oversold conditions could attract buyers if support holds
The MACD remains bearish, and the MACD line is below the signal line. The overall short-term trend is bearish, but the histogram is starting to shrink, meaning that selling pressure has eased slightly. A move below $0.0260 could trigger another decline, while a break above $0.0300 would improve the chances of a stronger recovery.
Sonic technical indicators: Levels and action
Daily Simple Moving Average (SMA)
| Period | Value | Action |
|---|---|---|
| SMA 3 | $ 0.02628 | SELL |
| SMA 5 | $ 0.02491 | BUY |
| SMA 10 | $ 0.02358 | BUY |
| SMA 21 | $ 0.02634 | SELL |
| SMA 50 | $ 0.03331 | SELL |
| SMA 100 | $ 0.03855 | SELL |
| SMA 200 | $ 0.04912 | SELL |
Daily Exponential Moving Average (EMA)
| Period | Value | Action |
|---|---|---|
| EMA 3 | $ 0.02614 | SELL |
| EMA 5 | $ 0.02548 | BUY |
| EMA 10 | $ 0.02500 | BUY |
| EMA 21 | $ 0.02648 | SELL |
| EMA 50 | $ 0.03159 | SELL |
| EMA 100 | $ 0.03929 | SELL |
| EMA 200 | $ 0.07142 | SELL |
Candlestick charts provide detailed price action information for Sonic, with the closing price used alongside momentum indicators as an indication of trend strength; conversely, EMA signals can react faster than SMA signals.
What can you expect from the Sonic price analysis next?
Sonic appears to be recovering after its recent decline, but buyers still need to break above $0.0280 to confirm stronger momentum. Until then, the token may continue trading between $0.0230 and $0.0280 as the market searches for its next direction.
Why is Sonic down today?
Sonic is down today mainly because of a broader crypto market pullback, with investors turning more cautious as overall market sentiment remains in the “fear” zone. There has been no major Sonic-specific news driving the decline, and the token is mostly experiencing normal profit-taking after recent gains. The modest drop reflects wider market weakness rather than any change in Sonic’s fundamentals.
Is Sonic a good investment?
Sonic price prediction points to moderate upside rather than a near-term run to $10: the token could trade around $0.0281 in July 2026, reach a base-case $0.1215 by 2030, and climb as high as $0.2967 by 2032. For crypto investors, traders, and enthusiasts assessing whether S looks like a good buy, the key is to predict moves using a combination of technical indicators and fundamental factors, while remembering that macroeconomic trends such as inflation and regulatory developments can quickly change Sonic’s price.
Sonic is a high-speed, scalable blockchain platform that competes with established chains such as Solana and Ethereum L2s, positioning itself as a performance-focused chain within the blockchain ecosystem. This analysis looks at Sonic’s price outlook from 2026 to 2032, technical signals, historical sentiment, ecosystem and blockchain fundamentals, recent news, and the main investment risks that shape market direction. While Sonic does not currently lead the market, it maintains a credible, stable mid-tier position, but volatile Total Value Locked metrics and weak user retention, despite recent price rebounds, are an indication that execution risk remains. The Sonic (S) network is also transitioning from a community-driven layer-1 to a more structured corporate model, which investors should factor in before they invest. Own research and assessing personal risk tolerance are essential for anyone considering S as a potential investment opportunity.
Will Sonic reach $5?
The price of Sonic could reach $0.1215 by 2030, with price predictions suggesting a high of $0.1678. The base case scenario for Sonic’s price by 2030 is projected to be around $0.1215, with potential highs depending on market conditions. However, achieving this depends on market conditions, overall technical factors, and fundamental factors.
Will Sonic reach $10?
Based on our technical analysis of multiple technical quantitative indicators, S’s price projections for 2032 estimate a range, with Sonic expected to reach about $0.2967 but not approach double-digit prices within the next 6 years. A move to $10 is not guaranteed; even by 2046, Sonic is expected to reach $0.8797, still far below $10 and requiring over 25,386% upside to hit that mark.
Is Sonic a safe network?
Sonic is regarded as a secure blockchain platform whose architecture differs from traditional blockchains, using its unique Lachesis consensus mechanism to enable high-speed, scalable transactions.
Its directed acyclic graph approach helps deliver theoretical throughput of up to 10,000 transactions per second with finality in less than 500 milliseconds. However, as with any blockchain network, users should exercise caution, use official channels, and follow best security practices to protect their assets.
Does Sonic have a good, long-term future?
Sonic shows potential for a strong long-term future, with price predictions suggesting significant growth by 2030 and beyond. Analysts forecast prices could reach between $0.1215 and the highest prices at $0.1678, driven by its unique blockchain technology, increasing adoption in decentralized applications, support for app builders, and robust ecosystem growth.
Ecosystem growth, fueled by increased developer activity and more developers joining the platform, is crucial for Sonic’s long-term success. Total Value Locked (TVL) in dApps is a critical metric for long-term growth, reflecting real-world usage and platform strength, while on-chain activity is another key signal of fundamental health. Sonic’s ability to attract and retain users also matters for long-term growth. Sonic also continues airdrop campaigns and support for liquid staking tokens to help boost TVL and revenue generation.
Additionally, the Sonic ecosystem has established a $25 million fund to attract builders and improve user metrics, further supporting future expansion. Future ecosystem expansion may also benefit from plans to pursue a Spot ETF and private investment vehicles on Nasdaq, though the long-term impact remains uncertain. However, market volatility remains a concern.
Recent news/opinion on Sonic (prev. FTM)
Sonic Labs, the entity behind the Sonic blockchain, confirmed the resignation of its three founding board members: Andre Cronje, Michael Kong, and David Richardson. The company framed it as a structured handover to a new executive team, with Matt Visser appointed CEO. Visser emphasized a new era of “operational discipline” and incremental improvement, pledging transparent governance and a dedicated risk committee.
Sonic recently announced it would not issue an additional 47.625 million S tokens in 2026 as the project reviews the possibility of ending future supply increases entirely. The move could reduce dilution pressure on existing holders, although Sonic Labs stated that discussions around a permanent supply cap or revised tokenomics structure are still ongoing.
Sonic price prediction July 2026
The Sonic price prediction for July 2026 uses the current price as the reference point, with the price expected to trade between $0.0260 and $0.03020. The average price is projected to hover around $0.02810 as market sentiment, trading volume, and broader crypto market conditions continue influencing short-term price action. For the coming days and next week, the outlook remains estimated rather than certain, and any decrease below the projected range would weaken sentiment.
| Period | Potential Low ($) | Average Price ($) | Potential High ($) |
|---|---|---|---|
| Sonic (S) price prediction July 2026 | $0.0260 | $0.02810 | $0.03020 |
Sonic price prediction 2026
In 2026, Sonic (S) is expected to trade between $0.0250 and $0.03789, with an average price of around $0.03145. This suggests relatively stable price action throughout the year, with modest upside potential if ecosystem growth and market sentiment improve.
Some bullish forecasts also point to a possible $0.11 to $0.13 range in 2026, though this article’s core model remains more conservative.
| Period | Potential Low ($) | Average Price ($) | Potential High ($) |
|---|---|---|---|
| Sonic Price Prediction 2026 | $0.0250 | $0.03145 | $0.03789 |
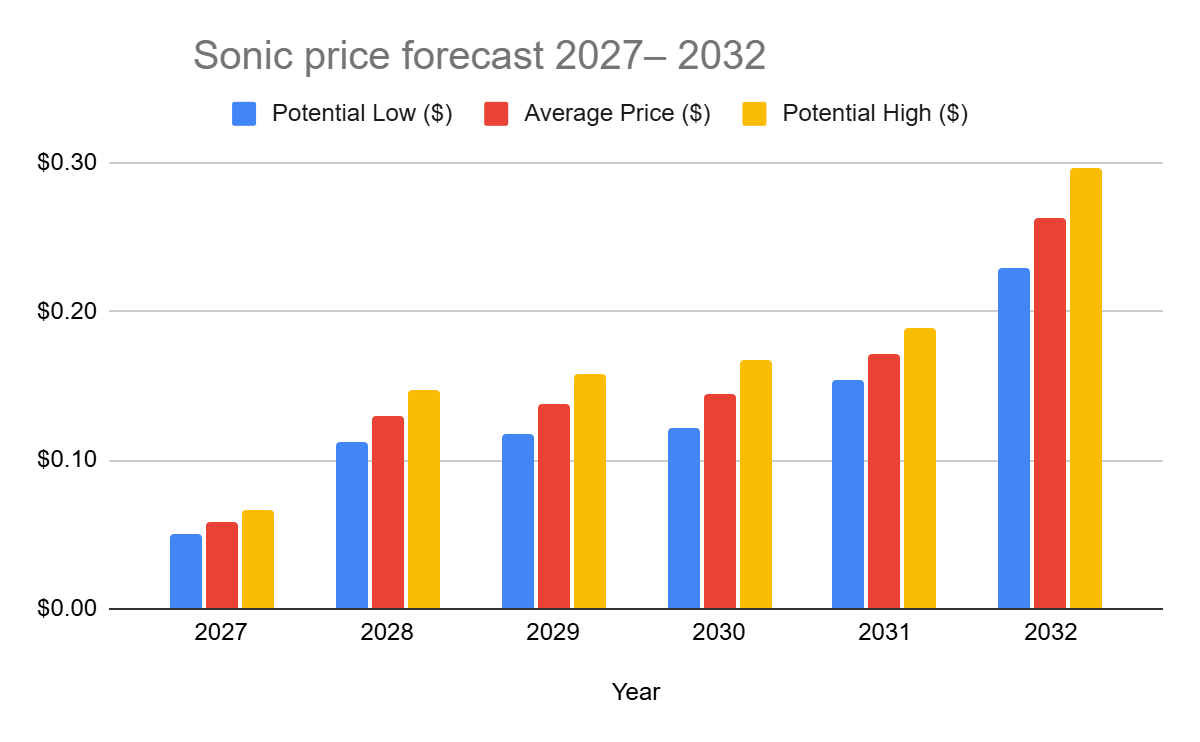
Sonic price forecast 2027–2032
| Year | Potential Low ($) | Average Price ($) | Potential High ($) |
| 2027 | $0.0499 | $0.0581 | $0.0662 |
| 2028 | $0.1128 | $0.1296 | $0.1465 |
| 2029 | $0.1169 | $0.1372 | $0.1574 |
| 2030 | $0.1215 | $0.1446 | $0.1678 |
| 2031 | $0.1545 | $0.1717 | $0.1889 |
| 2032 | $0.2285 | $0.2626 | $0.2967 |
Sonic (S) price prediction 2027
The Sonic forecast for 2027 speculates that the price might reach a maximum of $0.0662 by 2027. On the lower end, corrections may pull the price to $0.0499 with an expected average trading price of around $0.0581. As an alternate modeled scenario, the predicted price for 2027 could be around $0.03998, representing a potential 1.90% increase.
Sonic (S) price prediction 2028
Sonic’s (prev. FTM) 2028 forecast of $0.1128–$0.1465, averaging $0.1296, is linked to growing adoption of its rebranded ecosystem. By then, expanded DeFi, NFT, and gaming use cases are expected to strengthen utility and demand. The projected rise in Sonic’s price by 2028 is supported by its Fee Monetization model and the fee burning mechanism, which incentivize developer activity and reduce token supply. Network scalability upgrades and rising developer engagement support gradual appreciation, while market cycles keep growth within range.
Sonic (S) price prediction 2029
In 2029, Sonic’s market price might stabilize at $0.3238 while attaining an average trading price of around $0.2698, and a minimum price of around $0.2158. The broader outlook points to $0.03250 by the end of 2026, $0.1464 by 2030, and $0.2327 by 2040, based on combined technical and fundamental factors.
Sonic (S) price prediction 2030
Sonic is expected to reach a maximum of $0.1678 by 2030. A more conservative long-range model calculated from historical trends puts Sonic near $0.09969 by 2030 as an alternate scenario. However, it could fall to $0.1215 with an average price of $0.1446.
Sonic (S) price prediction 2031
Sonic is projected to hit a high of $0.1889 in 2031. Another projection places its 2031 range between $0.03445 and $0.1014. In the event of a price correction, it could drop to $0.1545 with an average of $0.1717, and reaching $0.1014 would imply a potential profit of about 291.26% from Sonic today.
Sonic (S) price prediction 2032
Sonic is expected to reach a high of $0.2967 in 2032. The average trading price is expected to be $0.2626, and the minimum price is projected to be $0.2285.
Sonic market price prediction: Analysts’ FTM price forecast
| Firm Name | 2026 | 2027 |
|---|---|---|
| Coincodex | $ 0.02589 | $ 0.06573 |
| DigitalCoinPrice | $ 0.03189 | $0.0817 |
A price prediction tool can help compare these third-party estimates with your own model, though outcomes still depend on user input and market assumptions.
Cryptopolitan’s Sonic (S) price prediction
Our predictions show that the Sonic token could achieve a minimum value of $0.0250 in 2026. The Sonic price may reach a maximum value of $0.03789, with an average trading price of $0.03145 throughout 2026. Investor confidence, along with supply and demand dynamics, plays a key role in Sonic’s price action, and macro conditions, regulatory changes, and investor decisions about whether to purchase or buy Sonic can also affect pricing.
Fundamental events such as hacks and other real-world occurrences can significantly impact price movements. Please note that the content provided on this page is for informational purposes only and does not constitute investment advice. No model can fully predict short-term moves tomorrow or next month. Conduct your own research before making financial decisions
Sonic’s (S) historic price sentiment
- Fantom (FTM) launched in 2018 at $0.0182, hit a low of $0.00229 in 2020, and peaked at $3.24 in 2021 during the DeFi boom.
- Following the 2022 bear market, FTM recovered to $0.55 by early 2024 before rebranding to Sonic Labs in August 2024.
- The 1:1 FTM-to-Sonic (S) token swap began in December 2024, with Binance completing it by January 2025.
- Sonic hit a new ATH of $1.029 in January 2025 but steadily declined to around $0.33 by late August.
- By early September 2025, Sonic traded stably between $0.3092 and $0.3126.
- Early September, Sonic traded around $0.309–$0.313, showing relative stability compared to its August lows.
- Mid-September – Price remained in the ~$0.30–$0.33 band, with minor upward drift toward ~$0.32.
- Sonic SVM traders often watch short-term support and resistance levels on the chart for potential short setups after sharp rebounds.
- Late September – The token approached $0.26, as reported by markets, showing a decline and increased volatility.
- Early October – Trading price dropped further into the ~$0.23–$0.26 range, indicating a weakening trend.
- By November 3, Sonic had fallen to approximately $0.122, marking a substantial decline from early September levels.
- At the beginning of November 2025, Sonic (S) traded around $0.12–$0.14, occasionally spiking to roughly $0.17 before retreating.
- Through mid-November, the price generally drifted downward, reaching a low near $0.10–$0.11 around November 21.
- From late November to December 3, S recovered slightly — trading in a narrow band around $0.10–$0.11, suggesting consolidation and stabilization after the mid-month slump.
- From early December, Sonic traded around $0.071–$0.075 on Dec 3–Dec 6, then moved higher through mid-December as the price climbed into the $0.085–$0.095 zone by Dec 14–Dec 17, reflecting increasing buying interest late in the year.
- Into late December and early January, S stabilized in the $0.07–$0.08 range before rising above $0.08, closing around $0.082–$0.086 by Jan 4 2026, showing a modest recovery into the new year.
- On January 4, 2026, Sonic was trading near $0.086–$0.090 after stabilizing from December weakness, with modest rebounds in the first week of January as buyers emerged off key support levels.
- By February 3, 2026, Sonic had drifted lower toward roughly $0.065–$0.070, reflecting continued selling pressure and failed rallies, with price consolidating near the low end of its recent range.
- Sonic (S) traded around $0.052 to $0.048 between Feb 3 and Feb 10, 2026, before declining toward the $0.041 to $0.039 range by late February amid steady selling pressure.
- From early March to Mar 14, 2026, Sonic moved between $0.038 and $0.044 with a gradual rebound attempt as the price stabilized near the $0.040 support zone.
- From March 14 to late March, Sonic drifted lower from $0.0514 toward $0.040–$0.042, unable to sustain any meaningful bounces amid broad market weakness.
- By April 7, its price pressed critical $0.040 support at $0.0396–$0.0414 — dangerously close to its all-time low of $0.0368 set on February 28.
- Sonic is trading at around $0.04951 at the start of May 2026.
- By the end of May 2026, Sonic had retreated to around $0.040, erasing much of its early-May gains after a failed rally above $0.055 and stabilizing near a key support zone amid continued selling pressure.
- By the last week of June, Sonic had recovered by 24.36% from its recent all-time low of $0.01915 on Jun. 25, 2026.
FAQs
How does the scalability of Sonic compare to Bitcoin?
The Sonic network is highly scalable, unlike Bitcoin, which is built on a rigid blockchain. Scalability means enterprises do not have to compromise speed and cost for more operations. Sonic can scale thousands of nodes with the capability of completing 1000 transactions in a second.
What's the future for Sonic (prev. FTM)?
Sonic blockchain offers real utility and has the potential to rival Ethereum. Blockchains like Sonic and Solana have been predicted to dominate the future of Web 3.0.
Disclaimer. The information provided is not trading advice. Cryptopolitan.com holds no liability for any investments made based on the information provided on this page. We strongly recommend independent research and/or consultation with a qualified professional before making any investment decision.

Emman Omwanda
Emmanuel Omwanda’s expertise lies in cryptocurrency markets, spanning both fundamental and technical analysis. He previously worked with various crypto media sites before joining Cryptopolitan, including CoinEdition, The Crypto Basic, CryptoNews Flash, and DroomDroom.He holds a Bachelor of Science (BSc.) in Mathematics and Computer Science from Kenyatta University, Kenya, and is currently in his final year pursuing a Bachelor of Arts in Communication and Media Studies.


