


Decentraland Price Prediction 2024-2033
- Decentraland Price Prediction 2024 – up to $1.07
- Decentraland Price Prediction 2027 – up to $3.17
- Decentraland Price Prediction 2030 – up to $9.71
- Decentraland Price Prediction 2033 – up to $31.58
Remember the crypto VR bubble? Is it all over yet? Well, maybe not!
Decentraland is a leader in this ecosystem, especially the play-to-earn (P2E) space. Its native token, MANA, has seen gains week after week, racking up 6% in the past week and 28% in the past 90 days. Can investors expect some more gains for MANA in the coming months?
Let’s find out.
How much is MANA worth?
Today’s Decentraland MANA price is $0.6741 with a 24-hour trading volume of $88,885,544. MANA is up 1.57% in the last 24 hours. The current CoinMarketCap ranking is #85, with a live market cap of $1,286,534,878. It has a circulating supply of 1,908,319,865 MANA coins and a total supply of 2,193,179,327 MANA coins.
MANA Price Analysis: Resistance and Support Zones in Focus Amidst Market Consolidation
TL;DR Breakdown
- MANA aims for a $0.7 breakout
- Decentraland’s MANA resistance present at $0.6853
- Immediate support is present at $0.6524
MANA Price Analysis 4-hour chart: MANA to break above $0.6853 resistance level?
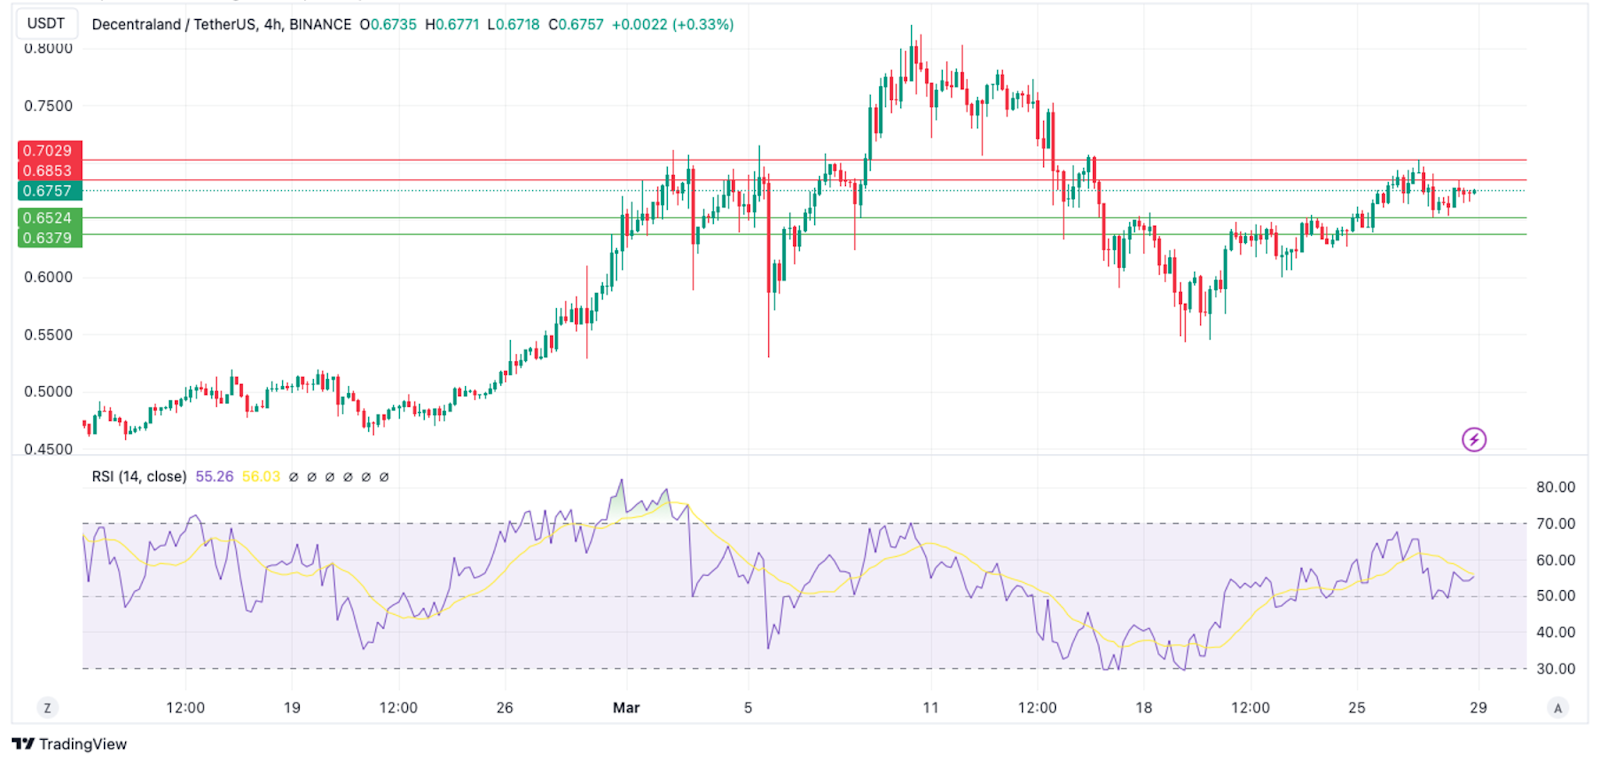
The MANA/USDT 4-hour chart shows an upward trend with resistance at $0.6853 and $0.7029 and support at $0.6524 and $0.6379. The Relative Strength Index (RSI) is at 55, indicating the market is in a neutral phase – MANA is neither overbought or oversold. In other words, the price of MANA is stabilizing, suggesting a consolidation phase. A breakout above the immediate resistance or drop below the immediate support could be key to the token’s next direction.
MANA/USD Price Analysis 1-day chart: MANA Eyes $0.7 Breakout
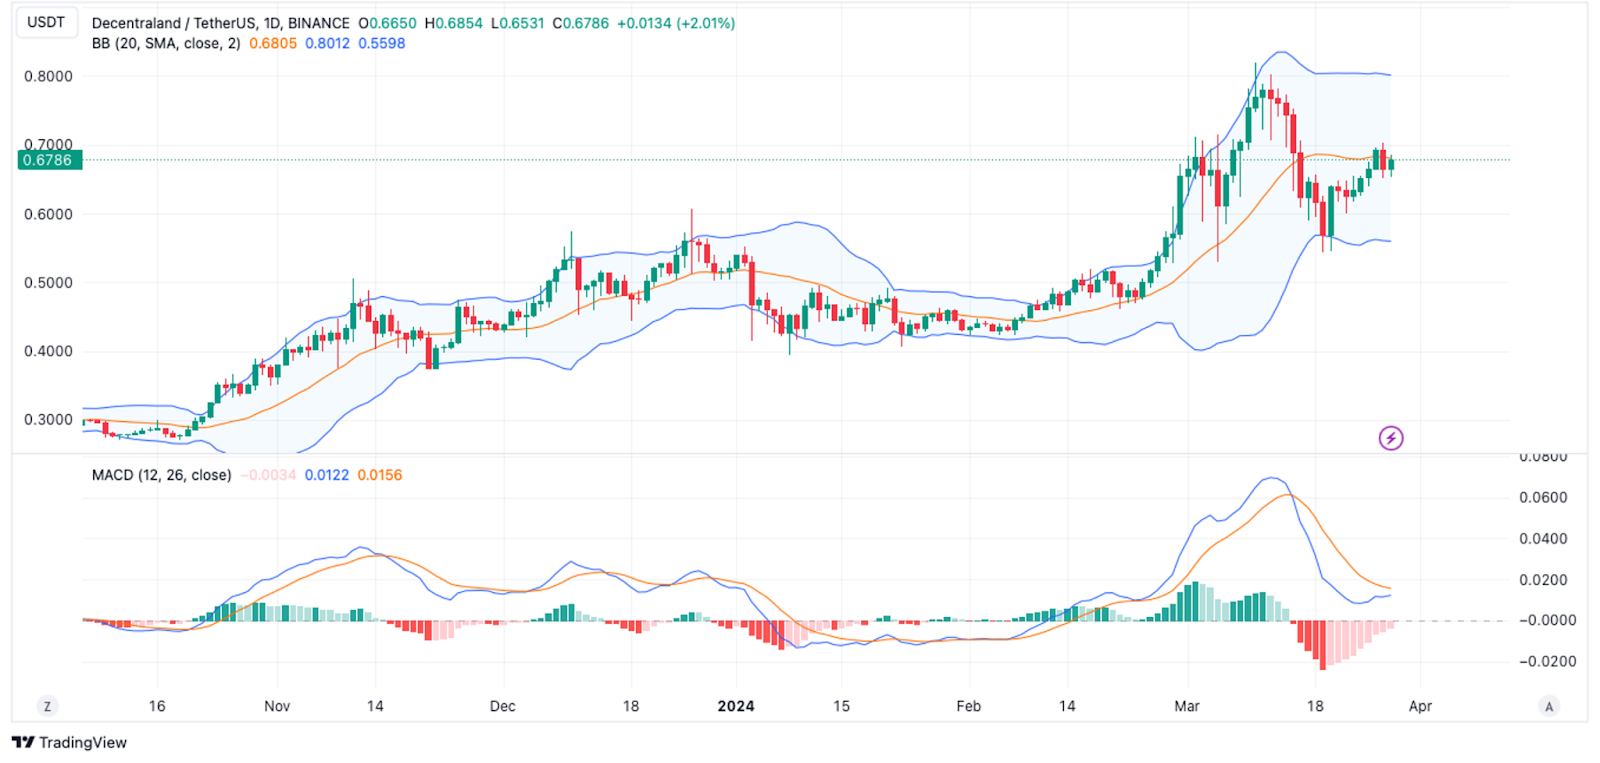
The MANA/USDT 1-day chart shows expanding Bollinger Bands, suggesting increasing volatility. There’s notable resistance near $0.8012 and support around $0.5598. Previous price action indicates that the $0.7 level is a key psychological barrier; a break above this could signal a push towards previous highs. However, the MACD indicates moderate momentum, pointing to potential consolidation rather than a strong uptrend.
Is MANA a Good Investment?
Considering making a MANA investment? You must consider understanding its pivotal role within the Decentraland ecosystem. MANA is appealing because it combines technology and community, creating a shared online space for owning virtual land and having unique experiences. As Decentraland advances and garners more users, the demand for MANA could rise, reflecting its utility and potential for growth. You must note that the nature of cryptocurrencies, alongside regulatory uncertainties, means that any investment should be approached with caution.
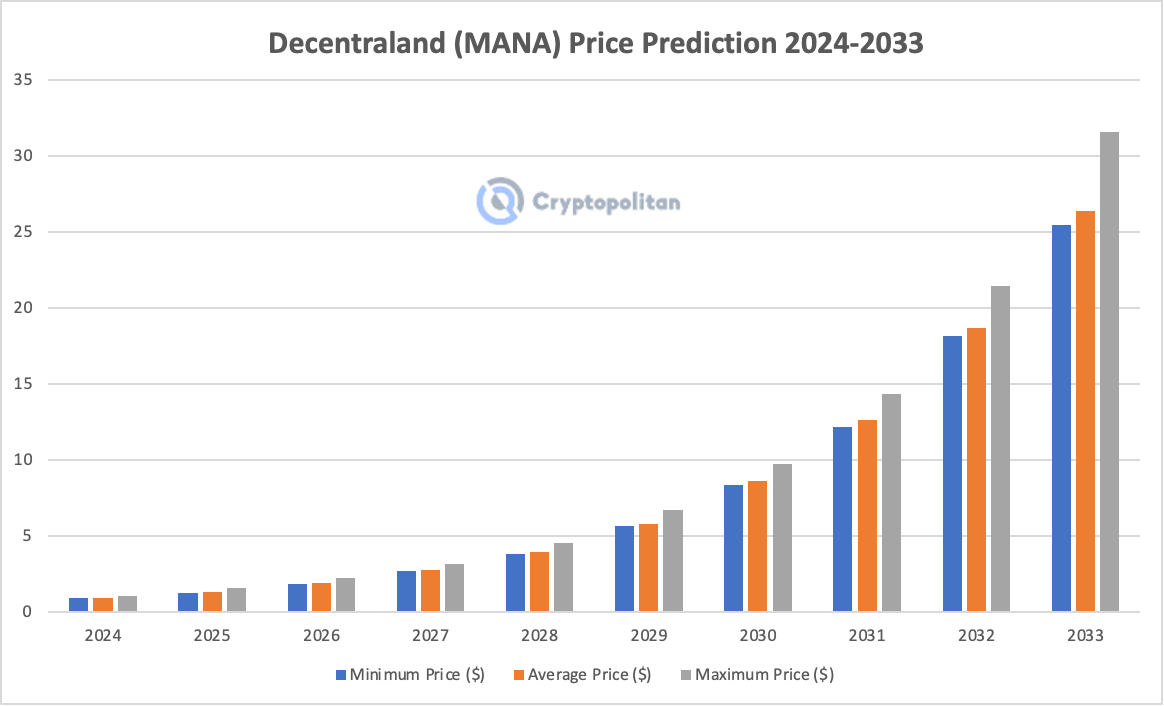
Decentraland Price Predictions 2024 – 2033
| Year | Minimum Price ($) | Average Price ($) | Maximum Price ($) |
| 2024 | 0.8793 | 0.9136 | 1.07 |
| 2025 | 1.27 | 1.31 | 1.57 |
| 2026 | 1.81 | 1.87 | 2.22 |
| 2027 | 2.7 | 2.78 | 3.17 |
| 2028 | 3.82 | 3.95 | 4.56 |
| 2029 | 5.64 | 5.8 | 6.71 |
| 2030 | 8.36 | 8.59 | 9.71 |
| 2031 | 12.18 | 12.61 | 14.34 |
| 2032 | 18.17 | 18.68 | 21.44 |
| 2033 | 25.43 | 26.36 | 31.58 |
Decentraland Price Predictions 2024
According to the Decentraland price prediction for 2024, MANA is expected to trade at a minimum price of $0.8793 and an average price of $0.9136 with a maximum MANA price of $1.07.
Decentraland Price Prediction 2025
The MANA price prediction for 2025 is a bullish one as the crypto is expected to reach a minimum trading price of $1.27, an average forecast of $1.31, and a maximum price of $1.57 by the end of 2025.
Decentraland Price Prediction 2026
In 2026, our MANA price prediction suggests the altcoin might trade at a minimum price of $1.81, an average value of $1.87, and a maximum price target of $2.22.
Decentraland Price Prediction 2027
According to our Decentraland forecast for 2027, MANA is predicted to reach a minimum value of $2.7, a maximum value of $3.17, and an average trading price of $2.78.
Decentraland Price Prediction 2028
According to the MANA price prediction for 2028, the token is expected to reach a minimum value of $3.82, an average value of $3.95, and a maximum forecast price of $4.56.
Decentraland Price Prediction 2029
Our Decentraland prediction for 2029 suggests that the coin’s value can reach a maximum of $6.71 and an average trading price of $5.8. According to our deep technical analysis, MANA is forecasted to trade at around a minimum value of $5.64.
Decentraland Price Prediction 2030
According to the Decentraland MANA price prediction for 2030, the crypto could reach a maximum price of $9.71 and an average market forecast value of $8.59. The minimum expected value is $8.36.
Decentraland Price Prediction 2031
Our MANA coin price prediction for 2031 suggests a maximum price of $14.34, an average value of $12.61 and a minimum forecast of $12.18.
Decentraland Price Prediction 2032
In 2032, MANA may reach a minimum of $18.17, a maximum price of $21.44 and an average forecast price of $18.68.
Decentraland Price Prediction 2033
Our current Decentraland coin price prediction for 2033 suggests the coin could reach a maximum price of $31.58. The altcoin is expected to trade at a minimum price of $25.43 and an average forecast price of $26.36.
Decentraland Price Prediction by Wallet Investor
Decentraland’s analysis presents a bearish outlook, indicating a potential downturn in the market. According to their forecasts, Decentraland’s price is anticipated to experience a decline to 0.0519 USD in 2025.
Decentraland Price Forecast by Digitalcoinprice
Digitalcoinprice holds an optimistic perspective on the future performance of Decentraland. The projection indicates a bullish trend for MANA, with the potential to reach a maximum price of $1.46 by the end of 2024. The forecast suggests a continued upward trajectory, with the price of decentraland projected to reach $3 in 2026. In 2029, MANA could reach $3.62, paving the way for an even more substantial peak of $13.05 by 2033.
Decentraland Price Prediction by Coincodex
According to Coincodex’s prediction, MANA is expected to attain a price of $0.7263 in the next 5 days, and then rise to $0.7323 in 30 days. According to the forecast, the token’s price would fall 3.66 % over the next three months, and then 12.42 % in the next six months. Forecasts for MANA are positive for the year 2025, with the token expected to rise above $1 and reach a value of $1.37.
Decentraland Price Prediction by Market Experts
World War Bitcoin on YouTube provides a speculative analysis on the future price of MANA, suggesting that despite current limitations in Decentraland’s gameplay and engagement, a bull run in 2024-2025 could significantly increase MANA’s price. He underlines the platform’s overvaluation in comparison to its performance, arguing that market enthusiasm, similar to the excitement surrounding Facebook’s renaming to Meta, may boost MANA’s price to a goal of $7.
MANA Overview
| Popularity | #85 | Market Cap | $1,286,534,878 |
| Price Change (24 hours) | 1.22% | Trading Volume (24 hours) | $88,885,544 |
| Price Change (30 days) | +20% | Circulating Supply | 1,908,319,865 MANA |
| All-time low (Oct 2017) | $0.007883 | All-time high (Nov 2021) | $5.90 |
| Price from ATL | +8431.54% | Price from ATH | -88.61% |
MANA Price History
In August 2017, Decentraland (MANA) launched with a $24 million ICO, marking its entry into the market at a low initial price. The token hit its all-time low of $0.007883 in October of the same year. Throughout 2018, MANA experienced volatility, crossing above $0.1 amidst market fluctuations. The year 2019 saw a stabilization in MANA’s price with an average around $0.0409, reflecting a maturing market.
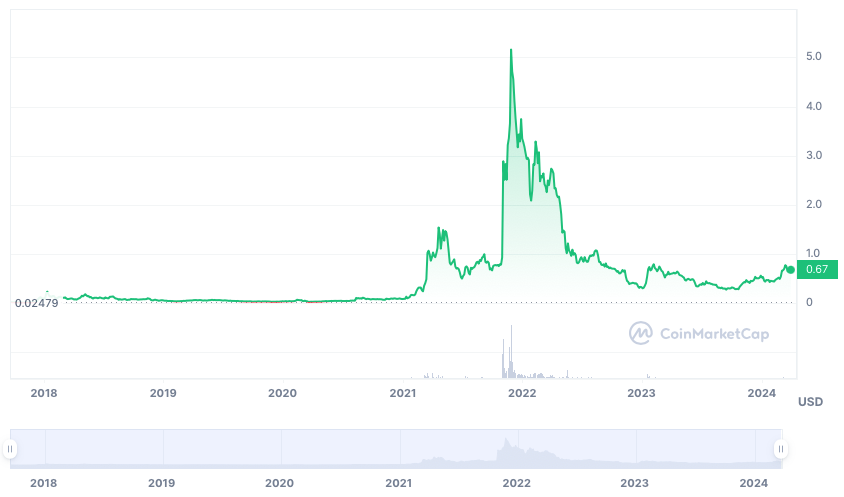
In 2020, the rise of decentralized finance (DeFi) helped push MANA’s value above $0.1, closing the year near $0.08. The crypto bull run in early 2021 saw MANA reaching $1.5 in April and achieving its all-time high of $5.90 in November. However, 2022 was marked by a significant market correction, with MANA experiencing a -91.21% loss, dropping its value to around $0.3.
In 2023, MANA briefly recaptured its August 2022 high of $0.8 before declining below $0.4, and then recovering to close the year at $0.512. MANA started 2024 at $0.5209, reached $0.682 in February, and $0.74 in mid-March. At the time of writing, the current price of MANA is trading at $0.6741.
More on Decentraland (MANA)
What’s Decentraland?
Decentraland is a virtual reality platform based on blockchain technology. It is a virtual world like that depicted in the movie ‘Tron’ or ‘Ready Player One”, but in the real world. Decentraland users can use the virtual world token (MANA) to make transactions in the Decentraland marketplace. Users can buy virtual or digital land in the form of a Non Fungible token (NFT) that can be used to verify ownership in cryptocurrency.
All transactions in Decentraland require the use of MANA crypto. MANA cryptocurrency is a Decentraland coin that powers the Decentraland virtual network. As the concept of NFTs becomes more popular, the popularity of Decentraland and its cryptocurrency MANA has blown up. People can buy MANA to interact with its decentral games, which are available on most major crypto exchanges.
What is MANA?
MANA is the cryptocurrency on Decentraland – the world’s first-ever metaverse built on the Ethereum blockchain. It is a virtual reality where you can customize your appearance, explore and create, and buy a real estate property.
Decentraland’s initial coin offering achieved its goal just one hour after its release into the crypto market, raising nearly €22 million. Today, MANA is used within the platform for customizable units such as wearables, masks, or a custom name available on the website’s marketplace.
Virtual Reality is still a technology in development, and it is exciting to think about its growth potential if it decides to go hand in hand with blockchain technology. The MANA team is very competent and shows a clear inclination toward decentralized environments, which is undoubtedly an important point in assessing its development. MANA and Decentraland are trailblazers and pioneers in the new world of virtual crypto reality.
The idea was brand-new at the time, which makes MANA developers trendsetters in this field. It seems like good things always come from Ethereum, which inspires confidence in Decentraland developers. It is also a good starting point for novices in the crypto market and digital creators and investors in digital content.
Conclusion
The Decentraland ecosystem is built on a solid framework that has ensured its success thus far and is projected to continue to do so. Despite the upset caused by the shift in attention away from the platform’s P2E games, the optics are quite positive, with the coin projected to yield a 370.32% ROI by 2027 and 4585.45% by 2033. While profit-taking opportunities may exist for MANA, it’s crucial to remember that the cryptocurrency market is still incredibly volatile, making it challenging to anticipate a coin or token’s price with any degree of accuracy over the short term and even harder over the long term.
Before investing in the decentraland market, always do your own research and seek professional investment advice where necessary.
FAQs
What you need to know about Decentraland?
Decentraland is an open-source protocol that has had its code vetted by members of the community and third-party auditors. The protocol provides gamers with a secure way to create and monetize content in the form of NFTs (non-fungible tokens). NFTs are blockchain assets that can represent individual items.
What is the best way to make money in Decentraland?
Perhaps one of the most popular and renowned ways of making some extra money in Decentraland is through the very popular NFTs that is almost known to all and is something that everyone talks about.
Is Decentraland a good crypto to buy?
We think Decentraland is one of the finest cryptocurrencies for newcomers to check out in 2024 for three reasons. To begin with, it is inexpensive and simple to get. Decentraland metaverse tokens, known as MANA, continue to trade for a few dollars and are listed on almost all major cryptocurrency exchanges.
Disclaimer. The information provided is not trading advice. Cryptopolitan.com holds no liability for any investments made based on the information provided on this page. We strongly recommend independent research and/or consultation with a qualified professional before making any investment decisions.

Micah Abiodun
Micah Abiodun makes good use of his Environmental Engineering and Management (MSc) at Tallinn University of Technology (TalTech) to polish content and price prediction news at Cryptopolitan. Now on his 7th year in the crypto media space, he covers major cryptos, altcoins, DeFi, stablecoins, macro trends, and emerging tech.


