


Best crypto insights delivered straight to your inbox.
Terra Luna Classic Price Prediction 2024-2032: Is LUNC A Good Investment?


Terra Luna Classic (LUNC) Price Prediction 2024-2032
- Terra Luna Price Prediction 2023 – up to $1.32
- Terra Luna Price Prediction 2026 – up to $4.09
- Terra Luna Price Prediction 2029 – up to $12.24
- Terra Luna Price Prediction 2032 – up to $36.50
A quick recall: Terra Luna was rebranded the original Terra Chain as Terra Classic. Click here for the Terra V2 CMC page. The official announcement regarding the migration can be found here. Due to the de-pegging of UST, LUNA is experiencing extreme volatility. Please proceed with caution. The Terra blockchain was also halted. Please be properly guided before proceeding with any investment plans.
Terra (LUNA) is a secondary token that powers the Terra blockchain. Terra aims to be the go-to decentralized stablecoin used throughout the globe for everyday purchases. As Terra 2.0 was released on May 28th, 2022 after the de-pegging of its stablecoin, the old token got the name Terra Luna Classic (LUNC)
How much is LUNC worth?
Today’s Terra Classic price is $0.00009353 with a 24-hour trading volume of $87,638,645 USD. Terra Classic is up 3.53% in the last 24 hours. The current CoinMarketCap ranking is #63, with a live market cap of $745,735,530 USD. It has a circulating supply of 5,899,843,194,499 LUNC coins and the max. supply is not available.
Terra Luna price analysis: LUNC breaks above $0.000101 as bullish momentum builds
TR: DR Breakdown
- Terra Luna price analysis shows bullish momentum
- The bulls have taken the price levels up to $0.000101
- Support for LUNC/USD is present at $0.00009178
Terra Luna price analysis for June 8, 2023, is dictating an increase in price after a stable bullish trend. The price of LUNC/USD has broken above the $0.000100 level and is now trading at $0.000101. The bulls have managed to gain an edge over the bears as they take the price above the upper trend line of the symmetrical triangle pattern. The buyers have also been able to break the support at $0.00009178 and are now looking to make higher highs.
The bears were in control of the market earlier today, with the price falling to $0.00009413 before reversing and pushing higher. The bulls have since targeted key levels of resistance at $0.0001012 and have been able to break them convincingly. Moving forward, the LUNC price appears primed for further upside as bullish momentum continues to strengthen. Any dips in price should find support at the $0.00009178 level, which is now acting as a strong support area. If this level holds, it will confirm further upside potential for Terra Luna moving forward.
Terra Luna price analysis 1-day chart: LUNC moves closer to $0.000101 as bullish momentum picks up
The 1-day Terra Luna price analysis indicates that the bulls are firmly in control of the market. The LUNC price has broken above the upper trend line of a symmetrical triangle pattern and is now trading at $0.000101. Bullish momentum is growing as the bulls target key resistance areas at $0.0001012 and $0.00010243. If these levels are broken, further upside could be on the cards for LUNC in the near term. On the other hand, any pullbacks should find support at the $0.00009178 level, which is now acting as a strong area of support. It will be important for this level to hold in order for the bulls to remain in control and keep pushing higher.

The Relative Strength Index (RSI) has extended above the 54.96 level, indicating neutral conditions. This suggests that a short-term pullback could be on the cards, but overall, Terra Luna appears primed for further upside. Additionally, the moving average convergence divergence (MACD) is in the bullish zone, indicating an ongoing uptrend. The volatility has been on the increasing side for the day, and the Bollinger Bands values are situated at the following marks; the upper band is at $0.00010229, the middle band is at $0.00008973, and the lower band is at $0.00007718.
LUNC/USD 4-hour price chart: Bulls are driving the market toward $0.0001012 resistance level
The 4-hour Terra Luna price analysis shows the coin recently breaking above the upper trend line of a symmetrical triangle pattern. The price is now trading at $0.000101 and could be set for further upside as the bulls gain strength. In addition, any dips should find support at the $0.00009178 level, which is now acting as a solid area of support. The volatility has been on the decreasing side, with the Bollinger Bands values situated at the following marks; the upper band is at $0.00010154, the middle band is at $0.00008735, and the lower band is at $32.69.

The technical indicator readings are also confirming the ongoing uptrend, with the relative strength index (RSI) currently at 57.88 levels. This indicates that neutral conditions could lead to a pullback in price but overall, Terra Luna is looking set for further upside. Finally, the MACD is in the bullish zone and looking to make higher highs. The buyers appear to be firmly in control of the market, and further upside could be coming their way.
What to Expect from the Terra Luna Price Analysis
Terra Luna’s price analysis shows that the coin is bullish for today; the price has increased to $0.000101. The bulls are firmly in control of the market and have managed to break above key resistance levels. This indicates that further upside potential could be on the cards if these levels hold. Additionally, technical indicators are confirming the ongoing uptrend. If this level holds, it would suggest that further upside is possible for LUNC. In addition, any pullbacks should find support at $0.00009178, which is now acting as a strong support area.
Terra Luna (LUNC) Price Predictions 2024-2032
Price Prediction By Cryptopolitan


Terra Price Prediction 2024
In 2024, the price of Terra is predicted to fall as low as $1.70. Our research indicates that the LUNA price could rise as high as $2.02, with an average anticipated price of $1.75.
Terra (LUNA)Price Forecast for 2025
In 2025, the price of Terra is anticipated to be at least $2.36. With an average price of $2.45 during 2025, the Terra price can go as high as $2.88.
Terra (LUNA) Price Prediction 2026
The price of Terra is anticipated to reach a minimum price value of $3.33 in 2026, according to the forecast and technical analysis. The average price of LUNA is $3.45, with a maximum price value of $4.09.
Terra Price Prediction 2027
In 2027, the cost of 1 terra is anticipated to fall to a minimum of $4.79. With an average price of $4.97 during 2027, the Luna price can go as high as $5.68.
Terra Price Prediction 2028
In 2028, the price of Terra is expected to drop to a minimum of $7.16. Through 2028, the Terra price might trade at an average of $7.36 and a maximum value of $8.33.
Terra Price Forecast 2030
In 2030, it is expected that the cost of Terra will be at least $14.00. With an average trading price of $14.51 throughout 2030, the Terra price may reach a maximum value of $17.32.
Terra (LUNA) Price Prediction 2031
As per the forecast price and technical analysis, in 2031, the price of Terra is predicted to reach a minimum level of $20.71. The LUNA price can reach a maximum level of $24.26, with an average trading price of $21.29.
Terra Price Prediction 2032
Terra’s price is forecast to reach its lowest possible level of $31.30 in 2032. As per our findings, the LUNA price could reach the maximum possible level of $36.50 with the average forecast price of $32.15.
Price Prediction By DigitalCoinPrice
According to DigitalCoinPrice’s Terra price prediction, it’s expected to increase by 1.74% to $2.81 by 2025. However, the current sentiment is bearish, with a Fear and Greed Index of 38.87 indicating extreme fear. The recent 30-day decline of -22.95% suggests a slight recovery ahead. By the end of June, Terra may reach around $1.69, but all indicators show a bearish zone. Trading below the 200-day SMA since December 2023, and the 50-day SMA also. Technical indicators project a drop in the 200-day SMA, potentially reaching $1.46 by December.
Price Prediction By CryptoPredictions.com
Terra’s LUNA token is anticipated to experience significant growth in the coming years, as per CryptoPredictions.com. According to their forecast, the price of LUNA will start trading at $0.00009495 in June and is expected to end the month at $0.00059370723071. The highest projected price for LUNA during May is estimated to reach $0.00061177978825, while the lowest price is predicted to be around $0.00041601025601.
Looking ahead to 2027, the bullish rally of the LUNA token is anticipated to continue, with an average trading level of $0.00058916183249. The website predicts that by the end of 2027, the LUNA token could reach a minimum value of $0.000500787557616 and a maximum value of $0.000736452290612. These projections indicate the potential for substantial growth and suggest an optimistic outlook for Terra’s LUNA token in the long term.
Price Prediction By Wallet Investor
Due to the crash of LUNA in May of last year and Do Kwon’s deception, Wallet Investor predicts decreasing investor interest in Terra price projections, which is a gloomy view for the LUNA token. According to the website, Luna might have a range of $0.0413 to $0.124, with an average price of $0.0826 in 2024.
The Luna token may trade for as little as $0.0148 and as much as $0.0445 in 2027, with an average value of $0.0297.
Price Prediction By Market Sentiments
One of the industry’s emerging cryptocurrencies, Terra Luna, has recently encountered some unfavorable market sentiment. The recent arrest of Terra founder Do Kwon is one of many events that have impacted the market’s perception of Terra Luna. Additionally, the Luna price chart’s heightened selling pressure has prevented the price from rising to the north, establishing a range-bound zone for its prospective future.
Due to this, a number of market analysts now predict a pessimistic future for the Luna token, predicting that it will likely collapse further and lose 120% of its value by the end of 2023.
Terra Luna Overview
Terra Luna is a crypto payment solution that has gained a lot of traction since its initiation in January 2018 by Daniel Shin and Do Kwon, the men behind Terraform Labs.
Terra Overview
[mcrypto id=”141391″]
Luna 2.0 is finally here, with the Genesis block produced on May 28, 2022.
Recent News/Opinions on LUNC
Breaking News: Terraform Labs, co-founded by Do Kwon and Daniel Shin, transferred Convex Finance (CVX) tokens worth 1.8M to another wallet on Tuesday, 9 May 2023. The transfer has come almost a year after the Terra-LUNA crisis that duped $40 billion in investors’ money and started a crackdown of the crypto market.
Terra’s L1 Joint Task Force (L1JTF) team has upgraded its testnet to version 2.0.0. The recent development may increase the price of LUNC, as network developments imply the presence of an active team. After successfully upgrading the testnet, the L1 team’s project manager, LuncBurnArmy, submitted a proposal for the Terra Classic core mainnet upgrade to version 2.0.0. Based on the proposal, the upgrade implementation is scheduled for May 17. Notably, it will introduce a transition to the Cosmos SDK v0.45.13 and Tendermint v34.24 upgrades.
From a survey of opinions, LUNC is probably not worth selling. Hold on to it and see what happens. If they ever manage to burn enough it might drop a 0 one day.
More on LUNC
What is Terra (Luna)?
The Terra project utilizes a two-token system: Terra and Luna. Terra is a decentralized stablecoin pegged to a number of the world’s major fiat currencies including the USD, KRW, CNY, GBP, and most importantly, the International Monetary Fund’s Special Drawing Rights (IMF SDR). The IMF SDR is an international reserve asset based on the value of five currencies — the U.S. dollar, the euro, the Chinese renminbi, the Japanese yen, and the British pound sterling. The Terra token is the unit of account for the Terra protocol. Luna serves as collateral for the stablecoin, Terra, and provides security and stability to the network.
The Terra Luna algorithmic blockchain is configured to peg to the value of their fiat currency counterparts. Terra USD is pegged to the US dollar; the Luna token was then used to absorb volatility from the system. The systemic attack on Luna saw the algorithm crash into a death spiral.
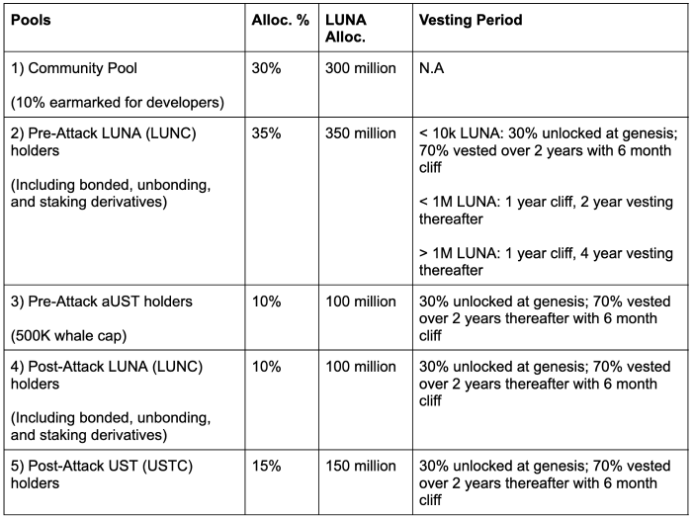
Central to the recovery plan is the institution of a new chain Luna 2.0, with the old chain assuming the name Luna Classic. The recovery plan will see Luna 2.0 airdropped to UST, Luna, and UST holders about the post and pre-attack snapshots.
The platform was built to keep in mind the price volatility of blockchain-based assets and perceive them. Terra focuses on price stability and usability and uses smart contract-enabled cryptographic versions of fiat currencies, called stablecoins, in its platform.
Terra has rolled out multiple fiats pegged stablecoins, including TerraUSD (UST), TerraCNY, TerraKRW, TerraEUR, and other digital currencies. The platform offers easy and quick transactions across borders without any hassle and is used by retailers worldwide.
The native token of the network, LUNA, is an essential element in the Terra Ecosystem and is responsible for platform governance. The LUNA token is responsible for operating the collateralizing mechanisms which keep the stablecoins in check and avoid massive fluctuation.
LUNA uses the Proof-of-Stake consensus and has an elastic supply depending on the platform’s need for stablecoins in circulation. Terra has a wallet called the Terra Station that can give direct access to stablecoins. One can access the DApps built on the Terra blockchain by using the wallet. Furthermore, the Terra Station can operate on a phone and a computer without failure.
The Aftermath of the Terra Luna Debacle
While speculators ponder on their losses and the recovery plan, the Lunatic community has already charted the way forward for Luna through its decentralized voting platform. Amid the crash, TerraLabs founder and CEO Do Kwon offered a Luna recovery plan to stabilize the current crypto wreckage. This comes amid talk about a Luna delisting and trade suspension from exchanges.
Notices placed on CoinMarketCap: The original Terra Chain will be rebranded as Terra Classic (LUNC). Click here for the Terra V2 CMC page. An official announcement regarding migration can be found here. Due to the de-pegging of UST, LUNA is experiencing extreme volatility. Please proceed with caution. The Terra blockchain was also halted.
Recovery Plan
The cryptocurrency Terra (LUNA) has collapsed by more than 99 percent. The coin’s value tumbled dramatically on Wednesday, falling from $6.75 to just over $1. It fell further on Thursday and was valued at just $0.02 on Thursday afternoon, May 12, 2010. On the other hand, Terra’s UST stablecoin fell as Low as 65 Cents before rebounding: what went wrong? Why did the stablecoin lose its peg, which is the US Dollar?
Just 2 months previously, Terra price analysts predicted a bullish trend for the day as the steep increment in LUNA/USD value had been detected. The price has recovered up to $96.77 after the bullish efforts seen on 9 March. The Independent offered a palliative to prevent a further “crypto run”:
Cryptocurrencies are increasingly moving in sync with tech stocks, with investors treating both as risk assets and often retreating to safer corners of the market during bouts of market volatility.
Michael Kamerman, CEO, trading platform Killing
Terra Luna 2.0 Token Distribution
Conclusion
The Terra blockchain, represented by its digital asset LUNA, is a widely recognized protocol in the blockchain industry. Despite being a fork of the original network, the protocol continues to be a leading digital asset with significant influence in the growing industry.
The primary motive of the Terra blockchain is to create stablecoins, tokens designed to integrate the decentralized freedom of cryptocurrencies with the stability of fiat money. LUNA is a key piece to this system and is described as a staking or protocol token. In the future, Terra fans will get multiple opportunities to profit from its cross-chain connectivity with other Cosmos SDK blockchains. In addition, Terra has room to expand its sector and enhance its user base outside of Asia because the stablecoin’s significance is hyped internationally in terms of legislation and mainstream usage in payment systems.
The birth of Terra hinted at the continuation of optimistic developments and consistent growth of the crypto space around the world. Through integrating innovative tools that provide more efficiency and speed to users, LUNA aims to influence the decentralized sector hard as Terra Luna continues to evolve the global crypto market towards mainstream adoption by setting new goals. The continuous efforts of the Terra Foundation and impactful steps may soon push LUNC to new highs, bringing a ray of hope to investors after the crash.
The Terra Luna stable coin crash has scarred the crypto space. With 70% of Luna held in the top 10 wallet addresses, the chain is not as decentralized as we would like it to be. Luna 2.0 has an uphill task. Its CEO Don Kwon is already under investigation by the Korean government for task evasion and other civil suits.
Exercise caution when it comes to investing in algorithmic stablecoins; if you are not knowledgeable about the crypto market and its volatility, it is advisable to stay off from trades to avoid losses.
Despite keeping up with the advancements in the wider crypto space, the value of the LUNA asset has declined along with the overall crypto market. This is due to increasing speculation about a potential tax imposition by the U.S. government.
FAQs
Where can I buy Luna 2.0?
Once listed, you can buy Luna 2.0 on Binance, Okex, Bitfinex, and Bitrue.
Is Luna 2.0 a fork of the Luna blockchain?
No, Luna 2.0 is an independent blockchain from Luna Classic and its algorithm stablecoins. This new Terra network is completely independent of the old, faulty Terra blockchain. Luna 2.0 was practically provided to investors who owned LUNA or UST in the pre- and post-attack periods, essentially for nothing.
What's another likely source of a LUNA crash?
Analyze the theory in this video: https://www.youtube.com/watch?v=y_otSD3LYCA
Is Terra Luna a good buy now?
Analysts say that LUNA would certainly take some time to recover from this erosion, making Terra likely a good buy now. Terra is an Algorithm-backed stablecoin that provides a growing array of decentralized finance applications
Can I still buy the original Luna token?
After rebranding to ‘Terra Classic,’ the original blockchain network will continue to operate. However, the old Luna token has been transformed into the Luna Classic token (LUNC). You may still acquire Terra Luna (the original form) from select exchanges at less than 99 percent of its prior peak price.
Disclaimer. The information provided is not trading advice. Cryptopolitan.com holds no liability for any investments made based on the information provided on this page. We strongly recommend independent research and/or consultation with a qualified professional before making any investment decisions.

Emman Omwanda
Emmanuel Omwanda’s expertise lies in cryptocurrency markets, spanning both fundamental and technical analysis. He previously worked with various crypto media sites before joining Cryptopolitan, including CoinEdition, The Crypto Basic, CryptoNews Flash, and DroomDroom.He holds a Bachelor of Science (BSc.) in Mathematics and Computer Science from Kenyatta University, Kenya, and is currently in his final year pursuing a Bachelor of Arts in Communication and Media Studies.


CRASH COURSE
- Which cryptocurrencies can make you money
- How to boost your security with a wallet (and which ones are actually worth using)
- Little-known investment strategies that the pros use
- How to get started investing in crypto (which exchanges to use, the best crypto to buy etc)