TL;DR Breakdown
- Shiba Inu price analysis appears to be bullish today.
- Strong resistance present at $0.00003597.
- Strong support present at $0.00002961.
The Shiba Inu price analysis has entered a bullish market with slight chances of a reversal. The bears dominated the market for a few weeks, but the bulls have returned more vigorously and have captured the market, all that’s left to see it will this momentum be maintained. Following yesterday’s movement, the price of SHIB held itself and reached $0.00003069, from $0.00003094. On January 15, 2022, the price fluctuated around the $0.00003100 mark and remained around that threshold. Today the price has been maintaining the same movement its reached $0.00003069 while losing a small fragment of its original value. SHIB currently trades at $0.00003069.
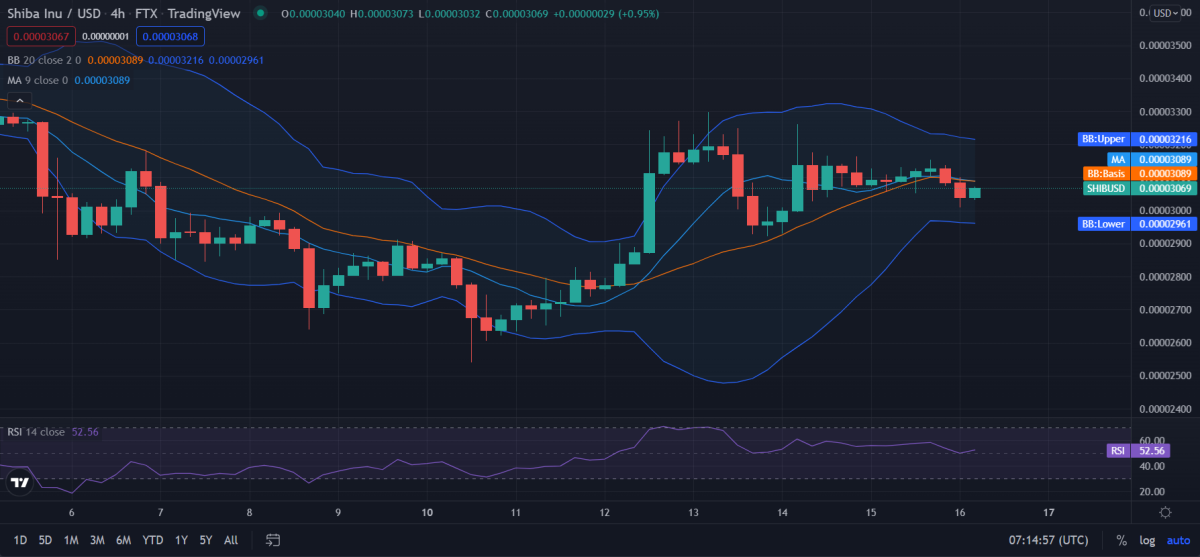
SHIB/USD 4-hour analysis: Latest developments
The Shiba Inu price analysis has revealed the market seems to have entered a bullish region with the volatility significantly shrinking, making the cryptocurrency’s price less vulnerable to volatile change. As a result, the upper limit of the Bollinger’s band is present at $0.00003216, which acts as the strongest resistance for SHIB. Conversely, the lower limit of the Bollinger’s band is available at $0.00002961, which acts as the strongest support for SHIB.
The support and resistance band appears to be closing in on each other, indicating the market is entering a squeeze, which will erupt the volatility soon. With its in mind, we can deduce that even if the bears confiscate the entire market, the bulls will have every opportunity to return and reclaim the market once the compression ends.
The SHIB/USD price appears to be crossing under the Moving Average curve, making the market bearish. The price has entered the bearish zone with no telling whether the bears will be able to carry on with it. In the last few hours, the Shiba Inu market has experienced fluctuations between bearish and bullish trends. It has finally decided on entering the bear’s territory. As the volatility decreases, the price is more prone to maintain the current trend.

The Relative Strength Index (RSI) score is 52, making the cryptocurrency fall in the upper neutral zone, showing no signs of devaluation or inflation. However, the buying activity has started to exceed the selling activity causing the RSI score to escalate.
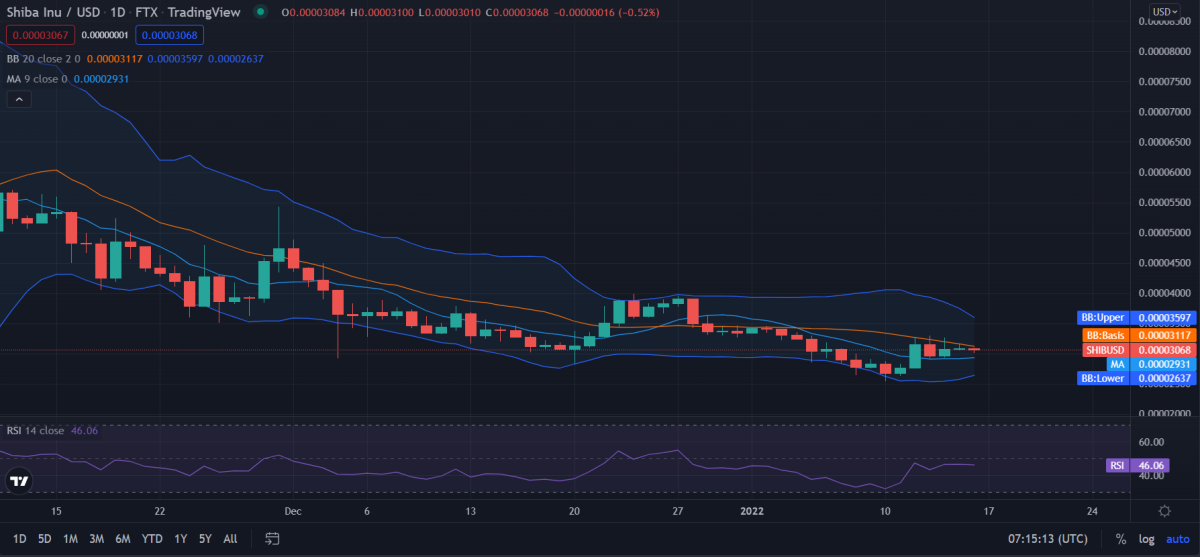
Shiba Inu Price Analysis for 1-day: Volatility shrinks
The Shiba Inu price analysis has revealed a bullish market with the potential to maintain it. Moreover, the market’s volatility appears to be following a declining trend, making Shiba Inu’s price less vulnerable to variable change on either extreme. As a result, the upper limit of the Bollinger’s band is present at $0.00003597, which serves as the strongest resistance for SHIB. Conversely, the lower limit of the Bollinger’s band exists at $0.00002637, which acts as the strongest support for SHIB.
The SHIB/USD price appears to cross over the curve of the Moving Average, signifying a bullish movement. The market seems to follow a clear trend as of now, and with the volatility on the down low, the bulls might be able to maintain it with ease. The support and resistance band appear to be filling the gap between them, tightening the market, indicating a tight market with fewer chances of volatile change.

The Shiba Inu price analysis reveals the Relative Strength Index (RSI) score to be 46, signifying the stability of the cryptocurrency, and the RSI falls in the lower neutral zone. The RSI appears to be following a linear direction pointing towards the equivalence of the buying and selling activity and stability.
Shiba Inu Price Analysis Conclusion:
The Shiba Inu price analysis concludes that the cryptocurrency follows a fluctuating bullish trend. The cryptocurrency has shown much room for bullish activity, as well as bearish opportunities. The volatility declines as bulls tighten their grip on the market, with the bears trying real hard to counter with everything they’ve got. The market remains under bullish dominance.
Disclaimer. The information provided is not trading advice. Cryptopolitan.com holds no liability for any investments made based on the information provided on this page. We strongly recommend independent research and/or consultation with a qualified professional before making any investment decisions.


