

Best crypto insights delivered straight to your inbox.

Key Takeaways
- In 2026, the Shiba Inu coin price prediction suggests a maximum value of $0.000027.
- In 2029, SHIB is expected to reach a maximum value of $0.00002290.
- The price of Shiba Inu is predicted to reach a maximum value of $0.00004280 in 2032.
Shiba Inu (SHIB) started as a decentralized, community-driven cryptocurrency created in August 2020 by the anonymous founder Ryoshi. Initially launched as a meme coin, SHIB quickly gained global attention and evolved into a broader ecosystem that includes ShibaSwap, Shibarium, BONE, and LEASH. Today, SHIB remains one of the largest meme-inspired cryptocurrencies by market capitalization and continues expanding its real-world utility.
Recent developments highlight growing ecosystem activity. The team launched “Shib Owes You” (SOU), introduced AI-powered tools through “Shibarium Skills,” and resolved RPC connectivity issues affecting users. Shibarium has also surpassed 270 million wallet addresses, while SHIB gained additional payment utility through its integration with OnePay.
For investors, traders, and long-term SHIB holders, understanding future price movements is important. Shiba Inu’s price remains heavily influenced by Bitcoin, broader market sentiment, token burns, social media engagement, and ecosystem adoption. As capital increasingly rotates toward utility-focused blockchain projects, developments such as Shibarium and decentralized finance integrations may play a larger role in shaping SHIB’s future value.
Will Shiba Inu continue expanding its ecosystem and regain bullish momentum in the years ahead? In this Shiba Inu price prediction, we analyze the factors affecting SHIB’s market performance and forecast its potential price trends between 2026 and 2032.
Overview
| Cryptocurrency | Shiba Inu |
| Token | SHIB |
| Price | $0.00000487 |
| Market Cap | $2.86B |
| Trading Volume (24-hour) | $68.94 million |
| Circulating Supply | 589.24T SHIB |
| All-time High | $0.00008845 (Oct 27, 2021) |
| All-time Low | $0.00000000008165 (Aug 31, 2020) |
| 24-hour high | $0.00000490 |
| 24-hour low | $0.00000440 |
Shib price prediction: Technical Analysis
| Metric | Value |
|---|---|
| Volatility | 6.83% (High) |
| 50-Day SMA | $0.000005989. |
| 14-Day RSI | 27.61 (Oversold) |
| Market Sentiment | Bearish |
| Fear & Greed Index | 11 (Extreme Fear) |
| Green Days | 13/30 (43%) |
| 200-Day SMA | $0.000006819 |
SHIB price analysis
- SHIB price analysis indicates that buyers are trying to recover the SHIB price back above $0.0000048.
- The current Resistance for SHIB is at $0.0000050
- The immediate Support for SHIB is at $0.0000046
Shiba Inu price analysis for 12 June indicates that the memecoin has recovered from its latest lows, but sellers continue to dominate the broader trend, with the memecoin currently trading slightly above $0.0000048. The market structure is still bearish because SHIB has broken below major resistance levels. The traders are now waiting to see whether the recovery will strengthen in the current bounce.
SHIB price analysis 1-day chart
The daily price chart of the Shiba Inu (SHIB) we see is still bearish despite recent recovery from the $0.0000044 mark. On the daily chart, Shiba Inu is trading at $0.00000487, which is 1.25% gain in value over the last 24hours.
The 24hour trading volume has improved to $68.94 million, which shows increasing market interest as buyers defend support levels. Buyers came in at the lows and pushed the price back towards $0.0000049.
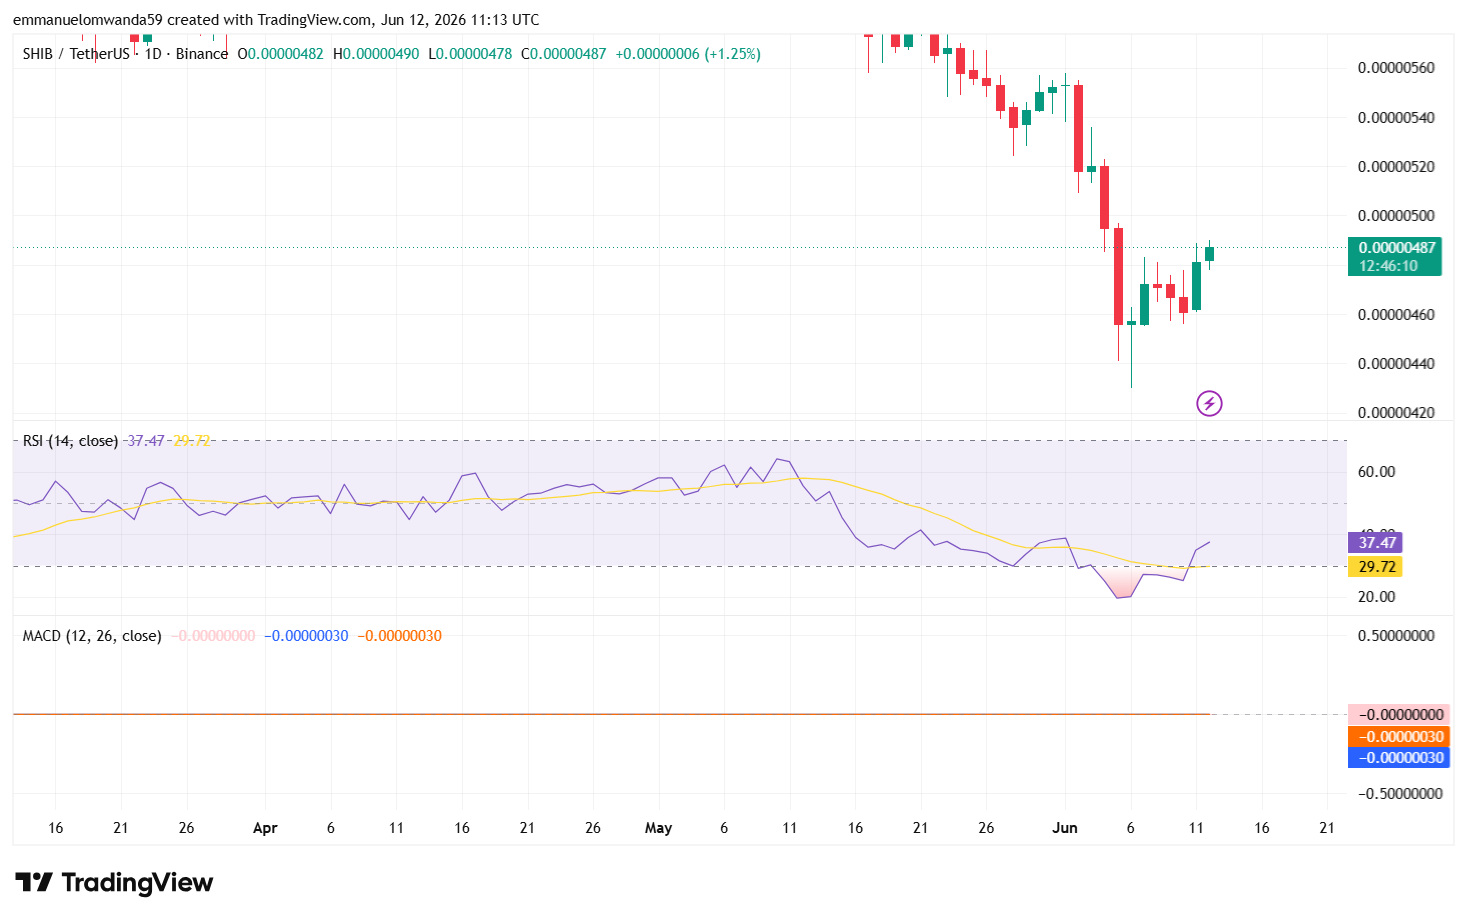
The RSI-14 chart indicator is currently trading at the 37.47 level, which indicates bearish momentum is still in control. The indicator is recovering from oversold levels, meaning that traders are slowly returning to the market with a positive outlook.
The MACD indicator is still below the zero line, reiterating the sellers’ advantage. The histogram is starting to flatten out, though, which indicates that bear pressure is easing.
The immediate support level is at $0.0000046, while a higher support area is at $0.0000044. The good news is that SHIB is prepared for immediate support at $0.0000050 and could be headed for $0.0000052 on a move upwards.
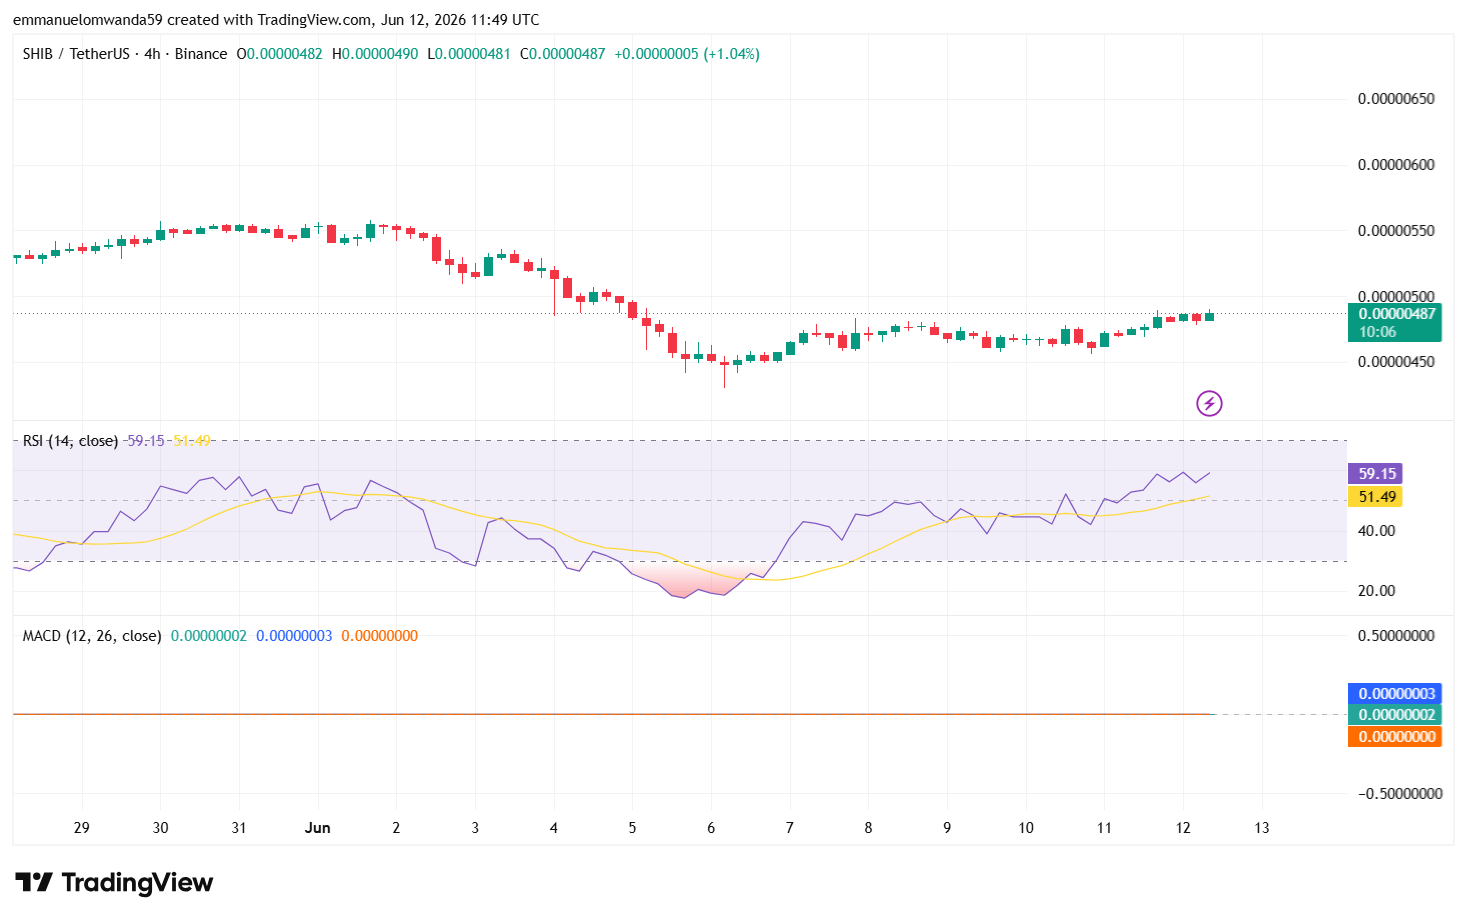
SHIB 4-hour price chart
The 4-hour Shiba Inu chart shows that buyers are slowly consolidating their position and have been coming back to around the recent $0.0000044 low. The price has been approaching $0.0000049 in a bullish manner, as SHIB has been creating higher lows over the short-term timeframe.
The RSI indicator is trading at 59.15, which reveals that buying pressure is growing, and bulls have the upper hand. The indicator is still not up in overbought areas, and there is still a chance for more gains.
The MACD indicator has moved into the positive zone as the MACD line is above the signal line. This is an indication of strengthening bullish momentum and growing investor confidence for the bulls. There is immediate resistance at $0.0000050, and if they break, SHIB could be heading for $0.0000052. The support levels are at $0.0000047 and a more solid support zone around $0.0000045.
Shiba Inu technical indicators: Levels and action
Daily simple moving average (SMA)
| Period | Value | Action |
| SMA 3 | $0.000005387 | SELL |
| SMA 5 | $0.000005411 | SELL |
| SMA 10 | $0.000005448 | SELL |
| SMA 21 | $0.000005673 | SELL |
| SMA 50 | $0.000005989 | SELL |
| SMA 100 | $0.000005917 | SELL |
| SMA 200 | $0.000006819 | SELL |
Daily exponential moving average (EMA)
| Period | Value | Action |
| EMA 3 | $0.000005322 | SELL |
| EMA 5 | $0.000005375 | SELL |
| EMA 10 | $0.000005466 | SELL |
| EMA 21 | $0.000005645 | SELL |
| EMA 50 | $0.000005866 | SELL |
| EMA 100 | $0.000006170 | SELL |
| EMA 200 | $0.000007138 | SELL |
What to expect from the SHIB price analysis next?
If buyers maintain momentum above the $0.0000046 support level, SHIB could continue its recovery and challenge the immediate resistance at $0.0000050. However, a rejection at resistance may trigger renewed selling pressure and push the price back toward the $0.0000045 support zone.
Is Shiba Inu a good investment?
Shiba Inu (SHIB) is currently consolidating between key support and resistance. Many traders use candlestick charts to track the opening, closing price, highest, and lowest prices over a specific timeframe when watching key price levels.
A breakout above resistance levels could lead to gains, while failure to hold support may cause further downside. SHIB may suit investors comfortable with volatility, but it’s important to monitor price action closely before making any investment decision. These technical setups may shape SHIB’s movement in the coming days.
Why is Shiba Inu up today?
SHIB is up today as investors rotate into meme coins amid improving market sentiment, helping the token outperform major cryptocurrencies. The rally is also supported by Japan’s favorable crypto regulatory plans, while traders are watching whether SHIB can break above the key $0.00000519 resistance level to extend its recovery.
Recent news on Shiba Inu
Shiba Inu’s network activity continued expanding as the total holder count climbed to over 1.58 million wallets, while exchange reserves remained near yearly lows at 81.31 trillion SHIB. Shibarium, a Layer-2 blockchain solution, was developed to improve transaction efficiency and reduce gas fees across the ecosystem. The community also launched an incubator for art and NFTs tied to SHIB ecosystem projects, supporting broader adoption over time. Recent on-chain activity data also showed sustained exchange outflows and net outflows of over 452 billion SHIB, while built-in dApps on social platforms can add utility that feeds back into token demand, signaling continued accumulation despite subdued market trading activity.
SHIB Market Snapshot
SHIB holder count has climbed to 1,585,249 wallets, continuing the steady expansion of the network while exchange reserves remain near yearly lows.
Latest exchange data: • Total Exchange Reserve: 81.31T SHIB • Total Exchange Netflow: -452.72B SHIB • 7D…
— Shibarium | SHIB.IO (@Shibizens) May 20, 2026
Will SHIB reach $0.00005?
Yes, according to crypto experts’ long-term predictions, SHIB’s role in the cryptocurrency market is projected to lead it to reach $0.00005 behold 2032.
Will SHIB reach $100?
SHIB’s goal of reaching $100 is virtually impossible because its enormous total supply already makes that target unrealistic, even before considering the market capitalization required. Additionally, to get the $100 mark, SHIB would require a significant increase in its market cap, which is beyond imagination for a meme coin.
Does SHIB have an excellent long-term future?
The Shiba Inu price made headlines in January 2025 after Shytoshi Kusama, the lead developer, stepped down. Any current forecast for SHIB also depends on technical factors and fundamental factors, not just leadership changes. However, SHIB shows some positive movement, suggesting the ecosystem may have a promising long-term future.
However, its success will also depend on macroeconomic factors, partnerships, broader market adoption trends, and other regulatory developments that influence market cycles. Broader adoption across DeFi, gaming, and NFTs could also improve long-term confidence in the project. You are advised to seek investment advice, do your own research, and gather expert opinions before investing in the highly volatile crypto market.
Shiba Inu price prediction for June 2026
The Shiba Inu price forecast for June 2026 is expected to range from $0.00000447 to $0.00000546. The average price for SHIB is projected to be around $0.00000533, suggesting continued consolidation near current levels as the market searches for direction.
| Month | Potential low | Potential average | Potential high |
|---|---|---|---|
| June 2026 | $0.00000447 | $0.00000533 | $0.00000546 |
Shiba Inu price prediction 2026
By the end of 2026, Shiba Inu is forecasted to reach a price of $0.0000027, with potential fluctuations throughout the year. For a broader shiba inu forecast, outside price forecasts from Yahoo Finance and CoinDCX put the average trading baseline for the shiba inu shib price around $0.000028 to $0.000060.
A more cautious Shib price prediction 2026 from CoinCodex and Benzinga suggests a lower floor near $0.000009 to $0.000030 if market corrections dominate, which helps frame possible downside in Shiba Inu cost terms. For December 2026, the maximum trading value of Shiba Inu is expected to be around $0.00000733, with a possibility of dropping to a minimum of $0.00000655.
DigitalCoinPrice and Benzinga also place bullish price targets as high as $0.00010 in their price forecasts if a synchronized altcoin rally takes hold. For the cryptopolitan forecast price to trade between $0.000005173 and $0.000027 with an average price of $0.000016086 throughout 2026.
| Year | Potential low | Potential average | Potential high |
|---|---|---|---|
| 2026 | $0.00000445 | $0.000060 | $0.000027 |
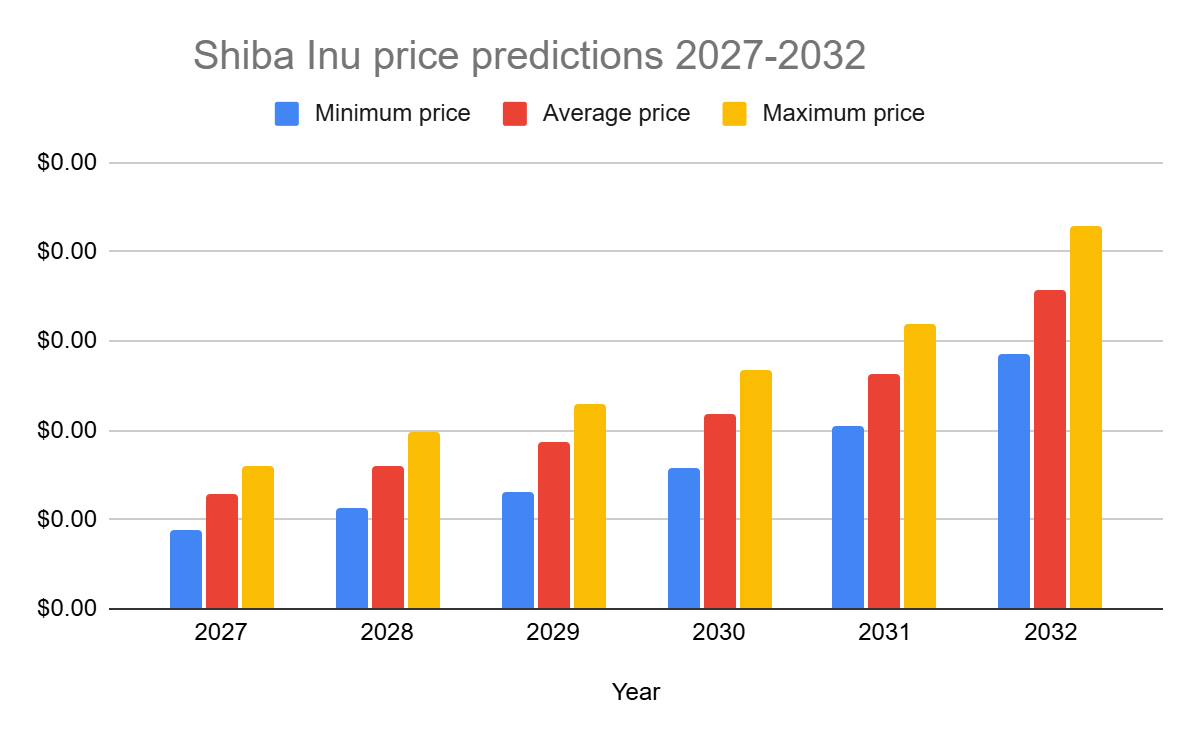
Shiba Inu price predictions 2027-2032
| Year | Minimum price | Average price | Maximum price |
|---|---|---|---|
| 2027 | $0.00000890 | $0.00001280 | $0.00001610 |
| 2028 | $0.00001140 | $0.00001590 | $0.00001980 |
| 2029 | $0.00001320 | $0.00001870 | $0.00002290 |
| 2030 | $0.00001580 | $0.00002190 | $0.00002680 |
| 2031 | $0.00002040 | $0.00002630 | $0.00003190 |
| 2032 | $0.00002860 | $0.00003570 | $0.00004280 |
Shiba Inu Price Prediction 2027
In 2027, the price of Shiba Inu is projected to reach a minimum level of $0.00000890. The SHIB price could rise to a maximum of $0.00001610, with an average trading price of $0.00001280 as the market gradually recovers and the ecosystem grows.
Shiba Inu Price Prediction 2028
The price of Shiba Inu is expected to reach a minimum level of $0.00001140 in 2028. The SHIB price could climb to a maximum level of $0.00001980, with an average price of $0.00001590 throughout the year.
Shiba Inu Price Prediction 2029
In 2029, the price of Shiba Inu is predicted to reach a minimum level of $0.00001320. The SHIB price could reach a maximum level of $0.00002290, with an average trading price of $0.00001870.
Shiba Inu Price Prediction 2030
In 2030, Shiba Inu is forecast to trade at a minimum value of $0.00001580. The price could reach a maximum of $0.00002680, with an average trading value of $0.00002190.
Shiba Inu Price Prediction 2031
In 2031, the price of Shiba Inu is expected to reach a minimum value of $0.00002040. The SHIB price could reach a maximum value of $0.00003190, with an average value of $0.00002630.
Shiba Inu Price Prediction 2032
Shiba Inu price is forecast to reach a lowest level of $0.00002860 in 2032. The SHIB price could reach a maximum level of $0.00004280, with an average forecast price of $0.00003570.
Shiba Inu market price prediction: Analysts’ SHIB price forecast
Analyst price forecasts vary by methodology and source, with firms like DigitalCoinPrice, CoinCodex, and Wallet Investor often producing different outlooks.
| Firm Name | 2026 | 2027 |
|---|---|---|
| DigitalCoinPrice | $0.00010 | $0.0000216 |
| CoinCodex | $0.000030 | $0.00001299 |
Cryptopolitan’s Shiba Inu price prediction
Our predictions show that the Shiba Inu cryptocurrency will achieve a minimum value of $0.000005173 and $0.000027 with an average price of $0.000016086 throughout 2026. in 2026. This current forecast is based on multiple technical quantitative indicators rather than a single model. Any potential profit remains speculative because SHIB is still highly sensitive to shifts in market sentiment and the broader crypto market. $0.000005173 and $0.000027 with an average price of $0.000016086 throughout 2026. Please note that the content provided and other content on this page are for informational purposes only and do not constitute investment advice. Seek independent professional consultation or do your research.
Shiba Inu historic price sentiment
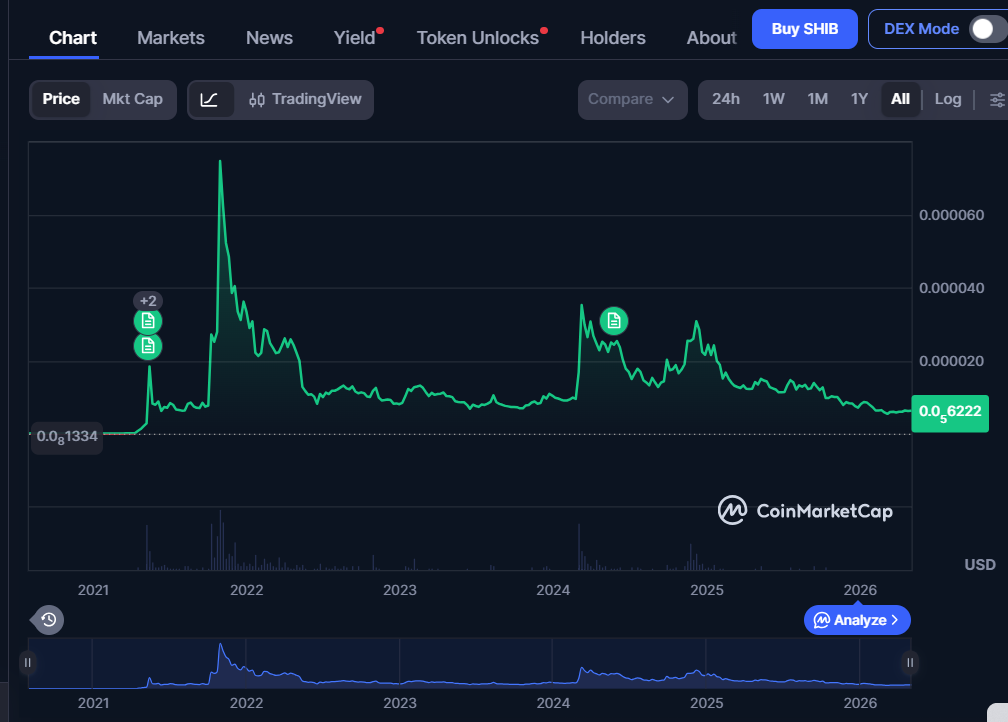
- Shiba Inu surged over 300% shortly after launch, triggering a trading frenzy similar to Dogecoin’s early 2021 rally. Early demand was amplified when Elon Musk mentioned getting a Shiba Inu dog, boosting attention and helping trigger sharp price spikes. During this period, many investors rushed to buy SHIB on easy-to-use platforms as its popularity surged and exchanges quickly listed the token to meet demand.
- Shiba Inu’s price action has been marked by significant volatility, with sharp spikes and corrections driven by community hype, market sentiment, and broader crypto trends.
- In 2022, SHIB started near $0.000025 but dropped to around $0.000008 by May, then moved between $0.000007 and $0.000010 for the rest of the year.
- In early 2023, Shiba Inu briefly spiked to $0.000015 in February but declined gradually, stabilizing around $0.000010 by June 2023 and closing the year at $0.00001033.
- In March 2024, SHIB climbed to $0.000045 before consolidating between $0.000017 and $0.000029. By late 2024, the price moved between $0.000015 and $0.000033.
- In 2025, SHIB gradually declined from $0.000021 to below $0.000009 by December, despite brief rebounds during the year, and the period was marked by heavy consolidation compared with earlier phases that relied more on social media hype. This reflected a more utility- and ecosystem-driven phase for SHIB than prior hype cycles.
- In early 2026, SHIB briefly recovered to $0.0000098 in January but fell to the $0.0000065 range in February.
- In January 2026, Shiba Inu jumped from about $0.0000087 to near $0.0000098 before pulling back and stabilizing around $0.0000093.
- As of February 2026, Shiba Inu (SHIB) experienced volatility, fluctuating between approximately $0.0000065 and $0.0000068, with short-term rebounds failing to sustain upward momentum.
- At the start of March 2026, Shiba Inu (SHIB) remained under pressure, trading around $0.0000054 after slipping from the February range.
- Shiba Inu (SHIB) experienced a bullish momentum on March 16, 2026, with the price rising 8% in 24 hours to approximately and over 17% for the week.
- By the end of March 2026, Shiba Inu (SHIB) traded at around $0.0000058 after failing to sustain recoveries from mid-month gains.
- By mid-April 2026, Shiba Inu (SHIB) traded around $0.0000061, showing slight stabilization after recovering from the early March range, though buying momentum remained limited.
- At the start of May 2026, Shiba Inu (SHIB) traded around $0.0000062, moving in a tight range with slight consolidation, as the market showed weak momentum and no strong buying pressure.
- At the start of June 2026, Shiba Inu (SHIB) traded around $0.0000053, remaining under pressure after May’s decline.
FAQs
Where can I buy Shiba Inu?
You can buy Shiba Inu on Uniswap decentralized exchange and Binance cryptocurrency exchanges.
What are Shiba Inu dogs?
Shiba Inus are a type of short dog with prick ears, short paws white markings on their face and chest (white ventral collar) and a brown outer coat with a spirited boldness and good nature. Shibas were originally bred in Japan to hunt small game and dog sports. Their grooming requires regular bathing and daily brushing unlike most breeds (Other dogs). It is a number 1 companion dog after undergoing obedience training. Hip dysplasia is one of the common health conditions for Shibas. Organizations involved with Shibas include the American kennel club, the national breed club, and the Shiba Inu rescue association.
Where can I buy Shiba Inu coins?
You can buy Shiba Inu at Binance, Okex and Bitfinex.
Disclaimer. The information provided is not trading advice. Cryptopolitan.com holds no liability for any investments made based on the information provided on this page. We strongly recommend independent research and/or consultation with a qualified professional before making any investment decisions.

Emman Omwanda
Emmanuel Omwanda’s expertise lies in cryptocurrency markets, spanning both fundamental and technical analysis. He previously worked with various crypto media sites before joining Cryptopolitan, including CoinEdition, The Crypto Basic, CryptoNews Flash, and DroomDroom.He holds a Bachelor of Science (BSc.) in Mathematics and Computer Science from Kenyatta University, Kenya, and is currently in his final year pursuing a Bachelor of Arts in Communication and Media Studies.


CRASH COURSE
- Which cryptocurrencies can make you money
- How to boost your security with a wallet (and which ones are actually worth using)
- Little-known investment strategies that the pros use
- How to get started investing in crypto (which exchanges to use, the best crypto to buy etc)