Polkadot price analysis shows a continuation of the downtrend in place, as price dipped another 3 percent to fall as low as $4.90 over the past 24 hours. Having recovered back up to $4.99 at the time of writing, DOT has declined more than 10 percent since the start of June. Polkadot price is set to continue to test support at the $5 mark, whereas the immediate resistance point is set at $5.5 which was the high on May 28. Over the past 24 hours, DOT trading volume dropped slightly, indicating a bearish trend, whereas the token’s market capitalisation dropped 4 percent to $6,624,378,804.
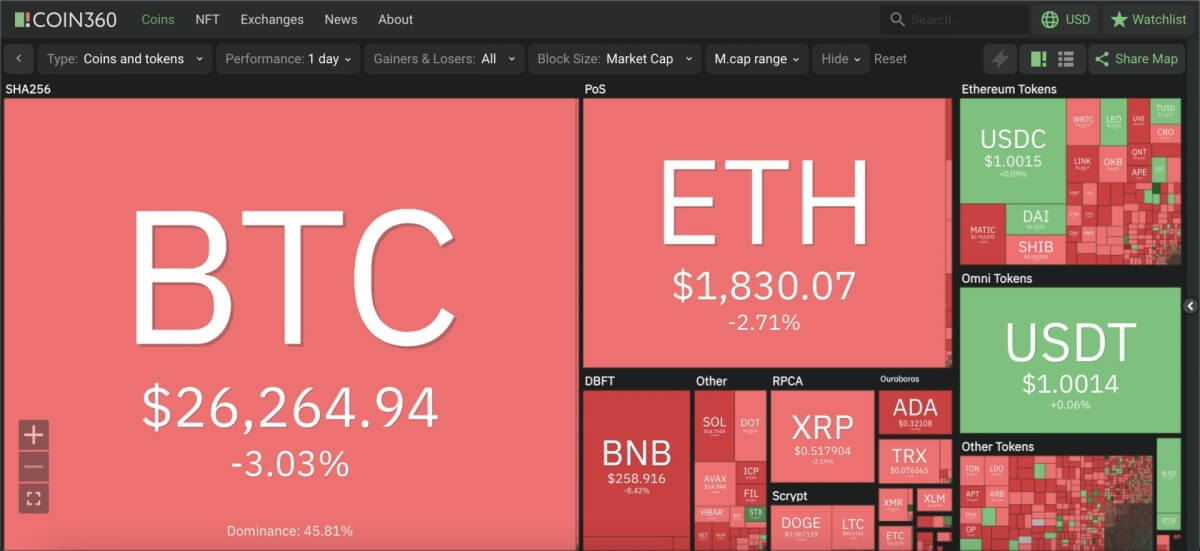
The larger cryptocurrency market also continued to trend downwards, as Bitcoin dropped to $26,200 with a 3 percent decrement, and Ethereum declined in a similar way to move down to $1,800. Among leading Altcoins, Ripple lost 2 percent to move down to $0.51, while Cardano dropped a massive 9 percent to move as low as $0.32. Additionally, Dogecoin moved down to $0.06 with a 4 percent dip, whereas Solana dipped 8 percent to $18.71.

Polkadot price analysis: 24-hour chart shows dominance of bearish indicators
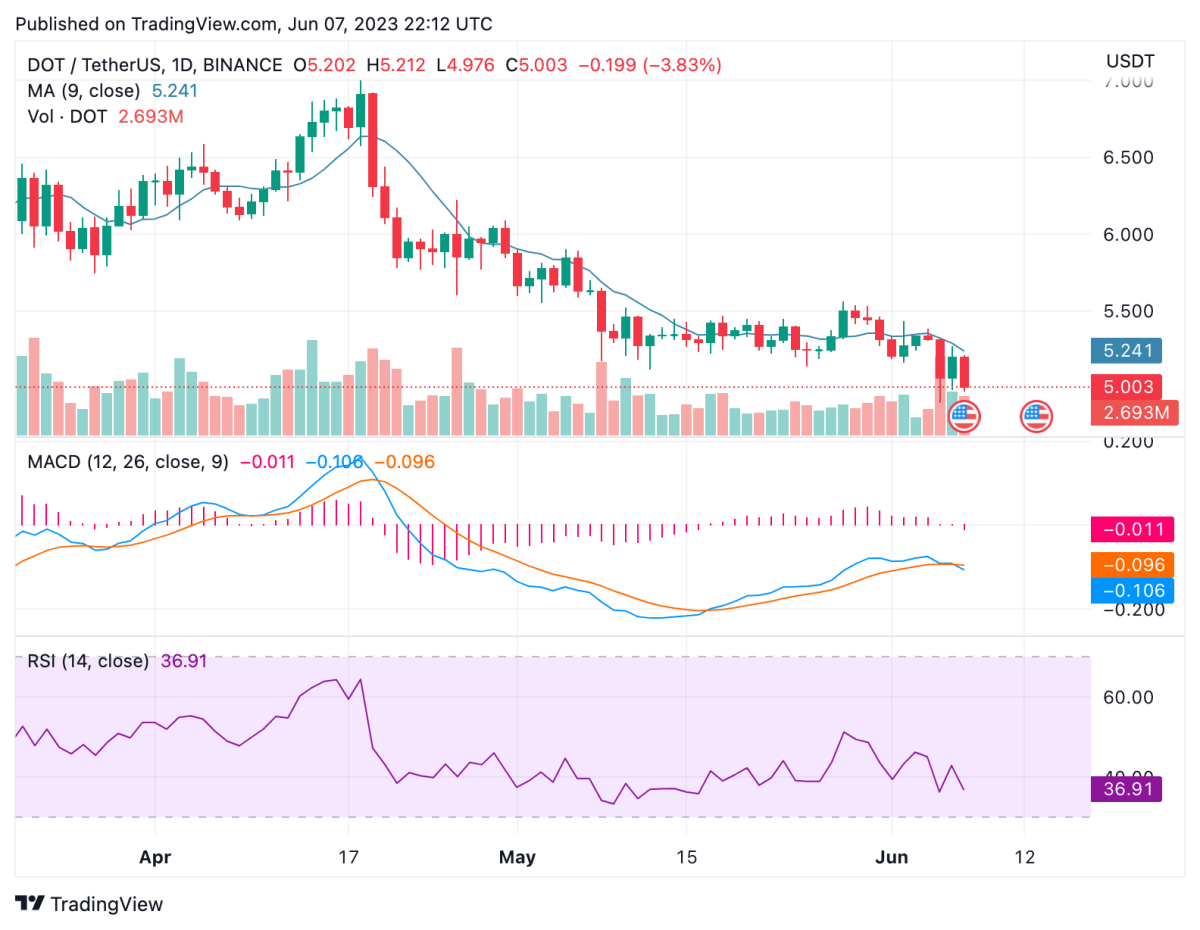
On the 24-hour candlestick chart for Polkadot price analysis, price can be seen making a significant dip in moving down to $4.90 over the past 24 hours. With the current price being the lowest this year, DOT has faced continued bearish sentiment in the market. With the latest move downward, DOT price has fallen below the 9 and 21-day moving averages, as well as the crucial 50-day exponential moving average (EMA) at $5.24.

The 24-hour relative strength index (RSI) can be seen lowering well into the oversold region after dropping down to 36. Earlier, the RSI had picked up to the 46 mark, indicating greater market valuation for DOT. Meanwhile, the moving average convergence divergence (MACD) curve also shows a bearish divergence taking place as the trend line moved below the signal line over the past 24 hours.
Disclaimer. The information provided is not trading advice. Cryptopolitan.com holds no liability for any investments made based on the information provided on this page. We strongly recommend independent research and/or consultation with a qualified professional before making any investment decisions.


