The latest Polkadot price analysis shows a bullish trend as an upward price movement has been recorded in the last 24 hours. The market has been following a bullish trend for the past few hours, and the price has significantly improved. The DOT/USD coin currently stands at $7.23 and has gained 6.61 percent since today’s opening.
The bearish pressure was seen the previous day when the coin dropped below the $6.73 level, but then it was able to break through this level and sustain above the same. Since then, there has been an increase in buying pressure that pushed the price back above this level.
DOT/USD 1-day price chart: Polkadot trades at $7.23 more as bulls continue the uptrend
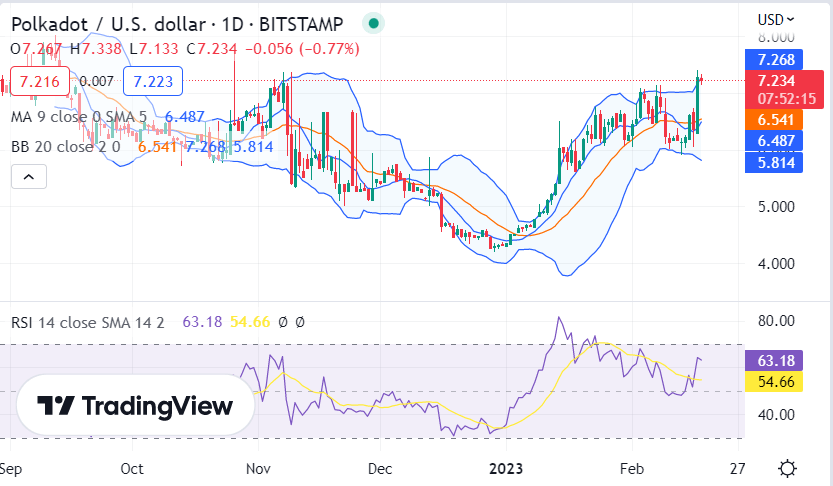
The one-day Polkadot price analysis confirms an upward trend for the crypto pair, as the bulls have been leading the price chart even today. The past week proved to be quite favorable for the sellers. However, Today the buying pressure is likely to stay intact as long as the pair remains above this level. The next resistance for the crypto pair lies at $7.39, and if it can break through this level, then we may see further gains in the coming days. Similarly, if there is a pullback from here, then support is likely to be found at the $6.73 level.

Meanwhile, the moving average (MA) value has been trading at $6.48 as well. The volatility is currently high, and with more buying pressure in the market. The Bollinger bands have also expanded, with upper Bollinger bands at $7.26, and lower Bollinger bands at $5.81. The Relative Strength Index (RSI) is currently near the overbought zone at 54.66, which suggests that buyers may take a backseat in this situation and allow the sell-off to begin soon.
Polkadot price analysis: DOT trades upwards as buyers remain in control
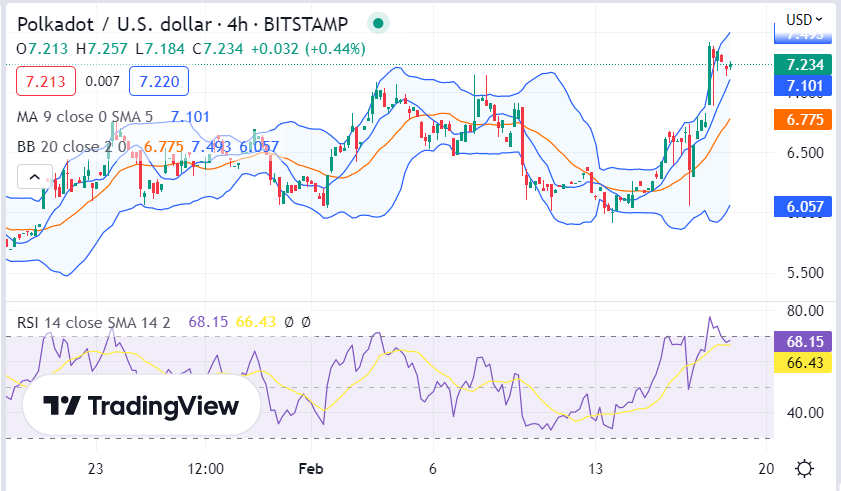
The 4-hour price chart for Polkadot price analysis shows the price has undergone a recovery today, but a correction was also observed at the end of the previous trading session. The buying momentum intensified today, and the buyers are now dominating the market as the price is moving upwards. The price has increased to $7.23, which is still at a higher point than its moving average, settling at the $7.10 mark.

If we discuss the Bollinger bands values, its upper value is at $7.49, and its lower value is at $6.10. The price has jumped above the Bollinger bands limits as bullish momentum is quite aggressive. The RSI curve shows an upward movement, and the score has increased to index 66.43 in the overbought region on the 4-hour chart.
Polkadot price analysis conclusion
The Polkadot price analysis shows that the price has significantly improved today. The price has increased up to $7.23 after undergoing constant upgradation for the past 24 hours. We expect the DOT to continue further upside today as the bullish momentum seems healthy.


