Today’s Litecoin price analysis shows the LTC/USD pair has been trading in a bearish market today. The bears have reduced the price from $94.09 to $88.11 in the morning session as of now. LTC/USD pair sought support at the $85.0 level as the prices breached the previous support levels at $92.00 and $90.00.The bears have managed to keep a grip on the market so far, as Litecoin is likely to break past this support level.
At the moment of writing, Litecoin is down by 7.60% and is trading at $89.06 with a market capitalization of around $6.4 billion. The 24-hour trading volume stands at $683 million, with the trading volume declining and rising by over 50 percent.
The technical chart shows that the LTC/USD pair is facing strong resistance at the $96.38 mark, and if this level is breached, then the prices could move up to the next resistance of $101.50. On the downside, there is strong support present at $85.00, which must be held for any kind of bullish move.
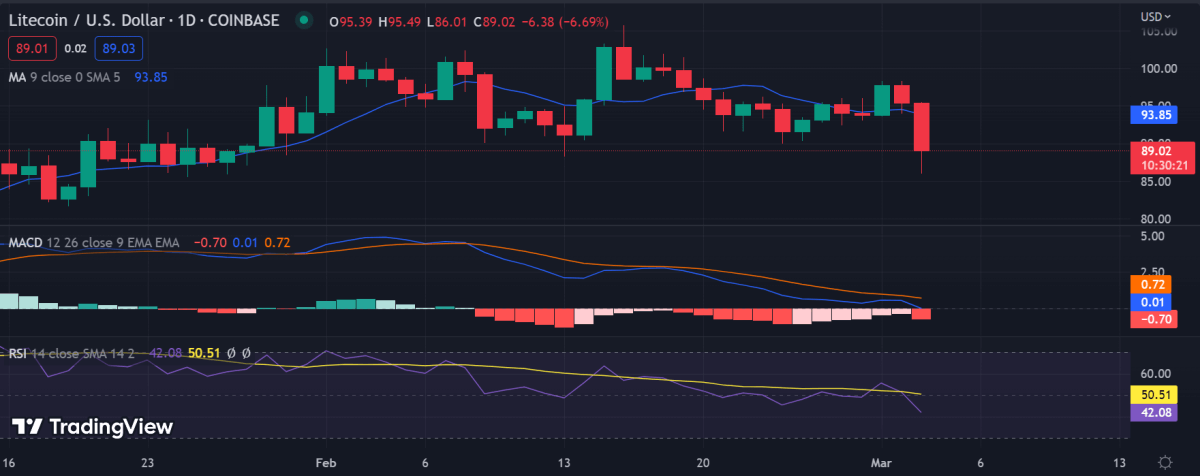
Litecoin price analysis 1-day chart: LTC falls sharply as Bears mount pressure
Litecoin price analysis indicates that the pair is down by 7.60% in the past 24 hours. The bears are in control of the market, as Litecoin is trading below the $90 level. The RSI indicator for LTC/USD pair is currently below the 50 level, which further indicates the bearish momentum in the market.

The MACD indicator is also in the bearish region, with the MACD line (blue) crossing below the signal line (red), which suggests that the bears are currently in control. In addition, the MACD line is below zero, which shows that the pair may continue to trade in a bearish trend in the next few hours.
The SMA 50 (blue) and SMA100 (red) are both below the current price of LTC, which suggests that the bears are in control. The volatility of the LTC/USD pair is also high, which shows that the prices may remain volatile in the near future.
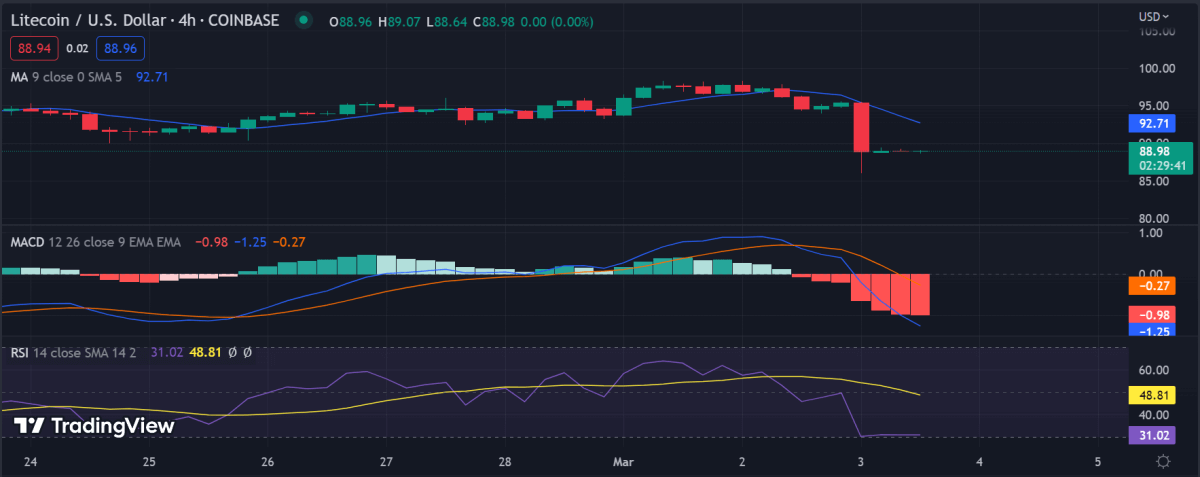
Litecoin price analysis 4-hour chart: Bears remain adamant in pushing prices lower
The 4-hour chart for Litecoin price analysis shows that the bears continue to dominate the market, with the LTC/USD pair trading below the $90 mark. The MACD is also in bearish territory, indicating a downtrend and suggesting further downside potential. The RSI indicator is currently at 39.21, which suggests that the market is oversold and could be due for a short-term bounce.

The SMA50 (blue) and SMA100 (red) are both below the price of LTC, and this shows that there is strong selling pressure from the bears. The volatility in Litecoin has also increased in the past 24 hours, which suggests that the prices could remain volatile in the short term.
The chart also indicates that LTC/USD pair is facing strong resistance at $96.38, and if this level is breached, then the pair could move up to the next resistance of $101.50. On the downside, there is strong support present at $88, and if the bears manage to break this level, then the prices could drop further.
Litecoin price analysis on a 4-hour chart suggests that the pair is currently trading at $89.06. The bears have managed to keep a grip on the market, as Litecoin is yet to break past its support of $88.11. With the sudden surge in the bearish momentum, the pair may likely continue to move downwards.
Litecoin price analysis conclusion
Litecoin price analysis shows that this crypto asset is trading on a bearish trend today as the prices fell sharply by 7.6%. The MACD shows that the momentum is bearish, and the 100 EMA line is below the long-term 200 EMA line. This indicates that there is strong selling pressure from the bears, and if this continues, then LTC could test its support level of $85.00. On the upside, there is strong resistance present at $96.38, and if this level is breached, then the prices could move up to the next resistance of $101.50.


