








Key takeaways:
- The average Sonic price prediction for 2026 is $0.04870.
- Holders can anticipate a maximum price of $0.1574 in 2029.
- By 2032, Sonic (S) might touch $0.2967
Sonic price prediction points to gradual but volatile upside: the average price could be around $0.03870 in 2026, with potential highs reaching $0.1574 in 2029 and possibly $0.2967 by 2032. For crypto investors, traders, and enthusiasts tracking Sonic (S), that makes the token a speculative play tied to both market sentiment and execution across its blockchain ecosystem.
Sonic is a high-performance EVM Layer 1 blockchain focused on DeFi, with fast transactions and sub-second finality. Formerly Fantom, it rebranded to Sonic in 2024 and has continued expanding its ecosystem and infrastructure.
After reaching its all-time high of $1.03 in January 2025, Sonic hit a low of $0.02768 in June 2026. Its outlook through 2032 depends on chart signals, ecosystem growth, network security, market sentiment, recent developments, and risk—factors that matter if you are deciding whether to invest, trade, or simply follow Sonic’s long-term potential.
Recently, Sonic Labs announced V2.2, which doubles smart-contract size limits and gives developers more capacity for application logic and features. Sonic Labs also said manual S mints had been cancelled, leaving automated validator emissions as the remaining issuance mechanism. Meanwhile, an October 15 airdrop claim milestone has put attention on upcoming S distributions.
Below, we break down Sonic price predictions from 2026 to 2032, along with technical analysis, historical sentiment, fundamentals, ecosystem and network developments, recent news, and the key risks behind the long-term outlook.
Sonic Price Prediction: An Overview
| Cryptocurrency | Sonic |
|---|---|
| Token | S |
| Price | $0.054136 |
| Market Cap | $154.48M |
| Trading Volume (24-hour) | $25.2M |
| Circulating Supply | 2.88B S |
| All-time High | Jan 05, 2025: $1.03 |
| All-time Low | Jun 25, 2026: $0.01915 |
| 24-hour High | $0.054356 |
| 24-hour low | $0.051482. |
Sonic (S) price prediction: Technical analysis
| Metric | Value |
|---|---|
| Current Price | $0.054136 |
| Price Prediction | $ 0.03134 (-24.86%) |
| Fear & Greed Index | 71 (Greed) |
| Sentiment | Bearish |
| Volatility | 18.59% (Very High) |
| Green Days | 15/30 (50%) |
| 50-Day SMA | $0.03210 |
| 200-Day SMA | $0.03494 |
| 14-Day RSI | 63.70 (Neutral) |
Sonic price analysis: S’s price has risen by 4.71%, as RSI indicates cooling momentum.
TL;DR Breakdown
- Today’s Sonic price analysis shows S has rallied by 4.71% on the daily chart to close at $0.054136.
- The token faces resistance at $0.060 following a recent rally and pullback
- The RSI is 61.19, while the MACD histogram turns slightly negative, as bullish momentum weakens.
On the daily chart, Sonic (S) has been showing renewed buying pressure as of October 19, 2026, with a 4.71% daily increase. The token opened at $0.051705, reached a high of $0.054356, and touched a low of $0.051482. It is currently trading at $0.054136 after a series of consolidation sessions.
Sonic price analysis on the 1-day chart: Buyers attempt to sustain recovery.
The daily Sonic price chart shows S has recovered from its earlier trading range around $0.040. The token rallied sharply around October 11th, briefly moving above $0.060 before pulling back. Recent candles have formed a consolidation pattern around $0.054, indicating that buyers are trying to consolidate the price after the rally.
The Relative Strength Index (RSI) is at 61.19, which is below its moving average of 62.99. The indicator is above the 50 neutral level, suggesting buyers still have some momentum. But its recent pullback suggests that bulls have lost their momentum.
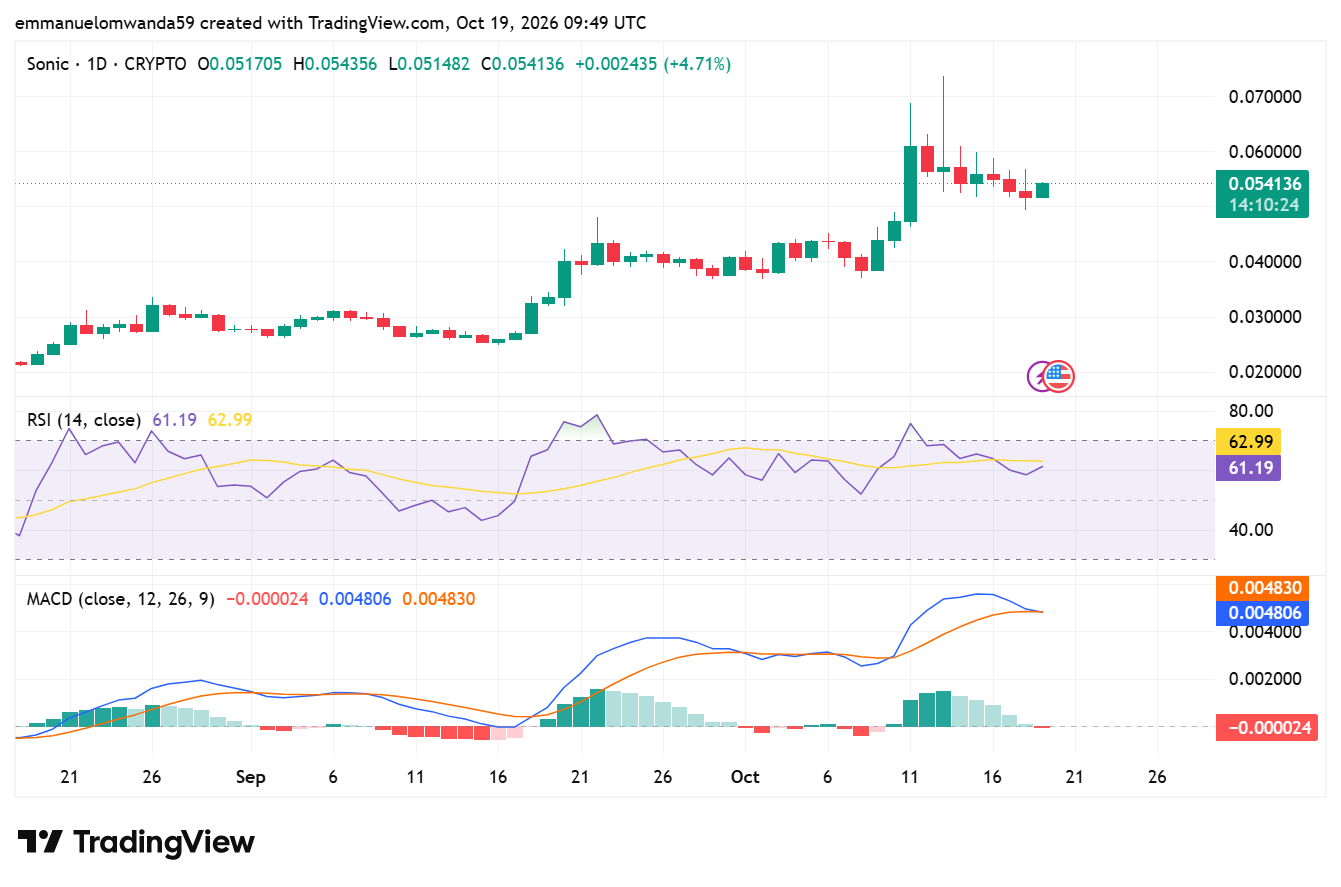
The MACD indicator also signals weakening momentum. The MACD line stands at 0.004806, slightly below the signal line at 0.004830. Its histogram reading is -0.000024, where the previous positive momentum is losing strength.
S faces immediate resistance at the recent highs of $0.060, where the recent rally encountered selling pressure. On the downside, the $0.0515 level provides a nearby level to watch based on the latest candle low. If the price climbs above $0.060, it could strengthen the recovery, but if it falls below $0.0515, it could expose S to further consolidation.
Sonic price analysis on the 4-hour chart
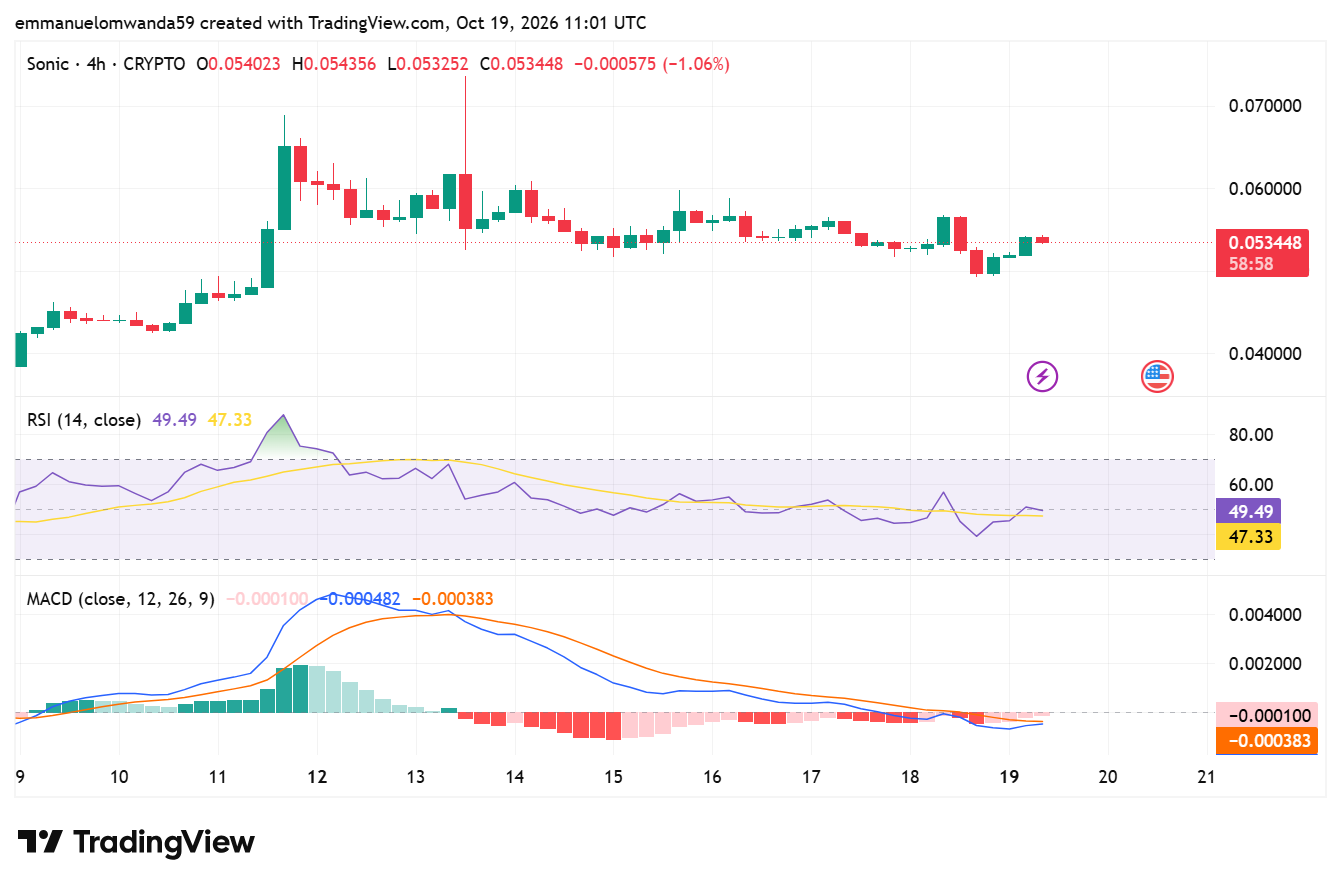
On the 4-hour chart, Sonic is trading sideways around $0.0534 after retreating from its recent highs above $0.060. The latest four-hour candle opened at $0.054023, reached $0.054356, and fell to $0.053252. The price is now near $0.053431, down by 1.10% for the candle.
The RSI is at 49.49, indicating neutral momentum, and buying and selling forces are evenly matched. The MACD is still in negative territory, and the histogram is also slightly negative. This suggests selling pressure has eased, but buyers have yet to establish a clear recovery.
Sonic is holding near $0.0530, while resistance sits around $0.0545. A move above resistance could support a short-term recovery, but a break below support may bring further selling.
Sonic technical indicators: Levels and action
Daily Simple Moving Average (SMA)
| Period | Value | Action |
|---|---|---|
| SMA 3 | $ 0.04345 | BUY |
| SMA 5 | $ 0.04297 | BUY |
| SMA 10 | $ 0.04185 | BUY |
| SMA 21 | $ 0.04098 | BUY |
| SMA 50 | $ 0.03357 | BUY |
| SMA 100 | $ 0.02862 | BUY |
| SMA 200 | $0.03375 | BUY |
Daily Exponential Moving Average (EMA)
Daily Exponential Moving Average (EMA)
| Period | Value | Action |
|---|---|---|
| EMA 3 | $ 0.04487 | BUY |
| EMA 5 | $ 0.04375 | BUY |
| EMA 10 | $ 0.04231 | BUY |
| EMA 21 | $ 0.03982 | BUY |
| EMA 50 | $ 0.03509 | BUY |
| EMA 100 | $ 0.03309 | BUY |
| EMA 200 | $ 0.04554 | BUY |
What can you expect from the Sonic price analysis next?
Sonic may continue consolidating around $0.0530 as buyers attempt to regain momentum. A break above $0.0545 could support a recovery toward $0.0560, while a drop below $0.0530 may expose the $0.0515 support zone. The RSI remains neutral, and the negative MACD reading suggests buyers have yet to confirm a stronger recovery.
Why is Sonic up today?
No confirmed catalyst has emerged, making the rally appear momentum-driven and vulnerable to a pullback if volume fades or S loses the breakout area.
Is Sonic a good investment?
For crypto investors, traders, and enthusiasts assessing whether S looks like a good buy, the key is to predict moves using a combination of technical indicators and fundamental factors, while remembering that macroeconomic trends such as inflation and regulatory developments can quickly change Sonic’s price.
Sonic is a high-speed, scalable blockchain platform that competes with established chains such as Solana and Ethereum L2s, positioning itself as a performance-focused chain within the blockchain ecosystem. This analysis looks at Sonic’s price outlook from 2026 to 2032, technical signals, historical sentiment, ecosystem and blockchain fundamentals, recent news, and the main investment risks that shape market direction.
While Sonic does not currently lead the market, it maintains a credible, stable mid-tier position, volatile Total Value Locked metrics, and weak user retention, despite recent price rebounds, which are an indication that execution risk remains. The Sonic (S) network is also transitioning from a community-driven layer-1 to a more structured corporate model, which investors should factor in before they invest. Own research and assessing personal risk tolerance are essential for anyone considering S as a potential investment opportunity.
Will Sonic reach $5?
The price of Sonic could reach $0.1215 by 2030, with price predictions suggesting a high of $0.1678. The base case scenario for Sonic’s price by 2030 is projected to be around $0.1215, with potential highs depending on market conditions. However, achieving this depends on market conditions, overall technical factors, and fundamental factors.
Will Sonic reach $10?
Based on our technical analysis of multiple technical quantitative indicators, S’s price projections for 2032 estimate a range, with Sonic expected to reach about $0.2967 but not approach double-digit prices within the next 6 years. A move to $10 is not guaranteed; even by 2046, Sonic is expected to reach $0.8797, still far below $10 and requiring over 25,386% upside to hit that mark.
Is Sonic a safe network?
Sonic is regarded as a secure blockchain platform whose architecture differs from traditional blockchains, using its unique Lachesis consensus mechanism to enable high-speed, scalable transactions. The Sonic Gateway is its native Ethereum bridge for cross-chain transfers.
Its directed acyclic graph approach helps deliver theoretical throughput of up to 10,000 transactions per second with finality in less than 500 milliseconds. The gateway includes a fail-safe mechanism so assets can be recovered on Ethereum if heartbeat confirmations stop for a set period. However, as with any blockchain network, users should exercise caution, use official channels, and follow best security practices to protect their assets, while this asset-recovery design reduces reliance on bridge infrastructure during downtime.
Does Sonic have a good, long-term future?
Sonic shows potential for a strong long-term future, with a long-term forecast framing price predictions for 2030 and beyond as scenario-based projections rather than guarantees. Analysts forecast that prices could reach between $0.1215 and the highest price of $0.1678, driven by its unique blockchain technology, increasing adoption in decentralized applications, support for app builders, and robust ecosystem growth. A 5% annual growth rate predicts Sonic Solana at $0.03 in 5 years.
Ecosystem growth, fueled by increased developer activity and more developers joining the platform, is crucial for Sonic’s long-term success. Total Value Locked (TVL) in dApps is a critical metric for long-term growth, reflecting real-world usage and platform strength, while on-chain activity is another key signal of fundamental health. Many traders also watch user growth, TVL, and on-chain activity because sustained participation supports the long-term case. Sonic’s ability to attract and retain users also matters for long-term growth. Sonic also continues airdrop campaigns and support for liquid staking tokens to help boost TVL and revenue generation.
Additionally, the Sonic ecosystem has established a $25 million fund to attract builders and improve user metrics, further supporting future expansion. Future ecosystem expansion may also benefit from plans to pursue a spot ETF and private investment vehicles on Nasdaq, though the long-term impact remains uncertain. However, market volatility remains a concern.
Recent news/opinion on Sonic (prev. FTM)
Sonic Labs announced that 32.69 million unclaimed S tokens from its first two airdrop rounds must be claimed by October 15, 2026, or they will be permanently burned. Claiming the tokens is now penalty-free, and the deadline is final, with no extensions or new token minting planned. Eligible holders should check their addresses on the official portal and claim their tokens soon to avoid losing potentially valuable allocations worth around €1.19 million in total. After the deadline, any remaining tokens can be burned by anyone through the contract, making this a critical deadline for holders.
Sonic has scheduled publication of an independent S supply audit by October 13, 2026. The audit concerns supply and reporting, not broader protocol security, so a clean result could reduce tokenomics uncertainty, while adverse findings would create a clear risk event
Sonic price prediction for October 2026
The Sonic price prediction for October 2026 suggests the token could extend its recovery if buying pressure continues. The price is expected to trade between $0.04200 and $0.05500, with an average price of around $0.04850
Market sentiment, trading volume, and broader crypto market conditions are expected to remain the main drivers of short-term price action. While a recovery is possible, a move below the projected range would reinforce the current bearish outlook.
| Period | Potential Low ($) | Average Price ($) | Potential High ($) |
|---|---|---|---|
| Sonic (S) price prediction October2026 | $0.04200 | $0.04850 | $0.05500 |
Sonic price prediction 2026
In 2026, Sonic (S) is expected to trade between $0.0400 and $0.0589, with an average price of around $0.04870. The forecast suggests Sonic could remain volatile throughout the year, with gradual recovery potential if ecosystem development and broader market sentiment improve.
Some bullish forecasts also point to a possible $0.11 to $0.13 range in 2026, though this article’s core model remains more conservative. Market conditions, particularly Bitcoin’s price, heavily influence altcoin performance.
| Period | Potential Low ($) | Average Price ($) | Potential High ($) |
|---|---|---|---|
| Sonic Price Prediction 2026 | $0.0400 | $0.04870 | $0.0589 |
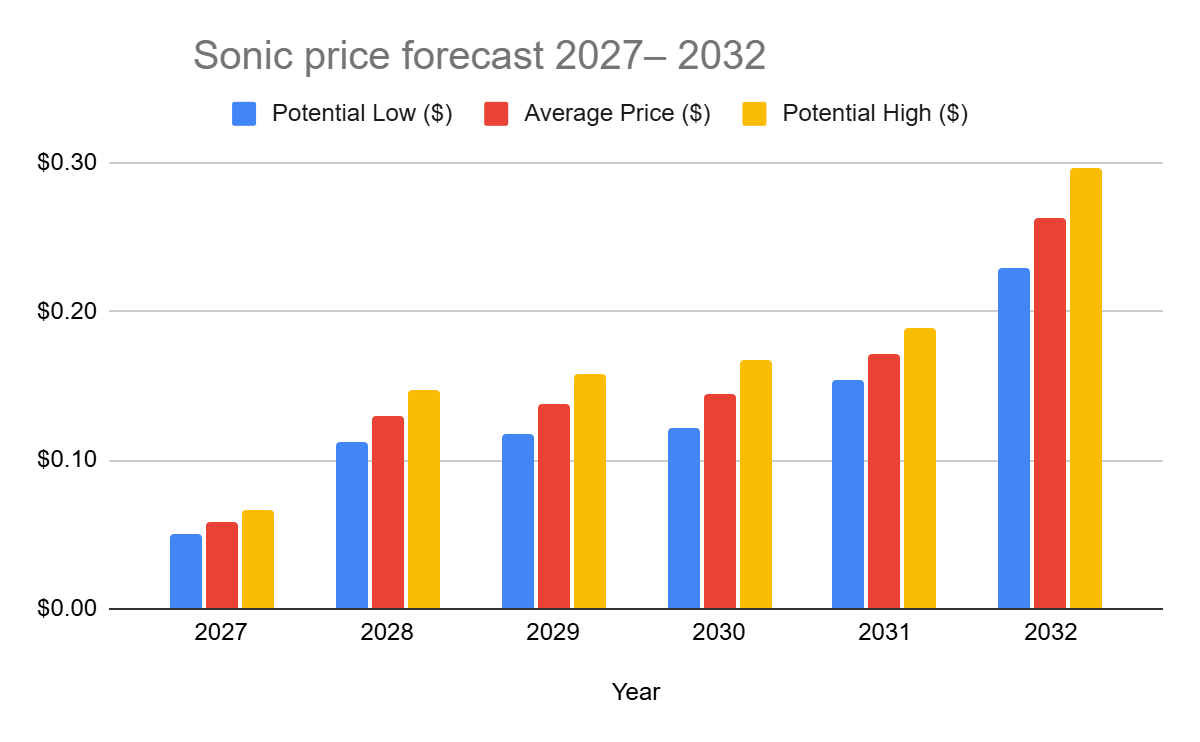
Sonic Price Forecast 2027–2032
| Year | Potential Low ($) | Average Price ($) | Potential High ($) |
| 2027 | $0.0499 | $0.0581 | $0.0662 |
| 2028 | $0.1128 | $0.1296 | $0.1465 |
| 2029 | $0.1169 | $0.1372 | $0.1574 |
| 2030 | $0.1215 | $0.1446 | $0.1678 |
| 2031 | $0.1545 | $0.1717 | $0.1889 |
| 2032 | $0.2285 | $0.2626 | $0.2967 |
Sonic (S) price prediction 2027
The Sonic forecast for 2027 speculates that the price might reach a maximum of $0.0662 by 2027. On the lower end, corrections may pull the price to $0.0499, with an expected average trading price of around $0.0581. As an alternate modeled scenario, the predicted price for 2027 could be around $0.03998, representing a potential 1.90% increase.
Sonic (S) price prediction 2028
Sonic’s (prev. FTM) 2028 forecast of $0.1128–$0.1465, averaging $0.1296, is linked to growing adoption of its rebranded ecosystem. By then, expanded DeFi, NFT, and gaming use cases are expected to strengthen utility and demand. The projected rise in Sonic’s price by 2028 is supported by its fee monetization model and transaction fees, which can reward developers, while the fee-burning mechanism helps support network sustainability by reducing token supply. Network scalability upgrades and rising developer engagement support gradual appreciation, while market cycles keep growth within range.
Sonic (S) price prediction 2029
In 2029, Sonic’s market price might stabilize at $0.3238 while attaining an average trading price of around $0.2698 and a minimum price of around $0.2158. The broader outlook points to $0.03250 by the end of 2026, $0.1464 by 2030, and $0.2327 by 2040, based on combined technical and fundamental factors.
Sonic (S) price prediction 2030
Sonic is expected to reach a maximum of $0.1678 by 2030. A more conservative long-range model calculated from historical trends puts Sonic near $0.09969 by 2030 as an alternate scenario. However, it could fall to $0.1215 with an average price of $0.1446.
Sonic (S) price prediction 2031
Sonic is projected to hit a high of $0.1889 in 2031. An alternate model suggests Sonic could gain 146.97% to $0.05425 by 2031, a percentage move that adds a more conservative upside case. Another projection places its 2031 range between $0.03445 and $0.1014. In the event of a price correction, it could drop to $0.1545 with an average of $0.1717, and reaching $0.1014 would imply a potential profit of about 291.26% from Sonic today.
Sonic (S) price prediction 2032
Sonic is expected to reach a high of $0.2967 in 2032. The average trading price is expected to be $0.2626, and the minimum price is projected to be $0.2285. However, this projected future performance is speculative, and actual future prices may differ significantly from these estimates.
Sonic market price prediction: Analysts’ FTM price forecast
| Firm Name | 2026 | 2027 |
|---|---|---|
| Coincodex | $0.0589 | $0.06573 |
| DigitalCoinPrice | $0.053189 | $0.0817 |
A price prediction tool can help compare these third-party estimates with your own model, though outcomes still depend on user input and market assumptions.
Cryptopolitan’s Sonic (S) price prediction
Our predictions show that Sonic (S) is expected to trade between $0.0400 and $0.0589, with an average price of around $0.04870. The forecast suggests Sonic could remain volatile throughout the year, with gradual recovery potential if ecosystem development and broader market sentiment improve. Investor confidence, along with supply and demand dynamics, plays a key role in Sonic’s price action, and macro conditions, regulatory changes, and investor decisions about whether to purchase or buy Sonic can also affect pricing. Governance and execution risks are essential to investor confidence in cryptocurrency projects.
Fundamental events such as hacks and other real-world occurrences can significantly impact price movements. Please note that the content provided on this page is for informational purposes only and does not constitute investment advice. No model can fully predict short-term moves tomorrow or next month. Conduct your own research before making financial decisions.
Sonic’s (S) historic price sentiment
- Fantom (FTM) launched in 2018 at $0.0182, hit a low of $0.00229 in 2020, and peaked at $3.24 in 2021 during the DeFi boom.
- Following the 2022 bear market, FTM recovered to $0.55 by early 2024 before rebranding to Sonic Labs in August 2024.
- The 1:1 FTM-to-Sonic (S) token swap began in December 2024, with Binance completing it by January 2025, as Sonic Labs focused on creating a stronger post-rebrand ecosystem Marchund S tokens.
- Sonic hit a new ATH of $1.029 in January 2025 but steadily declined to around $0.33 by late August.
- By early September 2025, Sonic traded stably between $0.3092 and $0.3126.
- In early September, Sonic traded around $0.309–$0.313, showing relative stability compared to its August lows.
- Mid-September – Price remained in the ~$0.30–$0.33 band, with minor upward drift toward ~$0.32.
- Sonic SVM traders often watch short-term support and resistance levels on the chart for potential short setups after sharp rebounds.
- Late September—The token approached $0.26, as reported by markets, showing a decline and increased volatility.
- Early October – Trading price dropped further into the ~$0.23–$0.26 range, indicating a weakening trend.
- By November 3, Sonic had fallen to approximately $0.122, marking a substantial decline from early September levels.
- At the beginning of November 2025, Sonic (S) traded around $0.12–$0.14, occasionally spiking to roughly $0.17 before retreating.
- Through mid-November, the price generally drifted downward, reaching a low near $0.10–$0.11 around November 21.
- From late November to December 3, S recovered slightly—trading in a narrow band around $0.10–$0.11, suggesting consolidation and stabilization after the mid-month slump.
- From early December, Sonic traded around $0.071–$0.075 on Dec 3–Dec 6, then moved higher through mid-December as the price climbed into the $0.085–$0.095 zone by Dec 14–Dec 17, reflecting increasing buying interest late in the year.
- Into late December and early January, S stabilized in the $0.07–$0.08 range before rising above $0.08, closing around $0.082–$0.086 by Jan 4, 2026, showing a modest recovery into the new year.
- On January 4, 2026, Sonic was trading near $0.086–$0.090 after stabilizing from December weakness, with modest rebounds in the first week of January as buyers emerged off key support levels.
- By February 3, 2026, Sonic had drifted lower toward roughly $0.065–$0.070, reflecting continued selling pressure and failed rallies, with price consolidating near the low end of its recent range.
- Sonic (S) traded around $0.052 to $0.048 between Feb 3 and Feb 10, 2026, before declining toward the $0.041 to $0.039 range by late February amid steady selling pressure.
- From early March to Mar 14, 2026, Sonic moved between $0.038 and $0.044 with a gradual rebound attempt as the price stabilized near the $0.040 support zone.
- From March 14 to late March, Sonic drifted lower from $0.0514 toward $0.040–$0.042, unable to sustain any meaningful bounces amid broad market weakness.
- By April 7, its price pressed critical $0.040 support at $0.0396–$0.0414—dangerously close to its all-time low of $0.0368 set on February 28.
- Sonic is trading at around $0.04951 at the start of May 2026.
- By the end of May 2026, Sonic had retreated to around $0.040, erasing much of its early-May gains after a failed rally above $0.055 and stabilizing near a key support zone amid continued selling pressure.
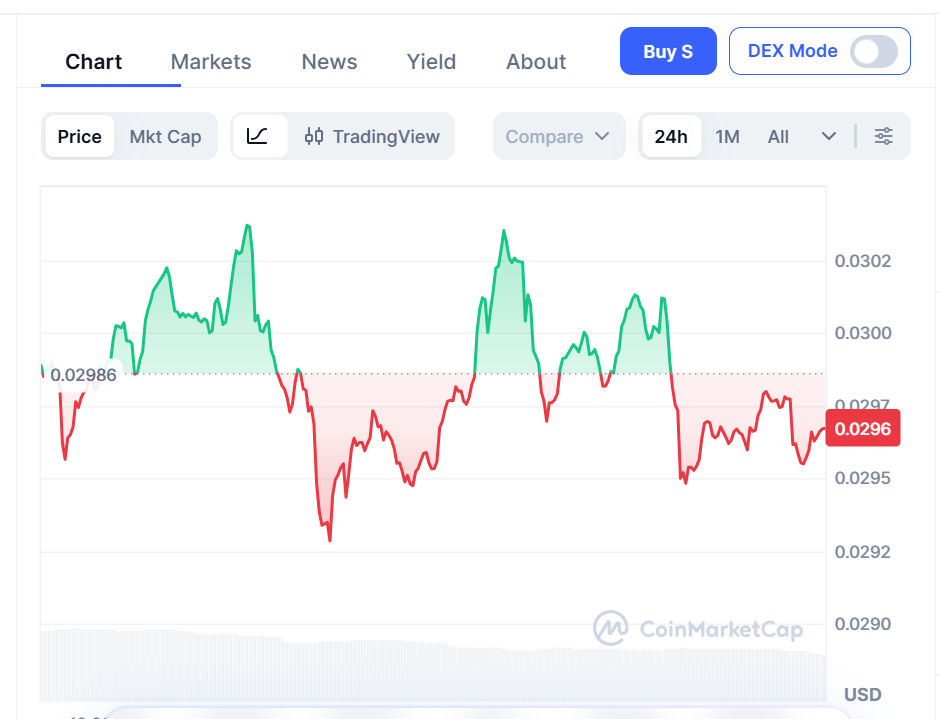
- By the last week of June, Sonic had recovered by 24.36% from its recent all-time low of $0.01915 on Jun. 25, 2026, marking a percentage recovery from that low.
- August 2026 kept the price in the $0.02–$0.03 area, while September 2026 later saw a reading around $0.02814.
FAQs
How does the scalability of Sonic compare to Bitcoin?
The Sonic network is highly scalable, unlike Bitcoin, which is built on a rigid blockchain. Scalability means enterprises do not have to compromise speed and cost for more operations. Sonic can scale thousands of nodes with the capability of completing 1000 transactions in a second.
What's the future for Sonic (prev. FTM)?
Sonic blockchain offers real utility and has the potential to rival Ethereum. Blockchains like Sonic and Solana have been predicted to dominate the future of Web 3.0.
Disclaimer. The information provided is not trading advice. Cryptopolitan.com holds no liability for any investments made based on the information provided on this page. We strongly recommend independent research and/or consultation with a qualified professional before making any investment decision.

Emman Omwanda
Emmanuel Omwanda’s expertise lies in cryptocurrency markets, spanning both fundamental and technical analysis. He previously worked with various crypto media sites before joining Cryptopolitan, including CoinEdition, The Crypto Basic, CryptoNews Flash, and DroomDroom.He holds a Bachelor of Science (BSc.) in Mathematics and Computer Science from Kenyatta University, Kenya, and is currently in his final year pursuing a Bachelor of Arts in Communication and Media Studies.