Skip to content
Open Search Modal
Crypto Converter
News
Business
Crypto
Tech
Economy
Op-Ed
Regulation
Learn
Courses
Investing
NTF’s
Tech
Pulse Room
Deep-Dive
Industry Thoughts
Interviews
Research
Thought Leadership
Price Predictions
Newsletter
Open Search Modal
Crypto Converter
News
Crypto
Economy
Regulation
Business
Tech
Op-Ed
Learn
Courses
Investing
NFT’S
Tech
Pulse Room
Deep-Dive
Industry Thoughts
Interviews
Research
Thought Leadership
Price Predictions
Newsletter
Follow US
Binance
X
Instagram
LinkedIn
CoinMarketCap
Telegram
Facebook
YouTube
Home
/
News
News
Elon Musk sides with Apple in OpenAI suit, trades new insults with Sam Altman on X
36 minutes ago
Tech
Congress prepares to challenge Chair Kevin Warsh as uncertainty over Fed policy grows
6 hours ago
Economy
Polymarket launches parlay-style trading in major prediction market overhaul
6 hours ago
Business
Why is the Nigerian stock market suddenly the best-performer globally?
7 hours ago
Economy
Bitcoin Policy Institute steps up as defendant in lawsuit to claim dormant BTC
8 hours ago
News
Vitalik Buterin says the AI jobs fight turns on what people mean by superintelligence
12 hours ago
News
live news & hot discussions
TUNE INTO
The loudest crypto insights in real time
Hedera exploit tops $5 million as stolen funds move to Ethereum
13 hours ago
News
Apple sues OpenAI for trade secret theft as Sam Altman’s company teases new hardware
14 hours ago
Tech
Robinhood expands autonomous trading with AI crypto agents
18 hours ago
News
OpenAI restores Codex, ChatGPT Work limits after traffic spike
18 hours ago
News
Housing bill with CBDC ban becomes law without Trump’s signature
19 hours ago
News
Lighter burns 15.6 million LIT as crypto’s buyback trend gathers pace
21 hours ago
News
OpenAI’s top safety chief leaves company as AI giant prepares for blockbuster IPO
22 hours ago
Tech
Trump has forced the Mag7 into bailing out Intel, but it’s not going the way he wants
22 hours ago
Tech
BEST COINS'26
TON
Explore
z
ZEC
Explore
BTC
Explore
Dogecoin (DOGE)
DOGE
Explore
HYPE
Explore
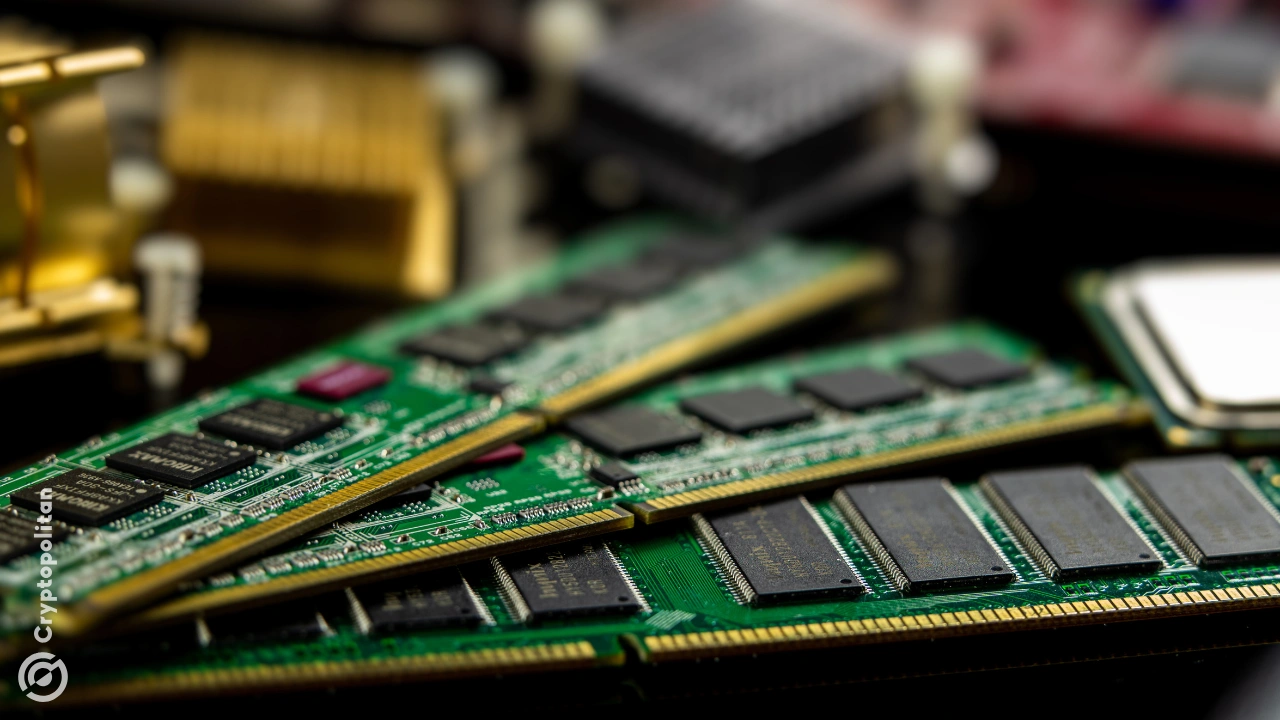
Wall Street can’t get enough AI as SK Hynix rallies massively in Nasdaq debut
22 hours ago
Tech
Tether reserve wallet sends 4 BTC to Binance as Q2 buying stalls
23 hours ago
News
LIVE: Trump says Iran is plotting to kill him again, but he has a plan
23 hours ago
Live Updates
Meta pulls Instagram AI image tool, testing limits of AI likeness scraping
July 11, 2026
Tech
Kraken to rebuild mobile app around AI trading agents
July 11, 2026
News
China is giving Manus to Tencent after blocking Meta’s attempted acquisition
July 10, 2026
Tech
Funds were never at risk: Injective dismisses npm package threat
July 10, 2026
News
Backpack opens 24/7 trading for real U.S. equities to overseas investors
July 10, 2026
News
Posts navigation
1
2
3
4
…
3,439
Next
Stay ahead in crypto
One sharp brief.
Every day.
SUBSCRIBE