


Best crypto insights delivered straight to your inbox.


Key takeaways
- Dash price prediction for 2025 could reach a maximum value of $27.82.
- By 2028, DASH could reach a maximum price of $94.43.
- In 2031, DASH will range between $234.36 to $283.25
Since entering the cryptocurrency space, Dash has held the attention of investors and crypto enthusiasts as a Bitcoin fork. It has been around for some years, and Dash Crypto has maintained an impressive performance all this while.
However, the price action in recent times has been unremarkable. Investors who are considering adding DASH to their crypto portfolio should ask the following questions: How high can DASH go? Will Dash (DASH) recapture its all-time high of $1,642?
Let’s get into the Dash price prediction for 2025 – 2031.
Overview
| Cryptocurrency | Dash |
| Token | DASH |
| Price | $20.66 |
| Market Cap | $260.94M |
| Trading Volume | $27.61M |
| Circulating Supply | 12.35M DASH |
| All-time High Date | $1,642.22 (Dec 20, 2017) |
| All-time Low Date | $0.2139 (Feb 14, 2014) |
| 24-h High | $21.5 |
| 24-h Low | $20 |
Dash price prediction: Technical analysis
| Metric | Value |
| Price Prediction | $ 21.91 (3.08%) |
| Volatility | 7.62% |
| 50-day SMA | $ 21.47 |
| 14-Day RSI | 42.93 |
| Current Sentiment | Bearish |
| Fear & Greed Index | 74(Greed) |
| Green Days | 16/30 (53%) |
| 200-Day SMA | $ 22.80 |
Dash price analysis: DASH slides 4.6% as bears test key support levels
- Strong resistance at $21.97 DASH repeatedly failed to break $21.97, confirming heavy selling pressure at that level.
- Critical support at $20.70 is testing $20.70; a breakdown could trigger further downside.
- The bearish trend is intact, and lower highs and lower lows across timeframes confirm sustained bearish control.
On July 30, 2025, Dash (DASH) traded at $20.66, posting a 4.61% decline over the past 24 hours. The price action remained under pressure as DASH moved away from its intraday high of $21.97 and approached the $20.70 support level. The sharp downturn pushed the token near key technical zones, indicating increased volatility and bearish sentiment in the short term. With the overall crypto market seeing mixed performance, DASH’s bearish momentum stands out as traders reassess positions near critical levels.
Dash 1-day technical outlook: DASH battles resistance as momentum weakens
On the daily timeframe, DASH is showing signs of sustained bearish momentum, with price action closing below the mid-range and testing the $20.70 support zone. The daily candlestick pattern suggests strong seller dominance, as the price rejected near $21.97, a notable resistance level. The rejection from that zone led to a continued slide throughout the session, forming lower highs and lower lows—typical of a descending structure. DASH is currently trading beneath the 20-day and 50-day moving averages, further validating short-term weakness.

The Relative Strength Index (RSI) is heading toward the oversold territory, hovering around 39, suggesting that bearish pressure still has room to push lower before a potential bounce. The MACD histogram has flipped negative, with its signal line confirming a bearish crossover. This alignment reflects a shift in momentum to the downside, with no immediate reversal signs. Volume has picked up slightly during the decline, reinforcing the strength behind the current downtrend.
Dash 4-hour price chart: DASH slides along the lower Bollinger band
On the 4-hour chart, DASH continues to reject near-term resistance zones with increasing downside pressure. The price has been rejected multiple times around the $21.50–$21.97 zone and is now gravitating toward the lower Bollinger Band. This signals prolonged selling pressure with limited recovery attempts during intraday moves.

Momentum remains weak as the RSI on the 4-hour timeframe trends below 30, while the MACD continues to diverge bearishly. Structure-wise, DASH consistently sets lower highs and lower lows, with sellers firmly in control. Unless the price can be reclaimed at $21.00 on substantial volume, short-term action remains tilted to the downside.
Dash technical indicators: Levels and action
Daily simple moving average (SMA)
| Period | Value | Action |
| SMA 3 | $ 21.81 | SELL |
| SMA 5 | $ 22.75 | SELL |
| SMA 10 | $ 23.49 | SELL |
| SMA 21 | $ 23.23 | SELL |
| SMA 50 | $ 21.47 | SELL |
| SMA 100 | $ 22.67 | SELL |
| SMA 200 | $ 22.80 | SELL |
Daily exponential moving average (EMA)
| Period | Value ($) | Action |
| EMA 3 | $ 22.37 | SELL |
| EMA 5 | $ 22.08 | SELL |
| EMA 10 | $ 21.97 | SELL |
| EMA 21 | $ 22.16 | SELL |
| EMA 50 | $ 23.55 | SELL |
| EMA 100 | $ 26.21 | SELL |
| EMA 200 | $ 28.29 | SELL |
What to expect from Dash?
With DASH trading at $20.66, just above the critical support level of $20.70, the short-term outlook remains bearish unless buyers reclaim lost ground quickly. A break below $20.70 could expose the asset to further downside risk, with the next potential support likely forming near the psychological $20.00 mark or lower.
On the upside, any recovery attempt must overcome stiff resistance at $21.97 to shift sentiment. A clean breakout above this level, supported by substantial buying volume, would be the first signal of trend reversal. However, without confirmation of sustained buying strength, lower highs and persistent rejection zones will likely keep DASH under pressure.
In the near term, sideways consolidation or further downside appears more probable, mainly if market-wide risk sentiment stays fragile. Traders may continue to monitor price action closely around $20.70 for signs of either a breakdown or a potential rebound.
Is Dash a good investment?
Dash (DASH) is trading 98.74% below its all-time high, currently at $20.66. While this may appeal to long-term value seekers, the token remains in a clear downtrend with no confirmed reversal.
DASH faces stiff resistance at $21.97 and hovers near key support at $20.70. Unless buyers reclaim control, short-term upside appears limited.
With reduced market visibility and intense competition from newer projects, Dash may not suit short-term traders. However, long-term investors with high risk tolerance could see current levels as a speculative entry point — if paired with strong risk management.
Why is DASH Down Today?
Dash (DASH) is down 4.61% today, trading at $20.66, primarily due to persistent selling pressure near key resistance at $21.97. The token failed multiple attempts to break above this level, triggering further downward movement as traders locked in profits and short-term momentum faded.
Broader market uncertainty has also contributed to the decline. With mixed sentiment across major cryptocurrencies, risk-averse conditions have led traders to rotate out of weaker altcoins. DASH’s inability to maintain support above mid-range levels on both daily and 4-hour charts has reinforced bearish sentiment, keeping the token under pressure as it approaches critical support at $20.70.
Will Dash Network reach $50?
Yes, DASH is projected to reach $50. By 2027, forecasts predict a minimum price of $55.18, showing that Dash can potentially exceed $50 during its growth trajectory.
Will Dash reach $100?
Yes, DASH is anticipated to reach $100. According to predictions for 2029, the cryptocurrency could minimum at $113.20, indicating a strong possibility of surpassing the $100 mark.
Does DASH have a good long-term future?
Dash has potential for a long-term future due to its established presence as one of the oldest cryptocurrencies. Features like InstantSend and PrivateSend enhance transaction speed and privacy, making it useful for certain users. Its successful partnerships and real-world use cases demonstrate its utility. Having traded as high as $1,600, DASH might recapture this price level in the future.
Recent news/opinion on Dash
Dash announced a mandatory network upgrade for January 7, 2025, at block height 2,201,472—an initiative led by Dash Core Group that will require coordination from all masternodes, miners, and users. This pivotal hard fork is designed to bolster transaction throughput and support emerging decentralized application trends, underscoring Dash’s dedication to innovation and stability despite ongoing SEC scrutiny.
Dash price prediction August 2025
The price of DASH in August is predicted to reach a minimum value of $21.66. Traders can anticipate a maximum value of $23.78 and an average trading price of $22.71.
| Period | Minimum Price | Average Price | Maximum Price |
| DASH price prediction August 2025 | $21.66 | $22.71 | $23.78 |
Dash price prediction 2025
The price of Dash is predicted to reach a minimum value of $18 in 2025. The Dash price could reach a maximum value of $27.82 with an average trading price of $25.31.
| Period | Minimum Price | Average Price | Maximum Price |
| Dash price prediction 2025 | $18 | $25.31 | $27.82 |
Dash price predictions 2026 – 2031
| Year | Minimum Price | Average Price | Maximum Price |
| 2026 | $35.15 | $36.42 | $41.78 |
| 2027 | $55.18 | $56.63 | $62.65 |
| 2028 | $77.86 | $80.69 | $94.43 |
| 2029 | $113.20 | $117.24 | $134.93 |
| 2030 | $162.37 | $167.06 | $194.02 |
| 2031 | $234.36 | $242.72 | $283.25 |
Dash price prediction 2026
In 2026, the price of Dash is predicted to reach a minimum level of $35.15. The DASH price can reach a maximum level of $41.78 with an average trading price of $36.42.
DASH price prediction 2027
The price of Dash is predicted to reach a minimum value of $55.18 in 2027. The Dash price could reach a maximum value of $62.65 with an average trading price of $56.63.
Dash price prediction 2028
The Dash price is forecast to reach a minimum price of $77.86 in 2028. According to the findings, it could reach a maximum possible level of $94.43, with an average forecast price of $80.69.
Dash prediction 2029
By 2029, experts predict that DASH will start the year at $113.20 and trade around $134.93.
Dash price prediction 2030
The lowest Dash price will be between $162.37 and $194.02, and the most likely Dash price will be steady at around $167.06 by the end of 2030.
Dash price prediction 2031
In 2031, the price of Dash is expected to reach a minimum value of $234.36. It can reach a maximum value of $283.25 with an average value of $242.72.

Dash market price prediction: Analysts’ DASH price forecast
| Firm | 2025 | 2026 |
| DigitalCoinPrice | $46.07 | $53.96 |
| Coincodex | $ 23.47 | $ 27.66 |
Cryptopolitan’s Dash price prediction
Cryptopolitan’s Dash analysis suggests the token’s minimum price will be $18 with an average of $25.31, and a maximum of $27.82 in 2025. Looking ahead, our predictions for 2026 indicate more significant growth, with the token’s price ranging from $35.15 to $41.78.
Dash historic price sentiment
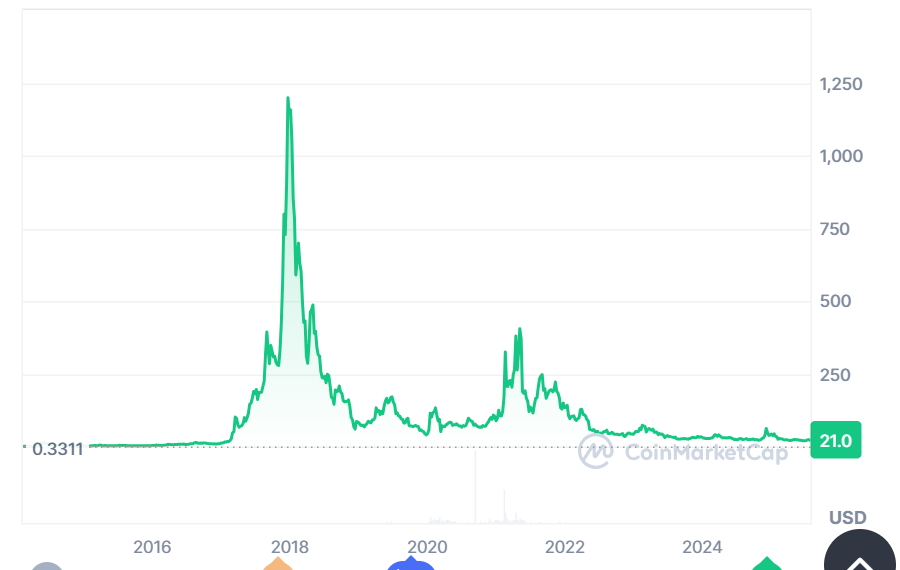
- Dash, launched in January 2014, initially traded below $1 per coin. It gained attention for its innovative two-tier network featuring miners and masternodes.
- During the 2017 cryptocurrency bull run, Dash’s price surged, reaching an all-time high of approximately $1,642 in December 2017. Following this peak, the market experienced a correction, and by the end of 2018, Dash’s price had fallen significantly.
- In 2020, as the cryptocurrency market began to recover, Dash’s price increased to above $150, though it did not return to its previous all-time high.
- In 2021, Dash experienced more significant price recoveries, reaching a peak price of $478. However, at the turn of 2022, the entire market was hit by a bearish wave, which took DASH to as low as $30.60.
- In 2023, Dash started the year at around $42.05, peaked at $77.21, and hit a low of $22.60 before closing the year at $31.78.
- In 2024, Dash saw fluctuations, with a high of $71.01 and a low of $19.23, ending the year at $37.91.
- As of January 2025, it’s trading at approximately $40.01, showing a slight recovery.
- In February, Dash was priced around $23, continuing its sideways movement seen since late 2024.
- The price declined slightly to approximately $22 in March, and further dipped to $21 in April.
- During May, Dash held steady around $20.5, with minimal volatility.
- In June, the price fluctuated mildly, reaching $20.8, before settling at approximately $21.0 by July 2025.
FAQs
Is Dash a decent cryptocurrency to invest in?
Dash's value is projected to climb further as scarcity encourages price increases. Please keep in mind that each investment involves some risk. Simply invest with what you can live without and do your own research.
How high can DASH rise?
In 2032, the price of Dash is expected to be a maximum of $1,238.07.
How does InstaSend work?
Dash was the first digital currency to offer secure instant transactions based on the masternode network. Unlike conventional blockchains, where it is necessary to wait for transaction confirmation in a block, Dash leverages the network of masternodes to validate that the funds specified in the transaction have not already been spent and then locks them within 1-2 seconds so they cannot be paid again until the transaction is complete. Any transactions attempting to use the same funds will be rejected by the network, even in the case of a 51% attack.
What are Masternodes?
Masternodes were invented as a unique feature of the Dash network and form a second layer used to ensure the blockchain is readily available to all network participants. Masternodes also perform several other functions related to the health and efficiency of the network, such as governance, securely storing user data, processing transactions for light wallets, and facilitating instant and private transactions.
Disclaimer. The information provided is not trading advice. Cryptopolitan.com holds no liability for any investments made based on the information provided on this page. We strongly recommend independent research and/or consultation with a qualified professional before making any investment decisions.

Brian Koome
Brian Koome has over seven years of experience in blockchain and cryptocurrency reporting, having been active in the industry since 2017. He has contributed to leading publications, including BlockToday.com. Further, he developed the Ethereum 101 course for BitDegree.org before joining Cryptopolitan as a full-time writer. Brian covers evergreen guides (EGs), deep dives, interviews, and price analysis. His focus on DeFi, blockchain innovation, and emerging crypto projects delights readers.


CRASH COURSE
- Which cryptocurrencies can make you money
- How to boost your security with a wallet (and which ones are actually worth using)
- Little-known investment strategies that the pros use
- How to get started investing in crypto (which exchanges to use, the best crypto to buy etc)