TL;DR Breakdown
- Chainlink price analysis is bullish today.
- Support for LINK is present at $14.
- Resistance LINK/USD is found at $15.5.
The most recent Chainlink price analysis is bullish for today, and it backs buyers, who have seen a substantial recovery since night. Although the bears were in control of the price chart by lowering the coin value previously, recent progress has been in favor of bulls. This is a positive indicator for cryptocurrency because the price is once again approaching $15.2.
The first resistance to be overcome will be $15.2, which is exactly where it ended today’s trading session last week. Above that level we find EMA50, at $15.5, followed by EMA100 and SMA200 at $17, and SMA100 just below at $16.76, and SMA50 at $15.18.
The most recent trend line is solid but support exists in the form of EMA20 at around $14.45, while the lowest point on this time frame is marked by EMA120 at roughly 10 cents.
There are also two more support zones, these being at $13.45 and $12 respectively. The first is bolstered by EMA20 while the second has both SMA50 and 100 in its favor. We shall conclude this Chainlink price analysis with a note that the cryptocurrency’s price will likely find resistance at $14 after attempting to breach the previously mentioned levels.
The most recent trend line is solid but support exists in the form of EMA20 at around $14.45, while the lowest point on this time frame is marked by EMA120 at roughly 10 cents.
LINK/USD 1-day price chart: Price upgrades up to $15.2 after revival
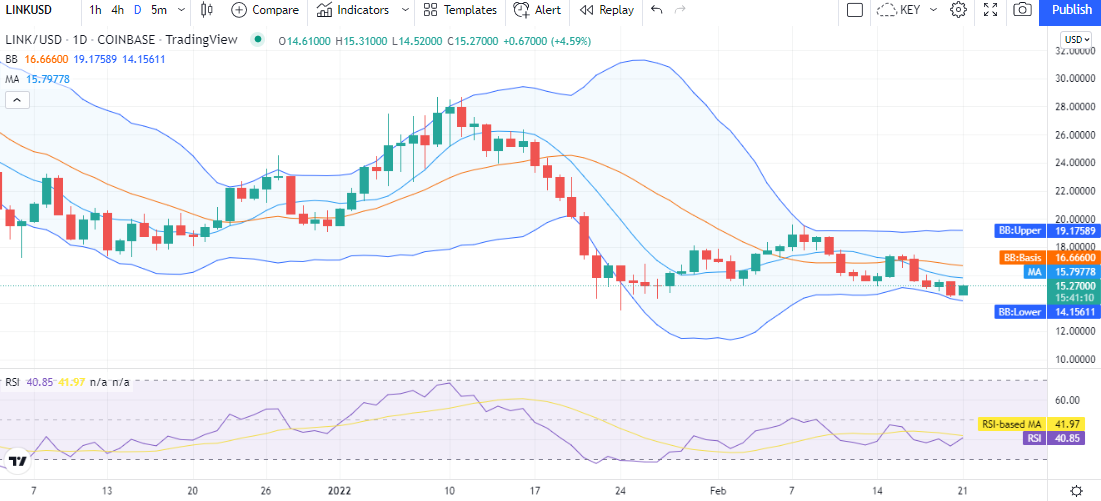
The daily Chainlink price analysis shows a bullish inclination as the buying activity has been on the rise today. Earlier, a downward wave dominated the market as the bulls were facing strong resistance from the bearish side, and the coin is still at a loss of 2.86 percent for the past week. But now, it seems that the price trends are once again changing in favor of the buyers. The coin value has been enhanced up to the $15.2 mark gaining 3.42 percent value overnight. The price is still at a lower point than its moving average (MA) value which is at $15.79.
 LINK/USD 1-day price chart. Source: TradingView
The volatility for LINK is increasing as the Bollinger bands show slight divergence with the upper limit of the volatility indicator at $19.1, representing resistance for the coin’s price function, and the lower band is at the $14.1 mark, representing support for LINK.
The relative strength index (RSI) is found at index 40 in the lower half of the neutral zone. The RSI slope is still upwards steeply, indicating the buying activity in the market.
Chainlink price analysis: Recent developments and further technical indications
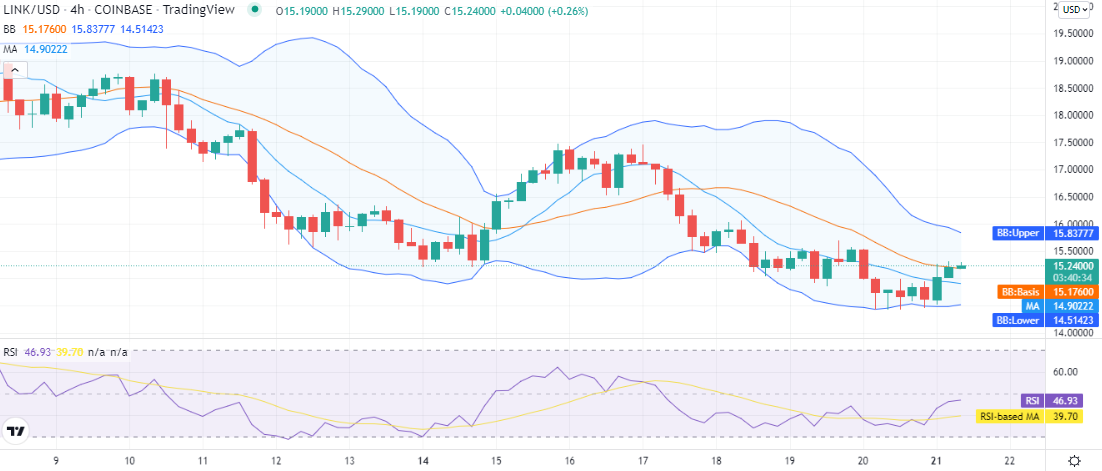
The price of Chainlink has been rising in a bullish trend since the past 12 hours, according to the four-hour Chainlink price analysis. The presence of green candlesticks overtime on the four-hour price graph indicates that cryptocurrency value is increasing. The bull advance has reached $15.2 and will almost certainly challenge the resistance at $15.2 in this trend.
The most recent 24-hour Chainlink price analysis shows that LINK has been trading in a bullish wave for the past 24 hours, with upward price movements being made almost all day. The cryptocurrency climbed from $14 to reach a high of just over $15 in the last 12 hours before dropping slightly again, but the coin’s value remains above $15.
 LINK/USD 4-hour price chart. Source: TradingView
The green candles on the four-hour Chainlink price graph indicate that cryptocurrency is rising against most of its counterparts, and the buying activity has increased compared to 24 hours ago. The Bollinger bands are beginning to show divergence with the upper limit of their indicator at $18.4, which means the bullish wave is gaining momentum for LINK.
The relative strength index (RSI) indicator line shows that LINK’s price has risen so quickly it reached overbought levels, but now the RSI indicator reads at 50 which means that LINK’s value continues to be in a neutral zone between 30 and 70 points.
Chainlink price analysis: Conclusion
The first support level is $13.00, which is bolstered by EMA20 and the second one is $12. The first has SMA50 and 100 on its side while the latter includes both SMA50 and 100 in its arsenal of tools. After attempting to break through the aforementioned levels, Chainlink’s price will most likely encounter resistance.
Disclaimer. The information provided is not trading advice. Cryptopolitan.com holds no liability for any investments made based on the information provided on this page. We strongly recommend independent research and/or consultation with a qualified professional before making any investment decisions.


