 bitcoin price analysis 14 july
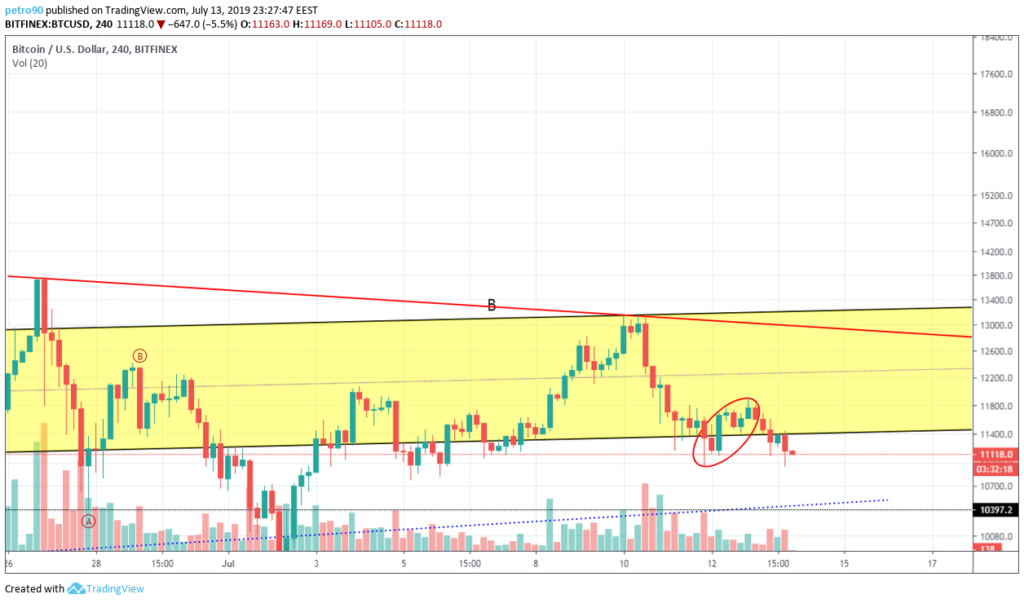
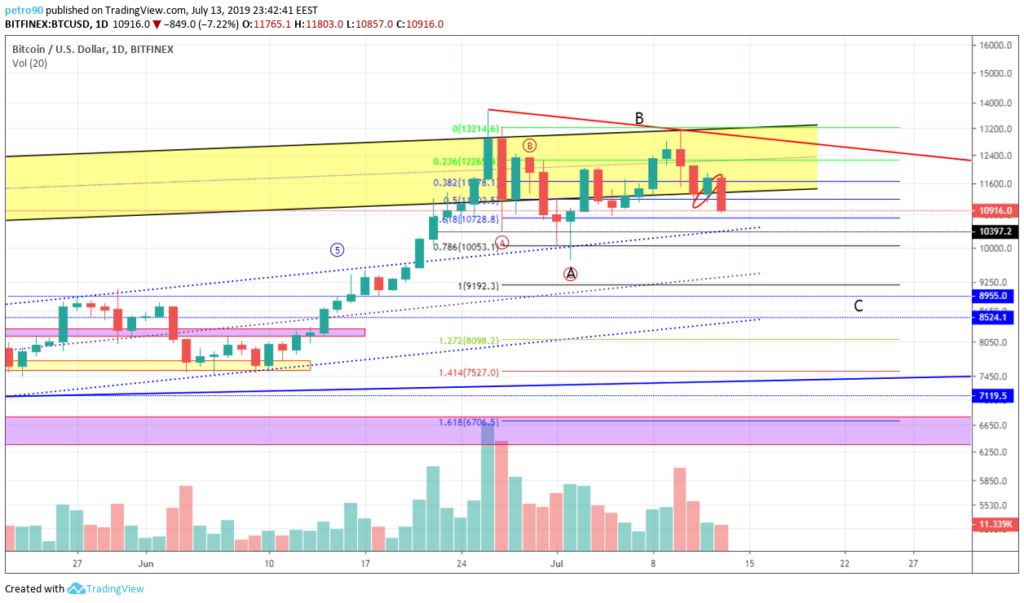
Bitcoin price data analysis today will be done in a less poetic way. The buyers tried to push Bitcoin ( BTC) price above the thirteen thousand one hundred dollars ($13100) mark.
However, they were unable to hold the price in the yellow area of the graph (given below). Bitcoin (BTC), in the 4 hourly timescales, has shown not being able to be lifted despite the efforts of the buyer, which the buyers themselves gave up on.
 Bitcoin price chart by Trading View
The buyers’ commitment to keeping the price aloof the lower of the yellow area’s boundaries was not shown when the graph is assessed for volume checks. The buyers have lost heart with Bitcoin now residing at a price mark of ten thousand four hundred dollars ($10,400).
This support line seems to be breaking as well if the buyers kick in. this critical point getting broken, will enable the buyers to check out the nine thousand dollars ($9000) to the nine thousand two hundred ($9200) range as the next support lines.
The buyers seem cranky now, and the can’t be blamed. They are not trading in bulk as they were when, initially, the price started to fall- proposed by a price consolidation on the graph.
 Bitcoin price chart by Trading View
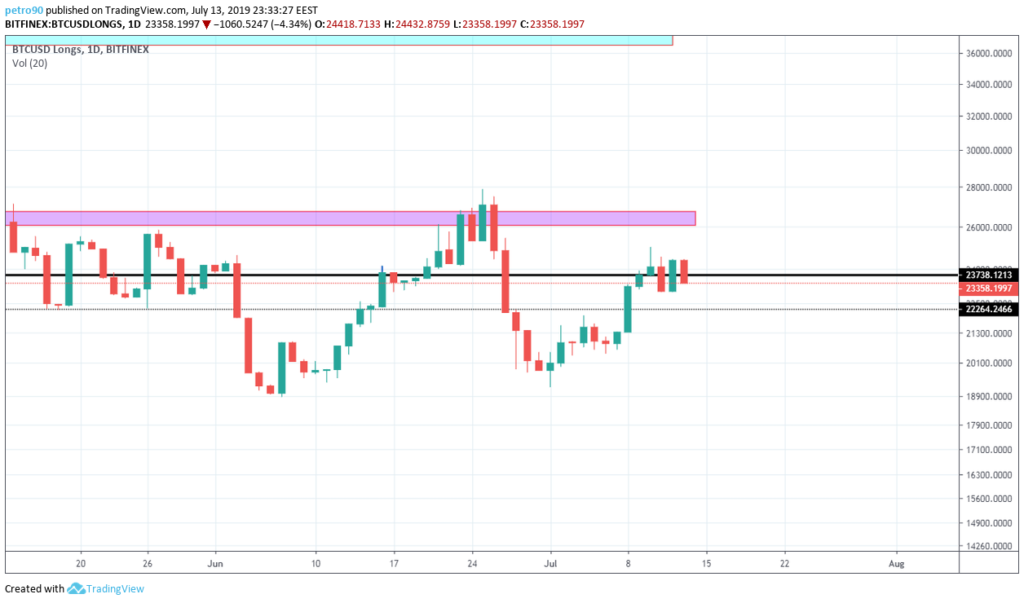
Mark 33 on the graph says it all. The buyers were fearful yesterday of the number as shown.
Today seems like a good day to get out there in the field and show them bitcoins, as to who owns the market as today’s results stopped at the mark labeled, 65.
The sellers are trying to get a part of the action too, however, the incident on 11th of July 2019 has deep-seated consequences, even yet:
 Bitcoin price chart by Trading View
The correction formation wave, on analysis, gives the wave (C ) as the new wave lying near the nine thousand two hundred dollar mark ($9,200) equal to the wave (A).
 Bitcoin price chart by Trading View
The weekly time frame portrays that the buyers are in a real tough spot. The sellers have been at it again for the third week this time. Pins, sixteen percent (16%) to twenty percent (20%) above the candle tell us that correction is crucially needed.
The lower bounds to look at right now are clear, the ten thousand four hundred dollars ($10,400) mark and the nine thousand two hundred dollars ($9,200) mark sketch a range for an analysis to work over.
