Algorand Price Prediction 2024-2033
- Algorand Price Prediction 2024 – up to $0.3513
- Algorand Price Prediction 2027 – up to $1.04
- Algorand Price Prediction 2030 – up to $3.01
- Algorand Price Prediction 2033 – up to $8.23
Will Algorand rise to its former glory? Let us explore the coin projections for 2024 to 2033.
How much is Algorand worth?
The current Algorand price is $0.1919. Here are more statistics at press time:
| 24 Hour Trading Volume | $50 million |
| % change in 24 hours | -1.26 |
| Market Capitalization | 1.56 billion |
| Circulating supply | 8,133,114,310 |
| Maximum supply | 10,000,000,000 |
Algorand price analysis
TL; DR Breakdown
- ALGO is up 4.67% in the last 12 months.
- It broke below $0.2 this month.
In 2023, ALGO turned bullish in October and peaked at $0.32 in March.
ALGO price analysis 1-day chart
ALGO has registered positive growth over the last 12 months, rising by 4.67%. The coin has however lost 24% of its value in the last 30 days.
ALGO is gradually rising this week, a trend that closely mirrors Bitcoin, which recently rose above $66,000. The MACD shows positive momentum, while the Relative Strength Index (RSI) is neutral, suggesting no impending reversal.
ALGO/ USD 4-hour price chart
ALGO recovery in 2023 helped it break above $0.2, rising as high as $0.32. It, however, corrected falling below the mark. The MACD shows little momentum, with the RSI at 59.93.
What to expect from ALGO price analysis next?
ALGO had positive growth from October 2023. The gains extended until 2024. In the charts, the coin turned negative last month but is correcting.
Is ALGO a good investment?
The ALGO token is one of the most versatile tokens with crypto. The coin is payment-ready; you can use it to pay for transaction fees and purchase on-chain NFTs on the Algorand blockchain. ALGO is also used to secure the platform and reward ecosystem governors. Our CP Price Prediction section will show how the coin will gain value in years to come.
Recent News
The Algorand FOundation is calling out to Python programmers to explore the blockchain ecosystem. Famous for data analysis, the Python language is finding applications in the blockchain arena, a factor that Algorand is seeking to exploit. The foundation introduced a month-long Python coding challenge with 100 unique completion NFTs up for grabs.
Algorand Price Prediction 2024-2033
Algorand ALGO Price Prediction by Cryptopolitan
| Year | Minimum Price | Average Price | Maximum Price |
| 2024 | 0.34 | 0.35 | 0.42 |
| 2025 | 0.51 | 0.53 | 0.60 |
| 2026 | 0.77 | 0.80 | 0.91 |
| 2027 | 1.14 | 1.17 | 1.38 |
| 2028 | 1.67 | 1.72 | 1.97 |
| 2029 | 2.42 | 2.49 | 2.86 |
| 2030 | 3.45 | 3.55 | 4.24 |
| 2031 | 4.87 | 5.02 | 5.92 |
| 2032 | 7.32 | 7.57 | 8.28 |
| 2033 | 10.21 | 10.59 | 12.70 |
Algorand Price Prediction 2024
ALGO will trade at the $0.35 mark on average. It will rise above $0.4 at its peak to reach $0.45. It will, however, drop below the mark, reaching $0.34 at its lowest.
Algorand Price Prediction 2025
Algorand’s price will trade at the $0.53 mark on average. It will rise above $0.55 at its peak to reach $0.60. It will, however, drop below the mark, reaching $0.51 at its lowest.
Algorand Price Prediction 2026
ALGO will trade at $0.80 on average. It will rise above the 2025 resistance at its peak to reach $0.91. It will, however, drop below the mark, reaching $0.77 at its worst.
Algorand Price Prediction 2027
ALGO will trade at the $1.17 mark on average. It will however drop below the mark, reaching $1.14 at its lowest.
Algorand Price Prediction 2028
ALGO will trade at $1.72 on average. It will rise above the previous resistance at its peak to reach $1.97. It will, however drop below the mark, reaching $1.67 at its lowest.
Algorand Price Prediction 2029
ALGO will trade at the $2.49 mark on average. It will rise to $2.86 at its peak. It will, however, drop below the mark, reaching $2.42 at its lowest.
Algorand Price Prediction 2030
ALGO will trade at the $3.55 mark on average. It will rise to $4.24 at its highest. It will, however drop below the mark, reaching $3.45 at its worst.
Algorand Price Prediction 2031
ALGO will trade at the $5.02 mark on average. It will rise above $5.5 resistance at its peak to reach $5.92. It will, however drop below the mark, reaching $4.87 at its lowest.
Algorand Price Prediction 2032
ALGO will trade at the $7.57 mark on average. It will rise above $8 at its peak. It will, however, drop below the mark, reaching $7.32 at its worst.
Algorand Price Prediction 2033
The ALGO price forecast is an average if will trade at the $10.59 mark on average. It will rise above $12 at its peak. It will, however, drop below the mark, reaching $10.21 at its lowest.
Algorand Price Predictions by WalletInvestor
The platform gives Algorand a past performance index rating of C and adds that ALGO would make a bad one-year investment. It will average at $0.12 next year. The platform provides predictions in terms of return on investment (ROI). The ROI is negative over the entire period and is in double digits. It ranges from -49% to -81% annually.
Algorand Price Predictions by CryptoPredictions
The site scans a coin’s exchange prices and other historical crypto market data and analyses it to provide Algorand price forecast. The CryptoPredictions platform is bullish on ALGO. The maximum price for the entire period is $0.8214.
Algorand Price Predictions by Digitalcoinprice
Digitalcoinprice is also bullish. It will break the $1 resistance in 2027 and $3 in 2032. Closer home, the coin average price will range between $0.51 and $0.59 in 2025. The maximum price for the period 2024-2033 is 4.61.
Algorand Predictions By Industry Experts
Algorand forecast by Binance, a leading crypto exchange, are bullish on ALGO over the next six years. The coin growth from the current price is modest, with 2030 averaging at $0.3159. The average will cross $0.2475 in 2025.
Algorand Overview
| CIRCULATING SUPPLY | POPULARITY | ALL-TIME LOW | ALL-TIME HIGH |
| 8,082,296,037 | #59 | $0.08761 | $3.28 |
ALGO Price History
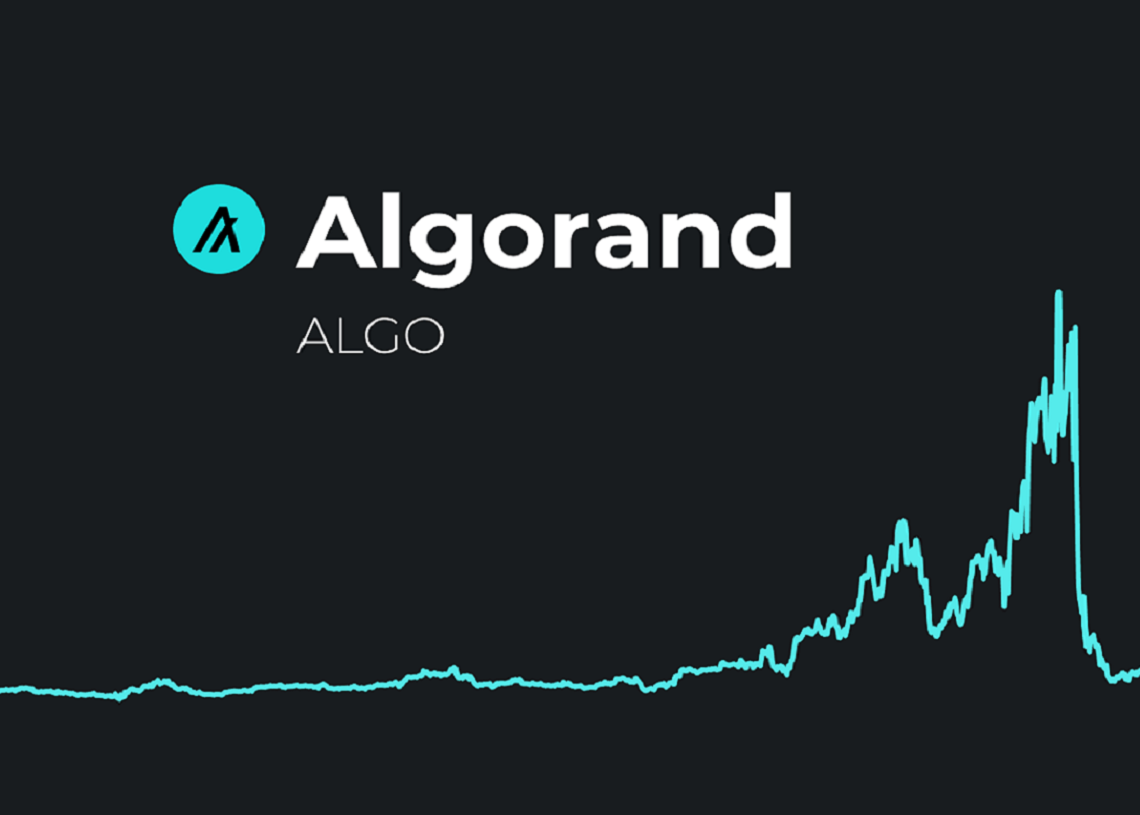
Since its inception, the Algorand chart has resembled a volcanic mountain highlighting its volatility over the years.
ALGO first traded at $3.15, according to Coinmarketcap, but the initial hype quickly subsided. Four months later, it dropped below the $0.3 mark. It had earlier registered its highest price at $3.28 in April.
The 2021 bull run helped the coin recover, reaching its highest at $2.38 in September. Nothing prepared the coin for the 2022 crypto winter. The coin plummeted throughout the year and registered its lowest price at $0.087 in September 2023.
Source: Coinstats Algorand Price Chart (ALGO)
More on Algorand
The Algorand price today has largely been affected by the market sentiment rather than its use cases. Its use cases, however, ensure a steady flow of investors who buy and sell Algorand depending on their needs.
Algorand has established applications in several fields that faster blockchain transactions at low costs compared to other blockchains like Ethereum and Bitcoin.
The healthy associations of multiple organizations on the Algorand platform have enabled significant steps in the fields of
- Global financial technology,
- Decentralized smart contract exchange,
- Private Investing Platforms
- Digital Securities Exchanges
- Financial asset governing through Decentralized Autonomous Organizations, DAO
- Crypto lending solutions, among others.
Four Algorand key functionalities at the layer one level
- Algorand standard assets that can represent fungible and non-fungible assets
- Smart contracts – stateless and stateful implementation
- Atomic transfers – support all Algo and standard assets and allow for multi-party transfers.
- Rekeying – the ability to change one’s private spending key without changing the public key.
Algorand is a forkless chain, as there is enough flexibility built into the layer one protocol that this will be sufficient to allow for any future developments.
The Algorand network can process up to 1 million transactions a day and does so quickly. The charges on the ALGO coin are fair. This is one reason most investors pitch their tents at the Algorand camp. Silvio Micali founded Algorand.
What determines the price of Algorand?
How high can the ALGO price go? What is your idea? Factors responsible for the price of Algorand include:
- Tech Updates
With every update in the technological offerings on Algorand, investors, marketers, and enthusiasts will show more interest in it. Needs and wants to draw people. If there is an update to anything, it will improve its appeal.
- Partnerships
Partnerships bring more extension and exposure. A partnership is always good for every venture, even in crypto. Since the foundation runs Algorand, it will have meaningful and impressive partnerships that will move the platform forward. Looking at the rate with which Algorand Foundation strikes partnerships, it is on the road to improvements.
With more partnerships, this platform is sure to draw people in. The consequential effect will be an impressive boost for cryptocurrency.
- Decentralization
If there is one area where blockchain technology has the upper hand over traditional operations, decentralized finance (DeFi) is introduced. DeFi is already famous and has drawn attention. Platforms keying into this innovation are the talk of the town. DeFi products have several applications that enhance each protocol, making it more usable and satisfactory.
Conclusion
Among the popular cryptocurrencies, Algorand has been dubbed the Ethereum killer, but Avalanche seems to be fairing better. The blockchain system offers cheap and fast transactions compared to Ethereum – this has been Algorand’s central selling point.
Developers are also beginning to prefer Algorand for building smart contracts. With Algorand’s expertise, users can deploy blockchains that fit their application needs or virtual machines that dictate precisely how the blockchain should operate.
Despite losing a considerable chunk of its valuation in the first half of 2023, Algorand continues to steal Ethereum’s cryptocurrency market share by making significant strides in the entire crypto ecosystem, especially in the last three months. Still, it remains unlikely that it will surpass Ethereum by market capitalization.
Algorand is forecasted to recover beyond 2024, with market sentiment expected to affect its volatility levels. Before making investment decisions in ALGO, conduct own research.


