


Best crypto insights delivered straight to your inbox.

Key takeaways
- VeChain price projection suggests a peak price of $0.008402 by 2026.
- Traders can expect a minimum price of $0.018272 and a maximum price of $0.033129 by 2029.
- By 2032, VeChain’s price could potentially surge to $0.075150.
VeChain initially marketed itself as a blockchain network to provide transparency and efficiency to real-world applications enhancing customer trust, providing real-time tracking of goods and items across supply chains and preventing counterfeiting. The main focus of the chain was to track products from their creation to their delivery to the end-consumer as well as provide verification. However, as any good tool, VeChain and its aim have evolved since its launch in 2018.
With global trends shifting towards a greener, a more environment friendly future, VeChain has expanded its focus towards the same. VeChain now offers sustainability incentives, a digital identity as well as rewards environmental friendly actions through its programs. To prove its dedication to the cause, it introduced VeBetter, a Web3-powered ecosystem that rewards users with B3TR tokens for engaging in eco-friendly habits. VeBetter acts as a DAO-governed marketplace for sustainability-focused apps.
With growing optimism around the VeChain ecosystem, especially following recent collaborations with Walmart and other major partners, VeChain is positioning itself as one of the leading blockchain networks for real-world utility and sustainability-focused innovation.
VeChain overview
| Cryptocurrency | VeChain |
| Symbol | VET |
| Price | $0.005105(-2.%) |
| Market Cap | $439 Million |
| Trading Volume (24-h) | $17.15 Million |
| Circulating Supply | 85.98 Billion VET |
| All-time High | $0.2782, Apr 17, 2021 |
| All-time Low | $0.001678, Mar 13, 2020 |
| 24-h High | $0.00527 |
| 24-h Low | $0.005002 |
VeChain price prediction: Technical analysis
| Market Sentiment | Bearish |
| 50-Day SMA | $0.00681 |
| 200-Day SMA | $0.00889 |
| Price Prediction | $0.00469(-3.09%) |
| Fear & Greed Index | 22.64 (Extreme Fear) |
| Green Days | 9/30 (30%) |
| 14-Day RSI | 19.28(Neutral) |
VeChain price analysis: VET falls to $0.00510
TL;DR Breakdown:
- VeChain price analysis shows fall to $0.00510
- Cryptocurrency lost 2.% of its value in 24 hours
- VeChain coin finds support at $0.0045
VeChain (VET) current price analysis for 17 June shows strong bearish movement across the last few days as the price fell to the $0.00470 mark. Now, the price made a run to $0.00500 before crumbling to $0.00510
VeChain 1-day price chart: VET falls to $0.00510
VeChain (VET) price action shows a bearish week as the price dropped from the highs of $0.006800 mark to the $0.004700 mark where it found support. Since then, the price recovered to $0.00550 but struggled to maintain the trend. As a result, VET fall back toward the $0.00510 mark.

The Relative Strength Index (RSI) falls to 38.77, with the slope showing declining momentum as the price moves back towards $0.00600. The indicator leaves low room for volatile movement in downwards direction. Meanwhile, the Bollinger Bands suggest high volatility, with the bands converging across the past few days.
VeChain 4-hour price chart: VET shows neutral momentum
VeChain (VET) live price trades at $0.005105 on the 4-hour chart, showing slight recovery in recent hours.

The Relative Strength Index (RSI) stands at 49.06, showing a slight bearish market sentiment as VET hovers around $0.005100. The Bollinger Bands are converging and show support and resistance levels at the $0.004933 and $0.005403 levels respectively.
VeChain technical indicators: Levels and action
Daily simple moving average (SMA)
| Period | Value | Action |
|---|---|---|
| SMA 3 | $ 0.005175 | SELL |
| SMA 5 | $ 0.005128 | BUY |
| SMA 10 | $ 0.005003 | BUY |
| SMA 21 | $ 0.005334 | SELL |
| SMA 50 | $ 0.006368 | SELL |
| SMA 100 | $ 0.006745 | SELL |
| SMA 200 | $ 0.008385 | SELL |
Daily exponential moving average (EMA)
| Period | Value | Action |
|---|---|---|
| EMA 3 | $ 0.005185 | SELL |
| EMA 5 | $ 0.005138 | SELL |
| EMA 10 | $ 0.005134 | SELL |
| EMA 21 | $ 0.005405 | SELL |
| EMA 50 | $ 0.006055 | SELL |
| EMA 100 | $ 0.006918 | SELL |
| EMA 200 | $ 0.009324 | SELL |
What to expect from VET price analysis?

Vechain price analysis showed a sharp decline across the past few days as the price fell from the $0.006800 mark. VET found support at the $0.005400 mark, before it crumbled causing a decline to the $0.004700 mark. Since then, the price has slightly recovered to $0.00510 but struggles in climbing higher.
Overall, Vechain suggests that the price may rise towards $0.005500 as it attempts to climb towards the $0.006000 mark. However, if the bulls are unable to hold the $0.00500 level and establish support above $0.005200 mark, VET may fall to the $0.004600 level.
Is Vechain a good investment?
VeChain, as a notable blockchain project, stands out among crypto tokens in cryptocurrency because it focuses on supply chain management and enterprise solutions, which is not considered financial advice. VeChain operates on a dual-token model with two tokens: VET and VTHO. VET tokens are used for staking and governance, while VTHO is used to pay for transaction fees and smart contract execution. Users expend VET to participate in the network, and writing data to the blockchain is managed through VTHO, separating the cost of data submission from the value of VET. Smart contracts play a crucial role in automating business processes and enhancing trust, increasing transparency and efficiency in global trade.
With partnerships with major companies and a strong emphasis on real-world applications, many believe VeChain is a good buy due to its significant growth potential. Its innovative use cases and practical implementations appeal to businesses seeking operational improvements, making it an attractive option for informed investors.
However, it is advised to do your own research and conduct experts opinion before investing in the volatile market.
Why is VET down?
VeChain (VET) price shows that the bulls found support at $0.00450 level causing a rise to the $0.00550 mark before falling back to $0.00510.
Will VeChain recover?
VeChain has experienced a notable selloff in the last thirty days, with the price falling from near the $0.03 mark to its highest price of the period to the current $0.021 level. However, industry analysts suggest that this downturn in the financial markets may not be long-term, a sentiment shared by many VET holders. Most projections indicate that VeChain could regain strength as market conditions improve, with expectations for the asset to potentially close the year between the $0.035 and $0.05 price levels.
Will VeChain reach $0.05?
Analysts suggest VeChain could attain $0.05 by 2031, as the minimum price is projected to be $0.0434 and the average price at $0.0500, as per the VET price prediction 2031. with a potential peak of $0.0585.
Will VeChain reach $0.10?
VET is expected to trade above $0.10 by 2035.
Does VET have a good long-term future?
VET has a good long-term future due to its strong use cases, growing on chain activity, and active development team at the Vechain Foundation.
Recent news/opinion on Vechain
Vechain’s recently revealed its Roadmap for 2026 including key information regarding planned developments including full Ethereum compatibility.
VeChain price prediction June 2026
In June 2026, the price of VeChain is anticipated to reach a minimum of $0.00410. The VET price can be expected to peak at $0.00620, maintaining an average of $0.00510 by the end of the month.
| Month | Minimum Price ($) | Average Price ($) | Maximum Price ($) |
| June | 0.00410 | 0.00510 | 0.00620 |
VeChain price prediction 2026
In 2026, the price of the VeChain coin is anticipated to touch a minimum of $0.003831, reflecting the current VeChain sentiment. The VET price might peak at $0.008402, maintaining an average of $0.005317 by the end of the year.
| Year | Min. Price ($) | Average Price ($) | Maximum Price ($) |
| 2026 | 0.003831 | 0.005317 | 0.008402 |
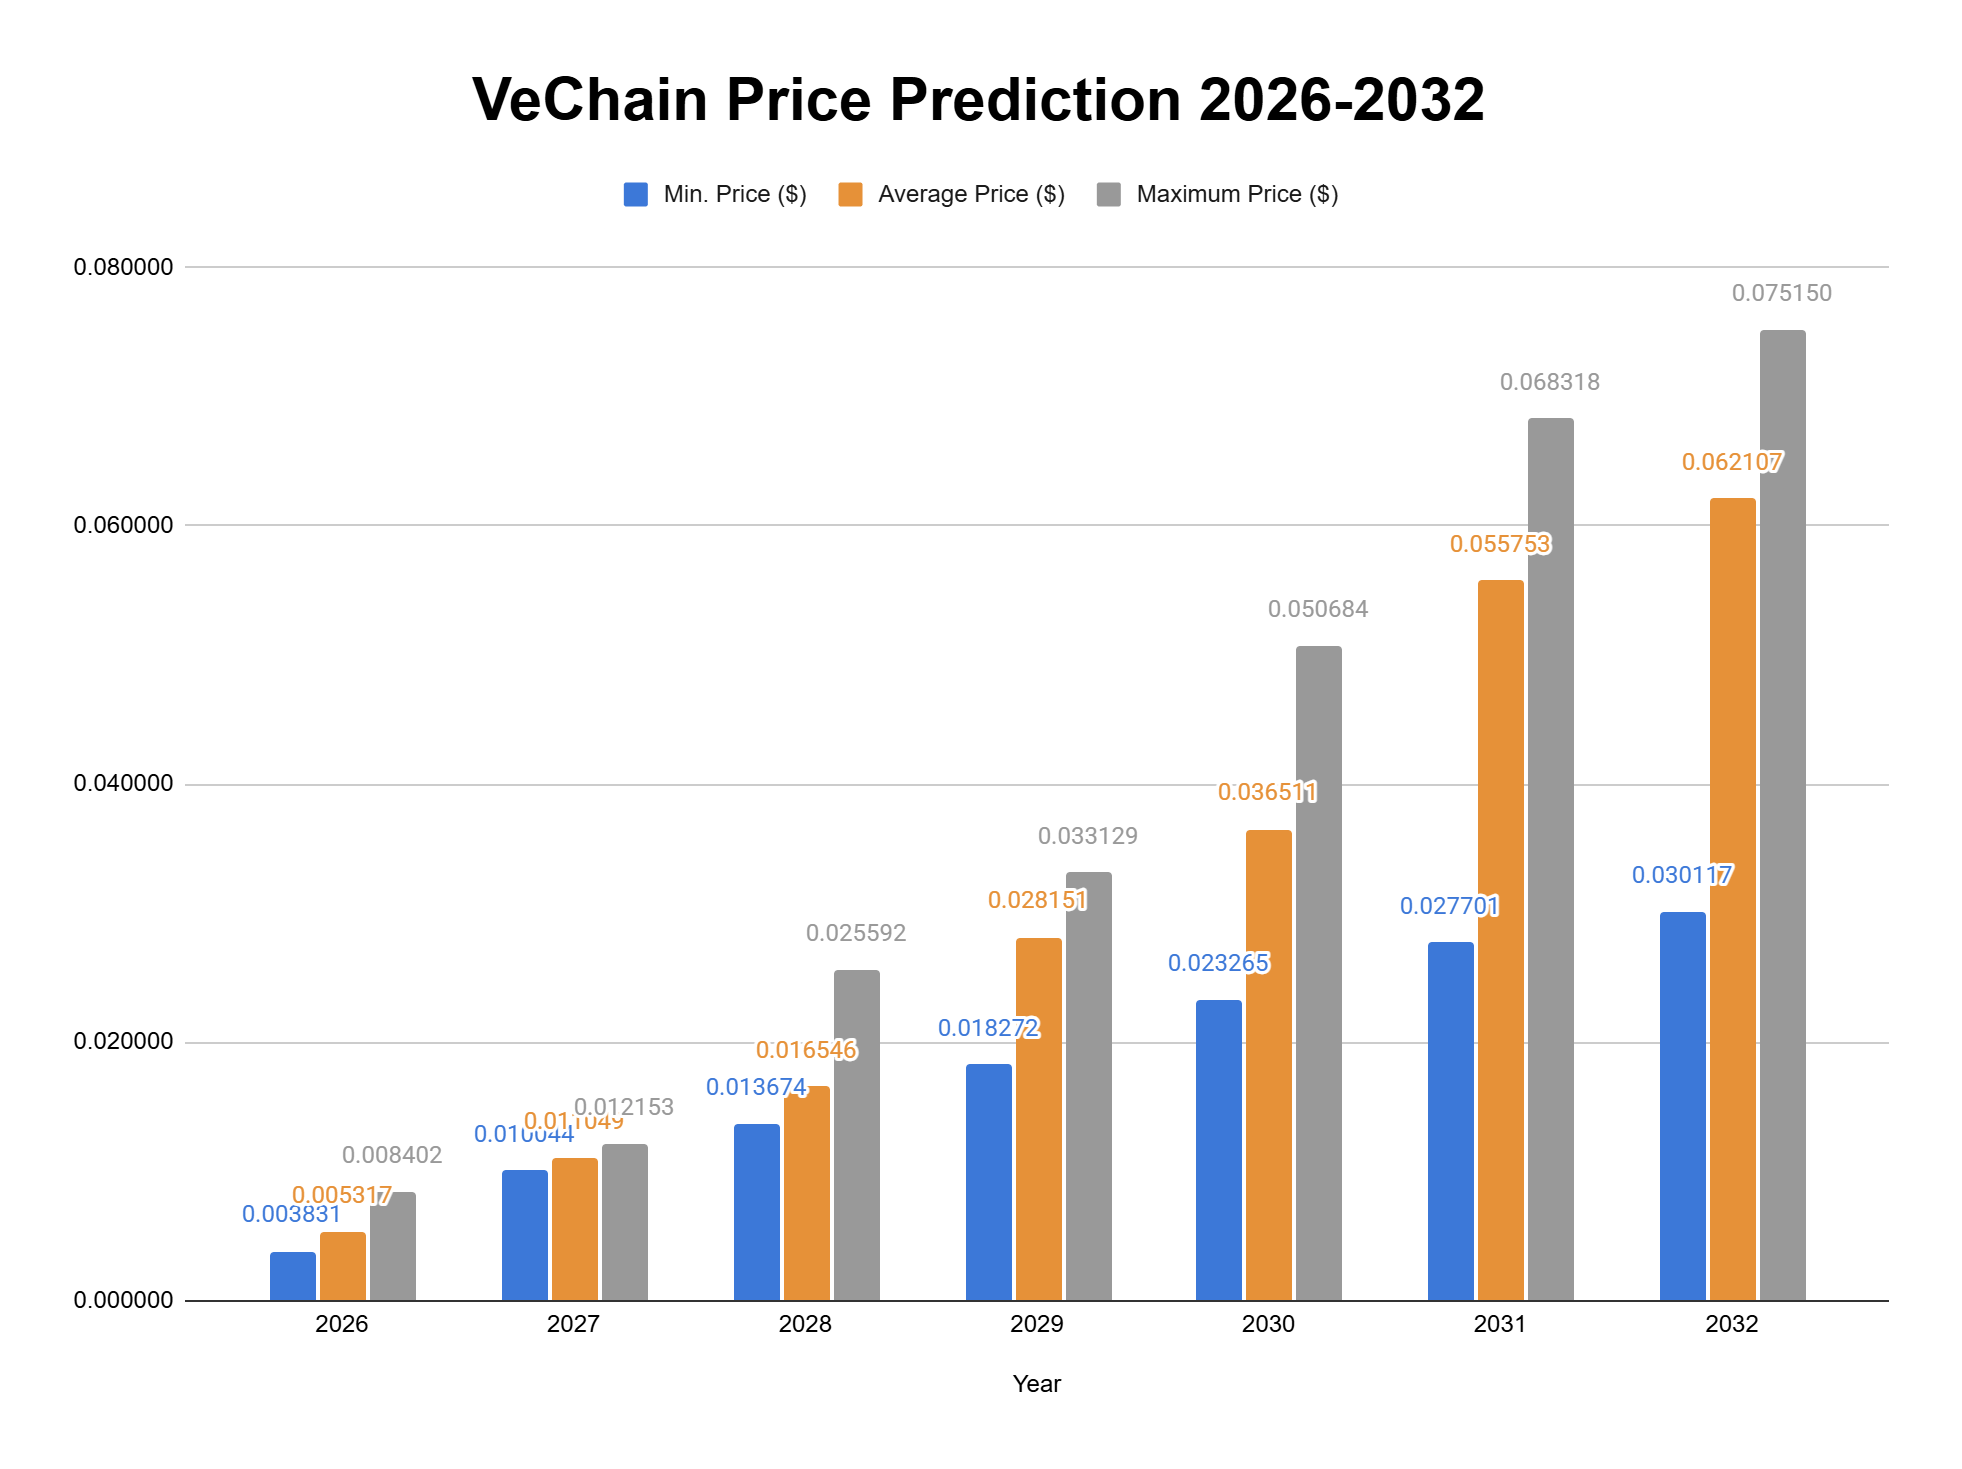
VeChain price prediction 2027-2032
| Year | Min. Price ($) | Average Price ($) | Maximum Price ($) |
| 2026 | 0.003831 | 0.005317 | 0.008402 |
| 2027 | 0.010044 | 0.011049 | 0.012153 |
| 2028 | 0.013674 | 0.016546 | 0.025592 |
| 2029 | 0.018272 | 0.028151 | 0.033129 |
| 2030 | 0.023265 | 0.036511 | 0.050684 |
| 2031 | 0.027701 | 0.055753 | 0.068318 |
| 2032 | 0.030117 | 0.062107 | 0.075150 |
VeChain Price Prediction 2027
For 2027, VeChain (VET) is expected to reach a minimum price of $0.010044. It could potentially climb to a high of $0.012153, averaging around $0.011049.
VeChain Price Prediction 2028
By 2028, VeChain price prediction suggests VET could trade at a minimum value of $0.013674. It might surge to a high of $0.025592, with an average price of $0.016546.
VeChain Price Prediction 2029
VeChain price prediction estimates VET to trade at a minimum of $0.018272 in 2029. It might reach a maximum of $0.033129, with an average value of $0.028151.
VeChain Price Prediction 2030
In 2030, VeChain’s price will likely hit a floor of $0.023265. Based on analysis, it could peak at $0.050684, with an average closing price of $0.036511.
VeChain Price Prediction 2031
The VeChain price prediction for 2031 projects a minimum price of $0.027701, a maximum price of $0.068318, and an average trading price of $0.055753.
VeChain Price Prediction 2032
In 2032, VeChain forecast suggests VET could trade at minimum and maximum prices of $0.030117 and $0.075150, respectively. The price might maintain an average of $0.062107
Vechain Price Forecast: By Analysts
| Firm | 2026 | 2027 |
| Coincodex | $0.01498 | $0.01274 |
| DigitalCoinPrice | $0.0208 | $0.0291 |
Cryptopolitan’s VeChain (VET) price prediction
Cryptopolitan’s market analysis predictions show that VeChain will achieve a high of $0.008402 in 2026. In 2028, it will range between $0.013674 and $0.025592, with an average of $0.016546. In 2032, it will range between $0.030117 and $0.075150, with an average of $0.062107. Note that these predictions are not investment advice. Seek independent professional consultation or do your own research.
VeChain historic price sentiment

- VeChain began in 2015 as a private consortium chain for blockchain applications. It transitioned to a public blockchain with the ERC-20 token VEN in 2017 and launched its mainnet as VET in 2018.
- In 2018, VeChain partnered with DHL to develop blockchain solutions for logistics but saw a significant price correction, stabilizing at lower levels.
- The price remained relatively stable in 2019 and 2020, with occasional spikes as VeChain continued developing technology and forming partnerships.
- In 2021, VeChain’s price surged to an all-time high of $0.20 in May but dropped to $0.070 by December.
- In 2022, VeChain attempted to recover but remained below $0.10, with continued volatility throughout the year and into early 2023.
- Towards the end of 2023, the price saw a slight uptick, stabilizing around $0.020 by early 2024.
- In 2024, VeChain’s price fluctuated, recovering to $0.025 by mid-March but dropping due to bearish trends, reaching a low of $0.019 by August.
- It traded around $0.021 in September but ended the month above the $0.024 mark. The price remained mostly stable in October, with the occasional bearish movement causing a decline from the $0.02400 level to start November at the $0.02100 price level.
- The asset closed November at a high level, with prices near the $0.04600 mark and a strong bullish outlook. However, the bulls only took the price higher in December, as the $0.0500 resistance was crushed swiftly.
- As of January 2025, VET traded around the $0.04300 mark as it started and closed the month around the same level.
- In February, the price fell towards the $0.03000 mark as bears took over, ending the month at $0.02800. In March, the net movement was low, but the volatility was very high, as the price fell to $0.02200 where it closed the month.
- In April the price saw an initial crash but observed sharp recovery ending the month above the $0.02600 mark. In May the price dwindled again ending the month around $0.0250. In June the price continued to struggle as it dropped to $0.0200 to end the month.
- July saw a sharp rise to the asset’s volatility with VET crossing the $0.02800 mark. However, the price could not be maintained and VET ended the month around the $0.02200 level. In September, the price saw high volatility reaching as high as $0.0260 but failed to stay at the level and ended the month below the $0.02200 mark.
- In October, the price declined further and ended the month below the $0.01500 mark as bears dominated the crypto markets during the later half of the month. in November, the downtrend continued with VET ending the month below the $0.0130 mark. In December, the price continued to move downwards ending the year at $$0.0122.
- In January, the trend continued with VET falling below the $0.0100 mark and ended the month below the $0.0080 level. In February the trend continued with the price ending the month below the $0.0070 mark. In March, the trend continued with VET closing the month at the $0.00677 mark.
- By the end of April, VET price hovered around $0.007. a trend that did not continue into May as the price saw rapid decline in the month ending below the $0.0050 mark.
FAQs
What is the utility of the VET token?
VET is used for transaction fees, staking, and as a medium for value transfer within the VeChain ecosystem. It also plays a key role in VeChain's supply chain management solutions.
Where can I buy VET?
You can buy VET on major cryptocurrency exchanges such as Binance, Coinbase, and KuCoin.
Is there a risk to staking VeChain?
Yes, risks include potential loss of funds due to validator misbehavior, network vulnerabilities, and market volatility.
Can the VeChain price crash?
Yes, like any cryptocurrency, VeChain's price can be volatile and subject to significant fluctuations.
Is VeChain a scam or legit?
VeChain is a legitimate blockchain project with a strong development team and a wide range of enterprise partnerships.
Where do I safely store VET?
You can safely store VET in hardware wallets like Ledger or Trezor, or in secure software wallets such as VeChainThor Wallet and Trust Wallet.
Disclaimer. The information provided is not trading advice. Cryptopolitan.com holds no liability for any investments made based on the information provided on this page. We strongly recommend independent research and/or consultation with a qualified professional before making any investment decisions.

Bilal Ahmed
Bilal Ahmed is a fintech writer with half a decade’s experience under his belt. He studied at The Institute of Chartered Accountants before joining Cryptopolitan in 2019.


CRASH COURSE
- Which cryptocurrencies can make you money
- How to boost your security with a wallet (and which ones are actually worth using)
- Little-known investment strategies that the pros use
- How to get started investing in crypto (which exchanges to use, the best crypto to buy etc)