The Sandbox Price Prediction 2023-2032
- The Sandbox Price Prediction 2023 – up to $0.52
- The Sandbox Price Prediction 2026 – up to $1.62
- The Sandbox Price Prediction 2029 – up to $5.16
- The Sandbox Price Prediction 2032 – up to $14.66
If you’re into crypto games, SAND will be familiar to you, and The Sandbox Price Prediction will prove helpful. The new virtual universe inspired by Metaverse gaming firm The Sandbox has opened toward NFT auctions, where several pieces have been sold, including the mega yacht. According to announcements from the crypto company, the non-fungible token piece opened with a valuation of 63.9 Ethereum, but in a few hours, it increased in price.
After bottoming in June, SAND has gone on a run of over 5,000% (from top to bottom). There is no surprise as they have big partners, such as Snoop Dogg and Adidas, helping to provide fundamental value to the coin.
Picture yourself in The Sandbox Metaverse, providing access to exclusive content and granting the possibility to monetize your own part of The Sandbox’s Metaverse. Build experiences, host events, and invite friends. Games are part of everyone’s life cycle; monetizing them could be a game-changer.
Cryptopolitan’s latest SAND price analysis has deduced that the bears control the market with a massive opportunity for further bearish activity. Although the market appears to show potential for a reversal, we can’t be sure if it will happen. However, the breakout could be a silver lining for the SAND cryptocurrency, as their market is engulfed in bearish dominion. The bulls could be the new victors of the market soon. This could happen in the coming week as the Metaverse has strong supporters.
How much is SAND worth?
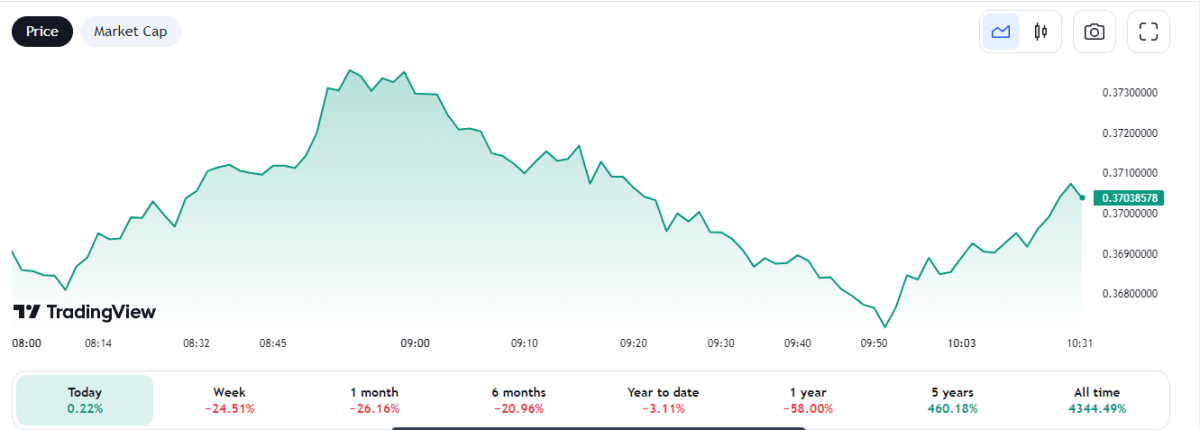
Today’s The Sandbox price is $0.3223 with a 24-hour trading volume of $36,650,394. The Sandbox is up 1.51% in the last 24 hours, with a fully diluted market cap of $665,430,156. It has a circulating supply of 2,064,931,926 SAND coins and a max. supply of 3,000,000,000 SAND coins.
The Sandbox price analysis: SAND/USD gears up to break lower than $0.3160
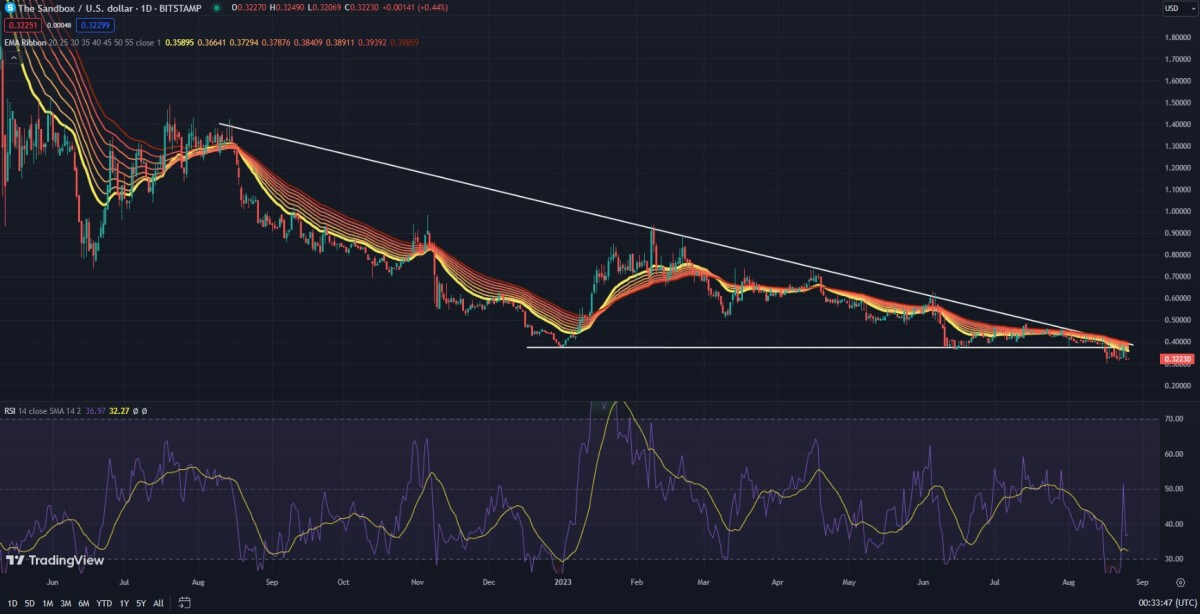
The Sandbox market broke below the descending triangle after a few heavily bearish days. After that, multiple inverted hammer candles were formed with the top near the previous line of support, confirming the continuation of downwards momentum. Now, SAND/USD is expected to move lower, since the overall market’s sentiment is headed towards that direction. At the same time, the RSI is also somewhat stable.
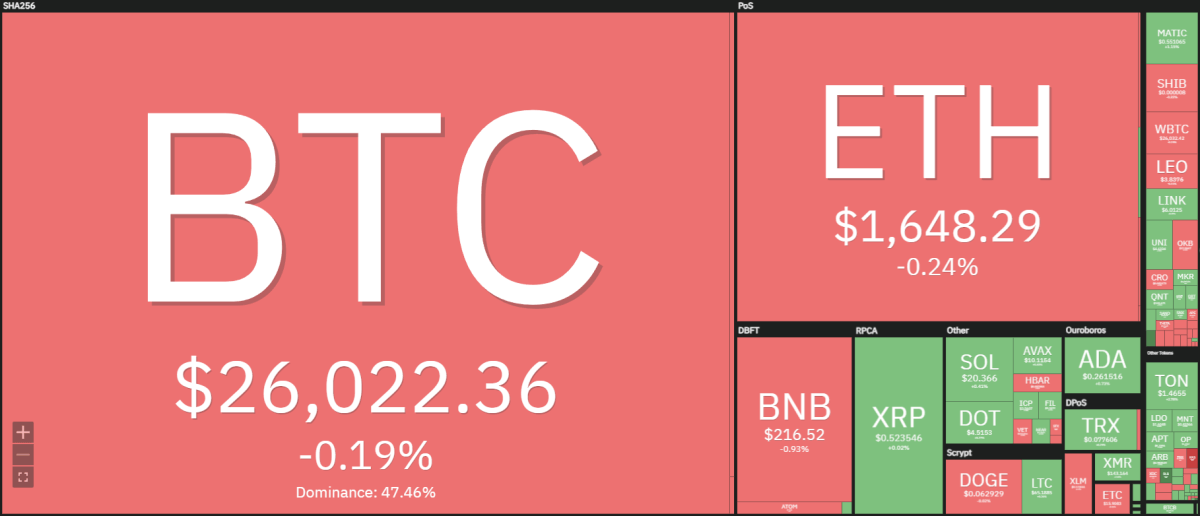
Based on the crypto heap map above, Bitcoin is currently down by 0.19 percent while Ethereum is low by 0.24 percent. We can see some mixed sentiments in the market where a few coins are in the green zone, but most are in the red. So, it is an overall bearish market with some mixed bullish markets.
The Sandbox 4-hour price analysis
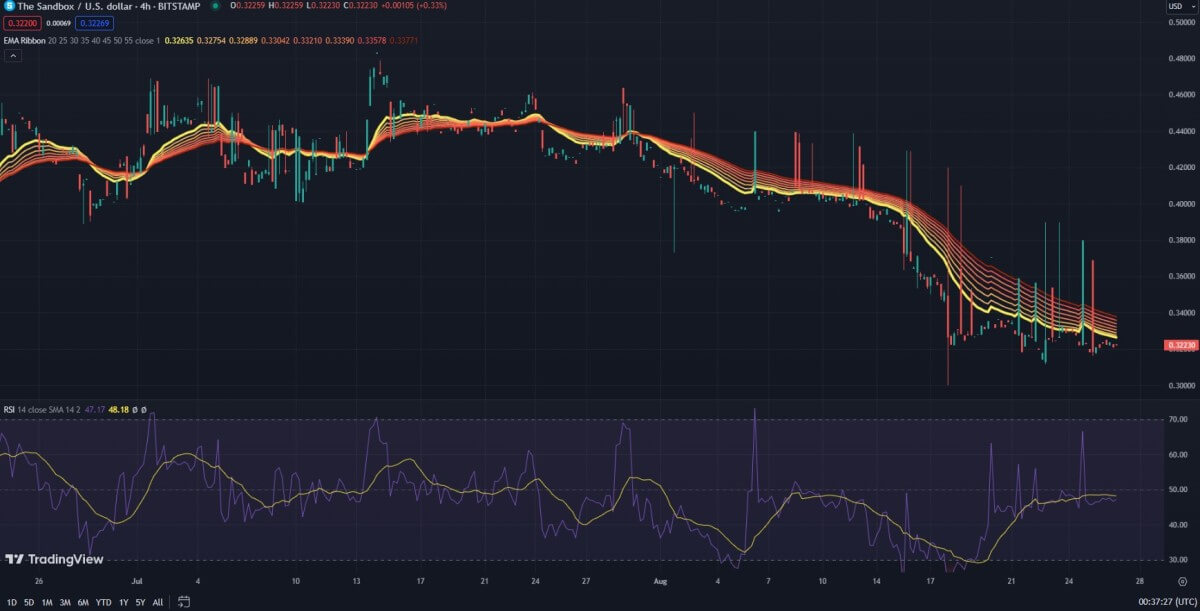
The Sandbox 4-hour chart has given us yet another confirmation that the bears have taken over. We can see sharp candle wicks forming, which shows that the bears are in full control right now. At the same time, the EMA ribbon shows the 20 EMA line trading below the 55 EMA line. There seems to be no indication of a crossover soon, so we can expect the current trend to continue.
For now, it looks like SAND/USD is headed downwards and may create a new local support level. However, instead of trying to catch the bottom, traders should hold their investment and look for confirmations of stability before purchasing SAND.
The Sandbox Price Predictions 2023-2032
Price Predictions by Cryptopolitan
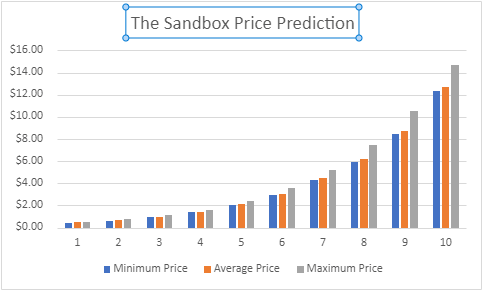
| Year | Minimum Price | Average Price | Maximum Price |
| 2023 | $0.44 | $0.46 | $0.52 |
| 2024 | $0.63 | $0.65 | $0.77 |
| 2025 | $0.93 | $0.96 | $1.11 |
| 2026 | $1.38 | $1.43 | $1.62 |
| 2027 | $2.03 | $2.09 | $2.39 |
| 2028 | $2.96 | $3.04 | $3.58 |
| 2029 | $4.34 | $4.46 | $5.16 |
| 2030 | $5.95 | $6.17 | $7.47 |
| 2031 | $8.46 | $8.71 | $10.56 |
| 2032 | $12.31 | $12.66 | $14.66 |
The Sandbox Price Prediction 2023
The Sandbox crypto price prediction for 2023 suggests the digital asset may attain a maximum price of $0.52 and an average price of $0.46. The minimum price forecast for Sandbox cryptocurrency is $0.44.
The Sandbox Price Prediction 2024
The Sandbox price forecast for 2024 is a maximum price of $77. and a minimum forecast price of $0.63. The altcoin is expected to attain an average trading price of $0.65.
The Sandbox Price Prediction 2025
The Sandbox forecast for 2025 suggests SAND coin may attain a maximum level of $1.11 and an average price forecast of $0.96. The minimum price that is expected for 2025 is $0.93.
The Sandbox Price Prediction 2026
The SAND token price prediction for 2026 is a maximum price of $1.62 and a minimum forecast price of $0.93. The altcoin is expected to attain an average trading price of $0.96 in 2026.
The Sandbox Price Prediction 2027
The Sandbox SAND price prediction for 2027 suggests the digital asset may attain a maximum price of $2.39 and an average price of $2.09. The minimum price that is expected for 2027 is $2.03.
The Sandbox Price Prediction 2028
According to the Sandbox price forecast for 2028, the Sandbox cryptocurrency is projected to attain $3.58 as the highest price, while the average trading price for the crypto is expected to be $3.04. Therefore, a minimum level of $2.96 is possible by the end of 2028.
The Sandbox Price Prediction 2029
Sandbox SAND altcoin price forecast for 2029 suggests that the cryptocurrency may attain a maximum of $5.16 and an average price forecast of $4.46. Therefore, the minimum price that is expected for 2029 is $4.34.
The Sandbox Price Prediction 2030
Our Sandbox price prediction for 2030 suggests the digital asset may attain a maximum of $7.47 and an average price forecast of $6.17. The minimum price that is expected for 2030 is $6.17.
The Sandbox Price Prediction 2031
According to the Sandbox price prediction for 2031, Sandbox cryptocurrency is projected to attain a maximum value of $10.56. However, the average trading price for the crypto is expected to be $8.71 by the end of 2031. Therefore, a minimum value of $8.46 is possible by the end of 2031.
The Sandbox Price Prediction 2032
Our Sandbox price prediction suggests the price of the token could reach a minimum level of $12.31. SAND’s price can reach a maximum of $14.66 with an average trading value of $12.66.
The SAND Price Forecast by Coincodex
Coincodex has a technical analysis of various cryptocurrencies, and the Sandbox (SAND) is no exception. According to CoinCodex’s current The Sandbox price prediction, the value of The Sandbox is predicted to rise by 4.51% and reach $ 0.409622 by June 19, 2023. According to our technical indicators, the current sentiment is Bearish while the Fear & Greed Index is showing 46 (Fear). The Sandbox recorded 14/30 (47%) green days with 10.53% price volatility over the last 30 days. Based on their The Sandbox forecast, it’s now a bad time to buy SAND.
The Sandbox Price Prediction by Wallet Investor
The Sandbox price prediction by Wallet Investor tracks the future price of The Sandbox (SAND) for 5 years. According to the prediction, the SAND price is expected to attain a minimum price of $0.0554. The website has a bearish long-term outlook for the coin and forecasts that the value of The Sandbox will drop by -95.41% from its current market price to reach a minimum price level of $0.0554 in five years.
The SAND coin Price Prediction by Changelly
Changelly is an AI-based price prediction website that tracks the future prices of cryptocurrencies and makes a price forecast for The Sandbox (SAND). According to Changelly, SAND will reach a maximum price level of $0.969903. The website predicts SAND will grow steadily over the next five years and attain a maximum price level of $30.57 by December 2032.
The Sandbox Price Predictions by Industry Influencers
The Sandbox was initially just a mobile gaming smash hit created in 2011. In 2018, however, developer Pixowl scaled it up to become a blockchain-based game, and, two years later, native token SAND had its initial coin offering. The transition to blockchain technology was motivated by the ethos of wanting to provide creators with true ownership of their creations via NFTs, while also creating an in-game currency where users can play-to-earn and foster a self-sufficient economy.
Recent News on The Sandbox
More about the SAND Network
What is SAND?
SAND is the native in-game currently of The Sandbox platform and is one of the essential tools to get a whole Metaverse experience. This token helps users buy and sell LAND and ASSETS, making it the basis of every transaction on the platform.
SAND has a supply of 3 billion SAND tokens and is an ERC-20-based token. It trades on all the major crypto exchanges like Gemini, FTX, and Binance.
The Sandbox was launched in 2011 by Pixowl, a games studio. This blockchain-based platform combines two of the hottest things in the world right now, cryptocurrencies and gaming, with a surprise mix of non-fungible tokens.
The users of The Sandbox platform will be able to create and build land following their desire for a gaming world. It is one of the most prominent virtual world ecosystems wherein over a million users are active over a single month.
Arthur Madrid, the co-founder and CEO at Pixowl, is the central authority behind The Sandbox, and Sebastien Borget is also a co-founder at Pixowl and serves as the COO of the company.
Sandbox has collaborated with major brands such as Atari, Binance, Adidas, The Smurfs, DeadMau5, and Bored Ape Yacht Club. With Sandbox, data platforms such as Realm have been motivated to develop non-expendable collections such as “Fantasy Island” that mint 100 virtual islands.
How does The Sandbox work?
Pixowl has created three products that people can use on the platform, which empowers their experience by giving them ownership of the content they produce. The first product is the VoxEditor which allows Windows or MC users to create 3D models ranging from humans to animals.
Furthermore, these 3D models can be imported from the VoxEditor to The Sandbox marketplace, and now, these are the ASSETS that a player can use. On the other hand, the second product is the native marketplace of The Sandbox, a major center of attraction for players.
The marketplace allows people to upload, sell, and publish all the NFTs they create for capitalization. Moreover, these uploads pass through to IPFS to offer decentralized storage and accessibility where the ‘ownership’ part comes in.
The Ethereum blockchain records the data and allows the creator to prove ownership; owners can sell their creations after uploading via the marketplace with the help of an initial sale offer.
Lastly, The Sandbox offers The Sandbox Game Maker. It offers developers worldwide or game enthusiasts the to create a game of their own choice on a blockchain without any coding skills. The Game Maker can quickly help people create 3D games, a truly majestic and creative tool from the platform.
The Sandbox Recent Developments
Paris Hilton in the Metaverse
The Entrepreneur, DJ, and OG crypto queen Paris Hilton is expanding her Web3 presence with more metaverse experiences.
In partnership with Paris Hilton and 11:11 Media, The Sandbox is bringing Paris Hilton’s world to the metaverse, ushering her fans into a new dimension of entertainment and interactivity.
The partnership will enable Paris fans to connect with her in a new way, discovering new sides of her multifaceted personality through experiences that will bring her universe to life.
Paris Hilton will empower her community through actual digital ownership and is planning community and social events such as rooftop parties and glamorous social experiences in her virtual Malibu Mansion.
The Sandbox partners with Gravity
In late July, Sandbox announced its partnership with a global gaming company ‘Gravity’ to bring Ragnarok to the metaverse.
Through this partnership, developers will build Ragnarok LAND in The Sandbox metaverse and various content and NFTs using Ragnarok IP. Players can participate in the future Game Jam themed on the Ragnarok universe and characters.
Based on the global popularity of Ragnarok, Gravity is also actively carrying out license businesses, broadcasting Ragnarok animations, and running an online store where the players can meet the Ragnarok merchandise.
Also Read:
- The Sandbox price analysis: SAND continues higher, set to discover $3 today?
- SAND price analysis: SAND devalues at $2.9 after bearish slide
- SandStorm Launches On-Demand Metaverse Builds with 5 Virtual World Partners
- Can BudBlockz Unseat Big Crypto Players Like the Sandbox and Decentraland?
Conclusion
The Sandbox is a project that essentially sells parcels of land in a virtual world for development. The project is known for hosting some ground-breaking metaverse events and could continue attracting diverse users from different industries. While some of the forecasts for Sandbox price predictions are bullish, there is still much room for growth before that happens. Nevertheless, the Sandbox looks well-positioned to reach its full potential in the coming years.
Sandbox is one of the most fabulous metaverse projects incorporating games, NFTs, and cryptocurrencies. The metaverse is rapidly expanding and, in the process introducing many opportunities for its community; it also has significant partnerships with major brands and celebrities like Snoop Dogg endorsements.
With already-established artists like Snoop Dogg and Ozzy Osborne performing virtual concerts, it’s clear that the music industry is wholeheartedly investing in the metaverse. Even heavy metal band Slipknot has jumped on board by creating a KNOTVERSE experience for fans. These types of live events are at the core of what The Sandbox offers, and they have made a strong effort to accommodate these sorts of happenings.
The Sandbox Season 3 will be live soon and is expected to bring a new immersive experience for creators and players. The launch will play a part in Sandbox’s recovery in the second half of 2022. The Sandbox ecosystem is actively growing with new users and brand partnerships and will remain viable in the long term.
Some people have outrageous predictions for Sandbox’s earning potential, placing it as high as $100 billion. In contrast, The Sandbox is only valued at approximately $900 million right now. If the project continues going in its current direction, we predict that SAND will be valued at $10-30. However, it is difficult to say when or even if this increase could happen.
Since the bottom in June 2021, SAND has only been outperformed by Axie Infinity (AXS), another metaverse game token. You can see that there is a clear trend here starting in Dec 2021. The question is if the trend will continue. Will you HODL or DUMP now that we’re in the middle of a “maelstrom”?
The sandbox has lost over 80% of its value and will take about 5 years to set a new price record. The Sandbox price prediction for 2032 is $30.57; the Sandbox virtual world provides many Defi opportunities for creators and gamers, and players can purchase, develop and trade land on the metaverse. The development could lead to a significant increase in utility. The sandbox will set new resistance and support levels.
Price Predictions do not take into account the variable changes in market conditions year-to-year, so be on the lookout for these changes before investing in any coin.
When considering investment strategies, take a look at our Evergreen guides on crypto investing.


