TL;DR Breakdown
- Polygon price appears to consolidate for the first time since 23 percent January 12 dip
- Market value stands substantially to push price upwards
- $3 target remains intact for MATIC
Polygon price analysis for the day indicates that the token is set to launch another assault at the $3 resistance target. After initially falling from the mark on January 12 and undergoing a significant 23 percent dip, MATIC is consolidating momentum for the first time. Price rose as high as $2.40 over the day’s trade with trading volume falling 31 percent to indicate buyer dominance at current trend. The steady ascend towards $3 has been in place for months now with an all time high also on the cards if price can push towards $2.90 over the current trend.
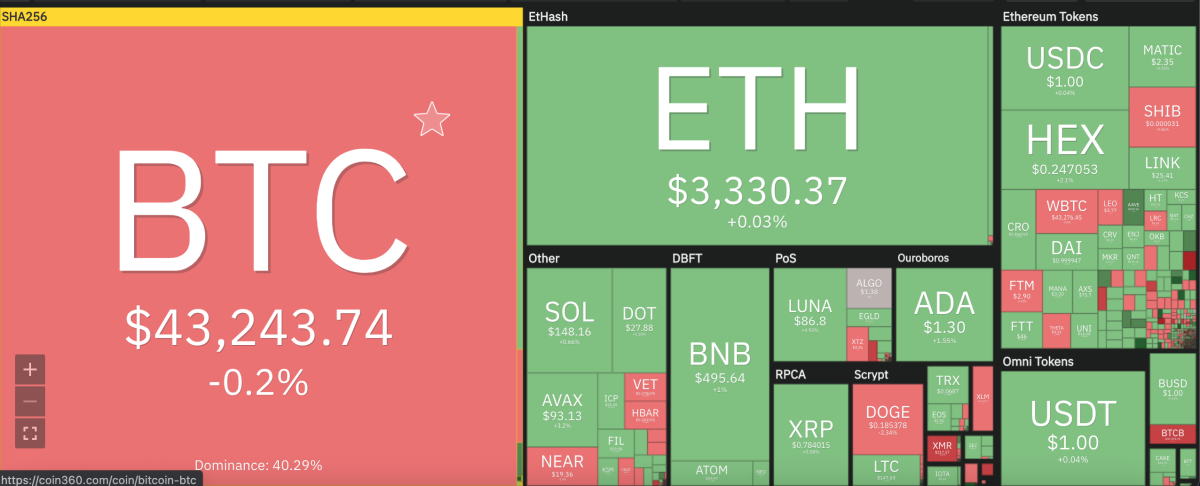
The larger cryptocurrency market showed minor gains to continue from yesterday’s positive outlook, as Bitcoin and Ethereum consolidated above $43,200 and $3,300, respectively. Among Altcoins, Ripple rose up to $0.78 with Cardano rising 1.5 percent up to $1.30. Polkadot increased 2 percent up to $27.67, while Terra recorded a 4 percent rise. In contrast, Dogecoin faced sell offs and profit taking in the market, with price slipping 2 percent down to $0.185.

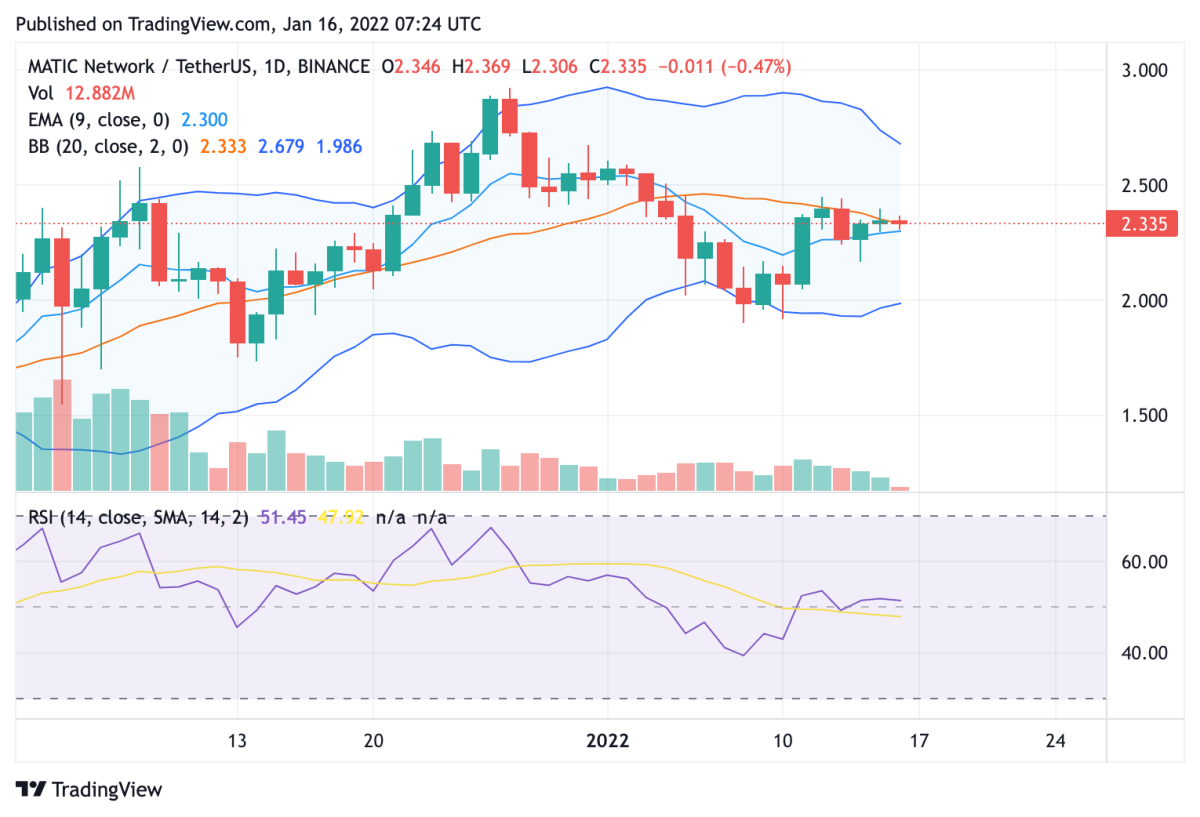
MATIC/USD 24-hour chart: Strong RSI valuation tips price to ascend
On the 24-hour chart for Polygon price analysis, the Relative Strength Index (RSI) value of 51.49 shows strong indication for price to move upwards at current trend. MATIC currently sits just above the 25-day exponential moving average (EMA) at $2.29 and in the top section of the Bollinger bands curves. These indicators present strong indication for Polygon’s price target of $3. Over the next 24 hours price will aim to consolidate up to the first resistance point of $2.5. However, if buyer momentum is unable to build up, price may pull down towards the $2 support.

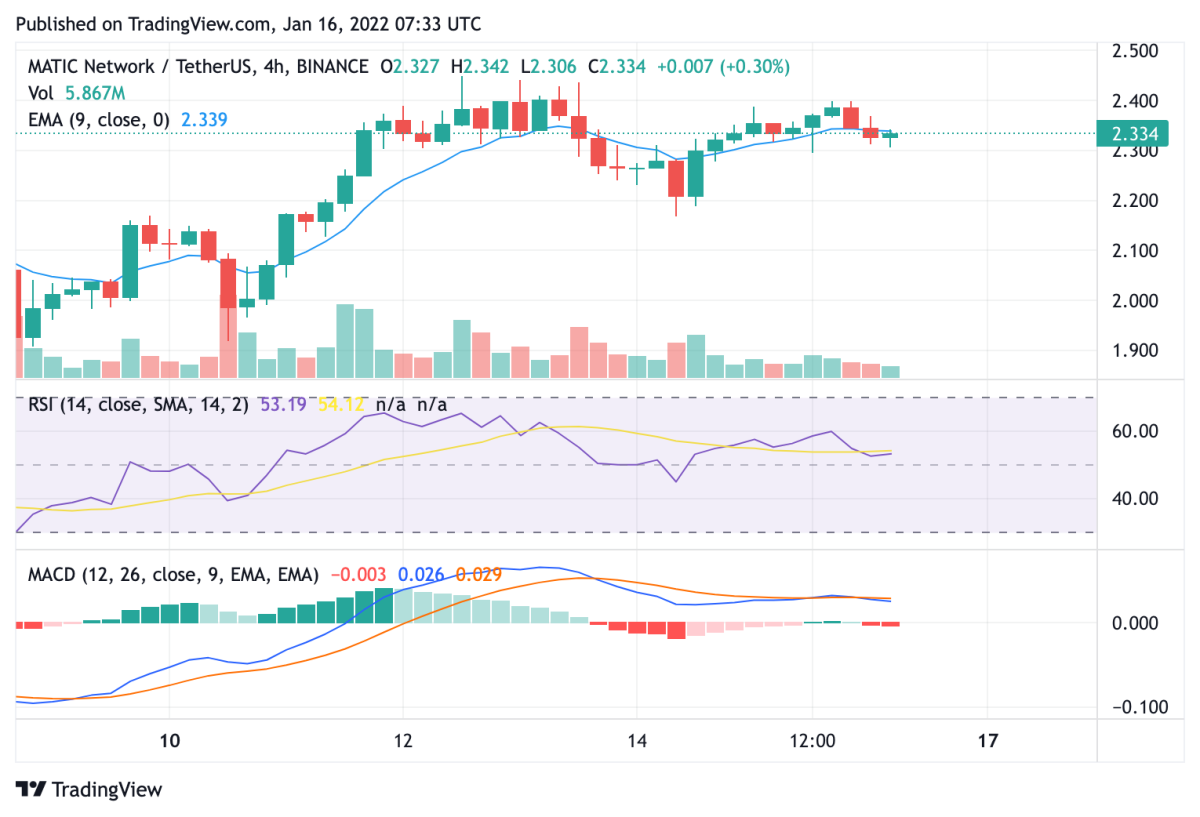
MATIC/USD 4-hour chart: Bullish make up to be confirmed if $2.3 mark can hold
The 4-hour candlestick chart for the MATIC/USD trade pair suggests that price will aim to consolidate around $2.3 over the short term, before launching further upwards. The RSI value of 53.19 shows strong market valuation with the moving average convergence divergence (MACD) curve also showing bullish highs. Over the short term, MATIC will look to settle above the 4-hour EMA at $2.344 which will define further movement upwards.

Disclaimer. The information provided is not trading advice. Cryptopolitan.com holds no liability for any investments made based on the information provided on this page. We strongly recommend independent research and/or consultation with a qualified professional before making any investment decisions.


