EOS Price Prediction 2024-2033
- EOS Price Prediction 2024 – up to $1.16
- EOS Price Prediction 2027 – up to $3.75
- EOS Price Prediction 2030 – up to $11.15
- EOS Price Prediction 2033 – up to $37.58
EOS a crypto token formed by the company to promote its decentralized app creation. Lately, it has resumed its upward projectile with renewed activities and is viewed by some analysts as a “ticking time bomb.” The similarities between the XRP fractal from 2015 to 2017 and EOS‘s current chart are mind-blowing.
EOS, jokingly referred to as Ethereum on Steroids, seems like “the world’s most hyped blockchain” is up on its feet and raring to run, but it needs community as much as development.
How much is EOS worth?
Today’s live EOS price is $1.08, with a 24-hour trading volume of $211,543,811, a decrease of 2.26%. EOS is up 20.02% in the last 24 hours. The current CoinMarketCap ranking is #89, with a live market cap of $1,206,230,583. It has a circulating supply of 1,122,532,452 EOS coins, and the max supply is not available. However, it makes a fully diluted market cap of $1,004,297,024
EOS price analysis
EOS Price Analysis: EOS Price Trades at $1.08 as Bears Regain Momentum
- EOS price analysis shows a price decrease of 2.26% over the last 24 hours.
- Resistance is currently found at $1.1200.
- EOS/USD may retest the support of $1.02.
Analyzing EOS’s performance, it’s evident that the EOS market has demonstrated sideways movement during the day’s trading session. Over the past 24 hours, EOS/USD has varied between $1.09950 and $1.0801.
The EOS/USD pair is currently at $0.9031, marking a decrease of of 10.50% in Binance. The day started on a bullish note, reflecting positive market sentiment and anticipating further upward momentum in the short term.
EOS/USD 1-day price chart: Bullish pressure is present at $ 1.080
The 1-day price chart for EOS price analysis is going bearish for the day as the price continues to plunge, trading just below the resistance level. There had been a slight bearish momentum as the day commenced resulting in the price reaching $1.08 value.
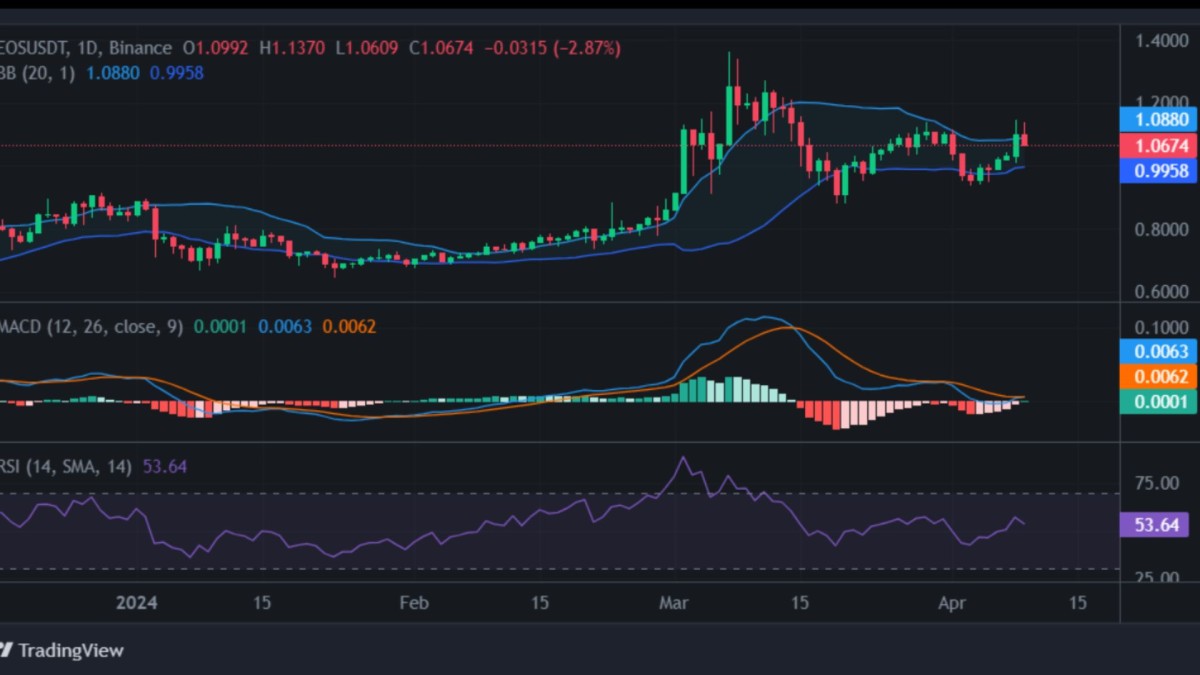
EOS/USD 1-day price chart; Tradingview
EOS currently registers a Relative Strength Index (RSI) value of 53.47 , offering valuable insights into its current market dynamics.
With an RSI reading of 53.47, EOS finds itself in the mid-range, suggesting a balanced market sentiment devoid of strong bullish or bearish trends. Traders and investors should approach cautiously, considering various technical and fundamental factors before trading.
Regarding Bollinger Bands, EOS indicates a lower support level at $ 0.9988 and an upper resistance level at $1.0907, reflecting a relatively narrow trading range. These bands serve as significant indicators, aiding traders in identifying potential breakout or breakdown points as EOS’s price fluctuates within these established boundaries.
EOS price analysis 4-hour price chart: A bearish pattern forms
The EOS token has broken out from an ascending channel on the 4-hour price chart. This breakout hints at the potential for a bearish reversal soon. As per the latest data, the digital asset is currently trading at $1.0789.
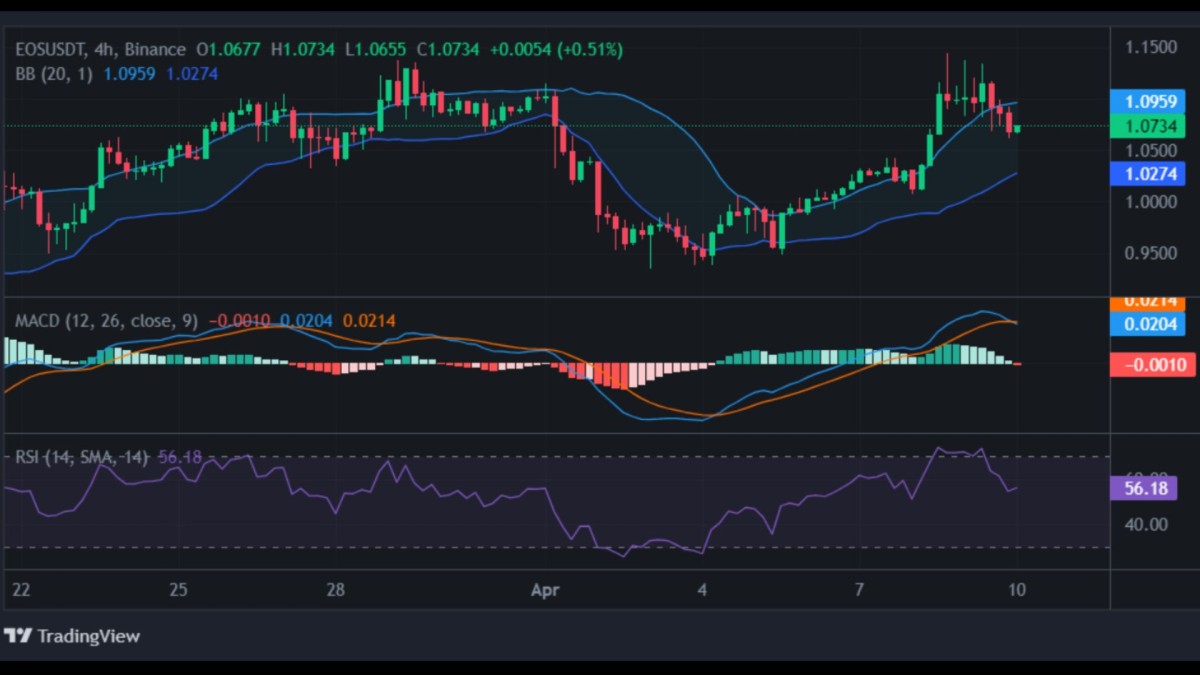
EOS/USD 4-hour price chart: CoinMarketCap
EOS currently displays an RSI (Relative Strength Index) value of 56.97, offering insight into its market condition.
This RSI reading of 56.97 suggests that EOS is in equilibrium, with neither a strong bullish nor bearish trend dominating the market sentiment. Traders and investors should exercise caution and consider various technical and fundamental factors before trading.
When examining EOS’s Bollinger Bands, we find a support level at $1.0275 and a resistance level at $1.0962. This indicates a relatively narrow trading range forming. A narrow trading range in price analysis typically indicates a period of low volatility and stability in the market.
Is EOS a good investment?
EOS represents a compelling investment prospect thanks to its robust features and scalability potential. As a blockchain platform, EOS offers rapid transaction speeds and minimal fees, making it appealing for developers venturing into decentralized applications (DApps). Its delegated proof-of-stake (DPoS) consensus mechanism enhances scalability and efficiency.
Furthermore, EOS boasts a thriving ecosystem with diverse DApps across various sectors, underscoring its utility and adoption. Our CP Price Prediction section will provide insights into the coin’s potential value appreciation in the foreseeable future, assisting investors in formulating their strategies.
Recent EOS News
EOS CEO unveils plan to slash inflation, sparks price surge
The CEO of EOS has revealed plans to slash the cryptocurrency’s inflation, sending shockwaves through the market. In a strategic move aimed at revitalizing investor confidence, EOS will mint approximately 818 million tokens while capping the total supply at 2 billion. The newly minted tokens will be released gradually, with a front-loaded distribution strategy targeting active holders.
This announcement comes amidst EOS’s decline in popularity, with its ranking plummeting to 92nd in the cryptocurrency charts. Despite recent setbacks, the news catalyzed a surge in EOS’s price, offering a glimmer of hope for supporters and investors alike. The industry now eagerly anticipates the impact of this bold initiative on EOS’s trajectory in the competitive crypto landscape.
EOS Price Predictions by Cryptopolitan 2024-2033
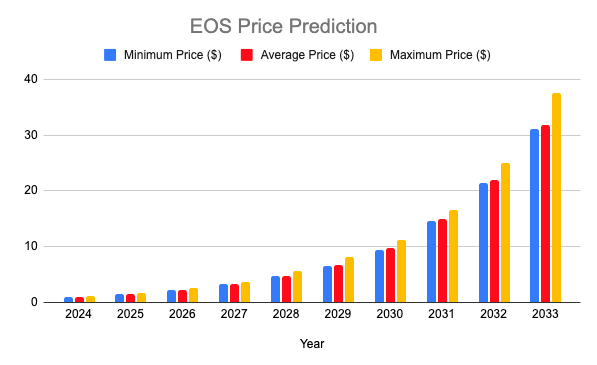
| Year | Minimum | Average | Maximum |
| 2024 | $0.9934 | $1.02 | $1.16 |
| 2025 | $1.46 | $1.51 | $1.73 |
| 2026 | $2.16 | $2.22 | $2.55 |
| 2027 | $3.24 | $3.36 | $3.75 |
| 2028 | $4.66 | $4.83 | $5.66 |
| 2029 | $6.56 | $6.75 | $8.10 |
| 2030 | $9.44 | $9.71 | $11.15 |
| 2031 | $14.57 | $14.95 | $16.49 |
| 2032 | $21.34 | $21.94 | $25.06 |
| 2033 | $31.00 | $31.88 | $37.58 |
EOS Price Prediction 2024
Our EOS coin price prediction 2024 suggests that EOS crypto might reach a minimum of $0.9934 and an average of $1.02, with the maximum forecast at $1.16.
EOS Price Prediction 2025
Based on our EOS price prediction for 2025, we believe that by this time, the crypto may reach a minimum of $1.46 and an average of $1.51. The EOS price forecast for 2025 suggests EOS will attain a maximum price of $1.73.
EOS Price Prediction 2026
According to our EOS price prediction for 2026, we expect EOS to have a maximum price of $2.55. We expect a minimum price of $2.16, with an average price of $2.22. Once developments and partnerships in the EOS ecosystem mature, EOS can be a good investment in 2026.
EOS Price Prediction 2027
Our EOS prediction for 2027 suggests that the currency may reach a minimum of $3.24 and the average price of EOS $3.36, with the maximum forecast at $3.75.
EOS Price Prediction 2028
According to our EOS price prediction for 2028, the crypto might reach a minimum of $4.66 and an average trading price of $4.83. The maximum forecast price is $5.66.
EOS Price Prediction 2029
According to our EOS coin forecast 2029, the crypto might reach a minimum of $6.56 and an average trading price of $6.75, with a maximum value of $8.10.
EOS Price Prediction 2030
Based on our EOS price prediction for 2030, the crypto might reach a minimum of $9.44 and an average trading price of $9.71, with the maximum forecast at $11.15.
EOS Price Prediction 2031
Based on our EOS price prediction for 2031, EOS cryptocurrency might reach a minimum of $14.57 and an average trading price of $14.95, with the maximum forecast at $16.49.
EOS Price Prediction 2032
Our EOS price prediction forecast 2032 suggests EOS crypto will continue on a bullish trend. The forecasted EOS price might reach a minimum of $21.34 and an average closing price of $21.94, with the maximum forecast at $25.06.
EOS Price Prediction 2033
Our EOS price prediction 2033 indicates a minimum price of $31.00, an average price of $31.88, and a maximum price of $37.58. EOS continues to show promising potential for investors.
EOS price Predictions by DigitalCoinPrice
According to DigitalCoinPrice’s forecast on EOS price prediction, EOS witnessed a remarkable upswing of 112.15% by the end of February, bringing it close to the $1.48 threshold. Presently, various indicators are signaling a bearish sentiment, with the fear & greed index recording a significant 16.47, indicating extreme fears among investors.
In line with DigitalCoinPrice’s analysis, this may not be the opportunity to consider selling EOS.
Looking ahead, DigitalCoinPrice’s EOS price prediction suggests a substantial increase of 242.42%, potentially reaching $2.49 by the conclusion 2026. Furthermore, as the projection extends into the future, it is estimated that 2030 EOS could be valued at $5.20, while in 2033, it may surge to $13.56. These forecasts underscore the potential for significant growth and evolution in the EOS market.
EOS price Predictions by Wallet Investor
According to WalletInvestor.com’s EOS price prediction, the financial forecasting platform anticipates significant cryptocurrency value movements. In their latest analysis, they project that within the next 14 days, EOS will reach a price of $0.714.
Looking further into the future, WalletInvestor.com foresees EOS achieving a price of $3.845 in the year 2025. These predictions suggest potential growth and changes in EOS’s value, offering insights for investors and enthusiasts.
EOS Price Predictions by Coincodex
According to CoinCodex, EOS price prediction exhibits some interesting trends. By the end of 2025, EOS is expected to reach $0.757870; in 2026, it might rise to $1.051815. These EOS price prediction are based on various market factors.
EOS may experience fluctuations in the short term, with an anticipated increase of 4.34% to reach $0.732971. However, it’s worth noting that technical indicators like the RSI, MACD, Bollinger Bands, and Stochastic Oscillator suggest a bearish momentum and potential volatility soon.
Looking further ahead, there is potential for EOS to achieve significant growth. By 2030, it could see a remarkable gain of 127.34% compared to today’s price if it reaches the upper price target.
EOS Price Prediction by Industry Influencers
The EOS blockchain has become one of cryptocurrency’s most favored Layer-1 smart contract protocols. Its creation empowered scalability and made it a direct opponent to Ethereum’s domination in smart contracts development.
Numerous specialists have contributed their guesses on the trajectory of EOS’s price as its utility in the decentralized economy continues to strengthen. This has sparked forecasts for what we can anticipate from EOS in upcoming years.
Market analysts have suggested that EOS may potentially become one of the top five blockchain projects in terms of market capitalization by 2025. Analysts also cite the increasing level of development activity and partnerships as major elements that will drive up the value of EOS in the coming years.
Also Read:
- EOS Mining: The #1 Mining Guide For Beginners
- Bitcoin and EOS drive DApp growth
- How to Buy EOS Coin in 3 Easy Steps?
EOS Price Overview
| Popularity | #92 | Market Cap | $895,703,222 |
| Price Change (24 hours) | +0.80% | Trading Volume (24 hours) | $115,239,582 |
| Price change (7 days) | +5.78% | Circulating Supply | 1,118,375,178 EOS coins |
| All-time low | Oct 23, 2017 $0.5024 | All-time high | Apr 29, 2018 $22.89 |
| From ATL | 58.02% | From ATH | -96.66% |
EOS Price History
EOS, a cryptocurrency renowned for its smart contract capabilities and fast transaction speeds, has had an eventful price history. It gained prominence through an ICO (Initial Coin Offering) from June 2017 to June 2018, raising a staggering $4 billion.
EOS hit its all-time high (ATH) price of approximately $22.89 on April 29, 2018, during the cryptocurrency market’s bullish phase, attracting considerable attention from investors and traders.
However, EOS also experienced its lowest price point during the bear market in December 2018, trading at around $1.56, which was part of a broader market downturn. Notably, EOS made a significant move when it transitioned from the Ethereum blockchain to its mainnet on June 2, 2018. This shift generated positive sentiment and interest in EOS.
Subsequent developments, such as the release of EOSIO 2.0 in January 2020, improved the EOS blockchain, enhancing its security and performance. This development had a positive influence on EOS’s price.
On the regulatory front, EOS’s parent company Block. One settled with the U.S. Securities and Exchange Commission (SEC) in September 2020 for conducting an unregistered ICO, highlighting regulatory challenges in the crypto space. However, it did not have an immediate negative impact on the price.
As of February 4th, 2024, the current EOS price is $0.708, exhibiting a 2.29% increase in the past 24 hours. EOS holds the #78 position in the CoinMarketCap ranking, boasting a live market cap of $802,539,737.
EOS’s price has also been influenced by general market volatility, regulatory news, and macroeconomic factors, leading to price fluctuations. Potential investors must carefully consider these factors and conduct their research before entering the EOS market, given the inherent volatility of the cryptocurrency space.
More on EOS
What is EOS?
EOS is one of the best-known cryptocurrencies today that allows building decentralized apps (DApps) simple and scalable. EOS cryptocurrency was developed by a company called Block.one.
Founded by software programmer Daniel Larimer and entrepreneur Brendan Blumer, who still hold the roles of CTO and CEO, the company began to work on the project in 2017.
In June 2018, the EOS officially went live after a year-long Initial Coin Offering (ICO). The ICO raised more than $4 billion despite the prohibition on participation from U.S. investors. To this day, the ICO is one of the largest token sales, while the EOS blockchain continues to be one of the largest cryptocurrencies by market capitalization and trading volume.
How does EOS Work?
EOS uses its own proof of stake EOSIO blockchain that processes transactions quickly, scalable, and securely. The EOSIO 2.2.0-rc1 includes three new features: Read-only Queries, Private Chain Access, and Resource Payer.
Initially, EOS used ERC-20 tokens to distribute the coins raised in the ICO, which helped ease the ICO process as the ERC-20 token was frequently used to raise an ICO.
Later, all of the ERC-20 tokens were converted to native EOISO blockchain tokens, allowing token holders to finally transact and operate on the network.
Block producers on the EOS network are chosen in a delegated-proof-of-stake mechanism (DPoS), which requires EOS token holders to lock in their coins for over three days.
The DPoS mechanism allows for a lower entry threshold, which results in more decentralization, less power used, and more scalability for the network.
Existing EOS partners
Recently, Google announced that it has partnered with Block.one, to become a block producer for the network. It is one of the largest partnerships in the cryptocurrency ecosystem to date and will likely further increase EOS’s popularity.
Another great partnership for EOS and its developer, Block, was recently made with investor LACChain, an Inter-American Development Bank initiative to promote blockchain use and crypto market development across Latin America and the Caribbean.
A similar partnership was made in Asia in 2018, as a $200 million joint venture fund – EOS Global- was created with local blockchain technology entrepreneurs Michael Cao and Winnie Liu.
Recently, Wyoming became the first country worldwide to give official status to an EOS-based DAO or decentralized autonomous organization. The American CryptoFED DAO features two tokens, Ducat and Locke, with a cap of 10 trillion tokens.
Projects built on EOS
- Eosfinex is a non-custodial trading platform that allows trading using the security of an EOS non-custodial wallet.
- EOSDT is a decentralized stablecoin, just like the well-known USDT. It is available on large exchanges such as HitBTC, Bancor, and Changelly.
- Defibox combines the blockchain with DeFi protocols, allowing Swap and Lend to use their native stablecoin – BOX.
- Upland is a virtual property trading game that runs on the EOS blockchain. It has over 35 thousand users with over $500 thousand transaction volume.
- American CryptoFed DAO is the world’s first payment structure to issue a digital asset whose value is noninflationary.
DeFi and EOS: Expanding Frontiers
Decentralized Finance (DeFi) has emerged as a pivotal area of growth in the blockchain sector, and EOS has quickly aligned with this trend. The network’s ventures into the DeFi space are expected to catalyze the development of innovative financial services on its platform.
By leveraging its inherent features like high transaction throughput and lower transaction costs, EOS is poised to become a significant player in the DeFi arena. The network’s involvement in DeFi ranges from funding promising projects to forming strategic alliances, setting the stage for a more diverse and inclusive financial ecosystem on the blockchain.
Looking Ahead: EOS in 2024 and Beyond
As 2024 unfolds, the expectations from EOS are high. The network’s recent activities suggest a clear trajectory towards becoming a more inclusive, versatile, and developer-friendly platform. The focus on dApps and gaming, coupled with strategic DeFi investments, positions EOS well in the competitive blockchain landscape.
The integration of EVM is a crucial step in ensuring interoperability and user engagement. EOS is expected to continue its path of innovation and strategic partnerships, potentially leading to increased adoption and a stronger presence in the global cryptocurrency market.
EOS’s journey in 2024 and beyond will blend technological advancement and strategic market positioning. Its efforts to expand its ecosystem, coupled with a focus on user experience and developer support, will likely keep it at the forefront of blockchain innovation. As the digital economy evolves, EOS’s adaptability and strategic investments are anticipated to shape its future significantly.
Summing up the EOS coin price prediction, we are bullish on this cryptocurrency. Even though this coin has stayed stable over the last few years, there were times when it fell below 90%, erasing most of the gains of early investors.
EOS may seem like a solid investment. Although the EOS price forecast here varies, we predict it will keep rising. So, if you believe in EOS and want to invest in it, it is better to conduct thorough research before investing. Ensure you invest money you can afford to lose.
Conclusion
EOS has experienced a mixed trading day with a slight bullish sentiment prevailing. While the coin has seen a modest price decrease of 2.26% over the last 24 hours, it faces resistance at $1.0907 and potential support retest at $0.9988. The 1-day price chart indicates bullish pressure with EOS trading just below resistance levels, while the 4-hour chart signals a potential bearish reversal after breaking out from an ascending channel.
Despite market fluctuations, the recent announcement from EOS’s CEO regarding inflation reduction has injected renewed optimism into the community, leading to a surge in price. As EOS navigates these developments, traders and investors should remain vigilant and consider technical and fundamental factors in their decision-making process. The industry eagerly awaits the unfolding impact of EOS’s strategic initiatives on its position in the competitive cryptocurrency landscape.