Dogecoin Price Prediction 2024-2033
- Dogecoin Price Prediction 2024 – up to $0.2314
- Dogecoin Price Prediction 2027 – up to $0.6708
- Dogecoin Price Prediction 2030 – up to $2.0460
- Dogecoin Price Prediction 2033- up to $4.407
Dogecoin used to be the best-performing in crypto market within the top 10 and the 3rd best-performing within the 100 behind FTM and LINK. Our Dogecoin Price Prediction 2024-2033 is shaping up beautifully, and that’s something to be grateful for. We need more of these price spikes, not just for DOGE!
How much is DOGE worth?
Today’s live crypto market shows the current Dogecoin price is $0.1829, with a 24-hour trading volume of $3,802,406,617, an increase of 12.03% over the last 24 hours. The current CoinMarketCap ranking is #8, with a live market cap of $26,354,178,327. It has a circulating supply of 143,720,806,384 DOGE coins, and the max. supply is not available..
Dogecoin price analysis: Dogecoin Hits the Edge of 0.1855 Following the Market Scent
- Dogecoin price analysis shows a bearish trend today, trading above its resistance level
- Support for DOGE/USD is present at $ 0.1488
- Resistance for DOGE is present at $ 0.2011
Depending on our technical analysis, Dogecoin’s market has turned bearish trading within its resistance level. Analyzing its performance, it’s evident that DOGE has demonstrated sideways movement during the day’s trading session. Over the past 24 hours, the DOGE/USD pair has fluctuated between $ 0.1829 and $0.1488.
Dogecoin’s market has turned bearish, but yet to surpass its resistance level. The DOGE/USD pair currently sits at $0.1829, marking a 12.03% increase. The day began with bullish sentiment, reflecting positive market sentiment and anticipating further upward movement as the market is volatile maintain the average price of $0.1329.
DOGE/USD 1-day price chart: Bullish pressure mounts on the daily chart
The technical analysis of Dogecoin’s 1-day price chart reveals a strongly bearish trend, with a remarkable down surge in bearish momentum evident. Notably, the price is about to exceed its support level, achieving a value of $0.1829 with an average price of $0.139. However, an overturn is about to be experienced with a positive sentiment.
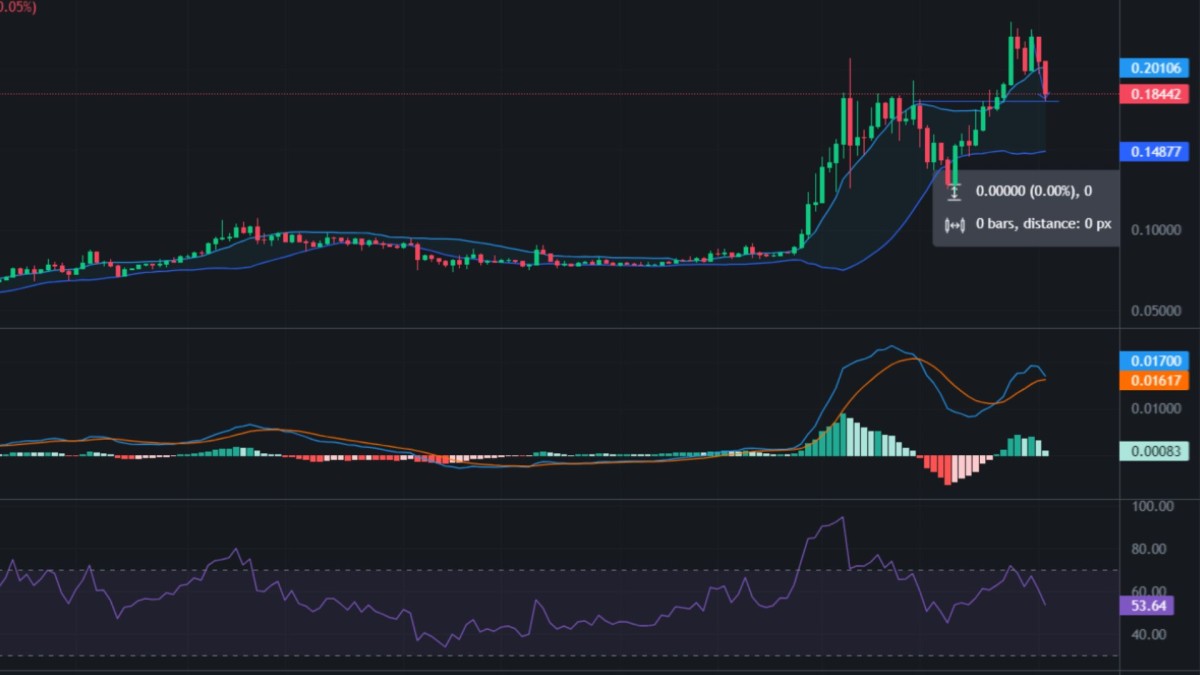
DOGE/USD 1-day price chart; Tradingview
In the current technical analysis of Dogecoin, several key indicators suggest a notable market movement. Firstly, the Relative Strength Index (RSI) stands at 53.73, indicating an uptrend condition, implying that the asset is ripe for a potential correction or consolidation phase.
Additionally, the Bollinger Bands further provide insights into the price action. The upper Bollinger Band, acting as a resistance level, is observed at $0.2011, suggesting that the price has surpassed this level, possibly signaling a bullish breakout. Conversely, the lower Bollinger Band, acting as a support level, is noted at $0.1488, indicating a potential downside support zone for the asset. Therefore, traders should closely monitor these levels and adjust their trading strategies accordingly to capitalize on potential market opportunities.
Average Price
Dogecoin has much experience both bull market and bear market therefore, trading at an average price of $0.1329 within the last 24 hours. This shows a positive sentiment as shown by our technical analysis. Therefore, constitute investment advice should be considered despite the Dogecoin’s recent surge in price in the past 24 hours.
Dogecoin price analysis on a 4-hour price chart: DOGE prices consolidate around $0.18
Relying on our technical analysis team, the market sentiment for Dogecoin is bearish, trading within its support and resistant level. Dogecoin’s price movement on the 4-hour chart reveals consolidation around $0.1828.
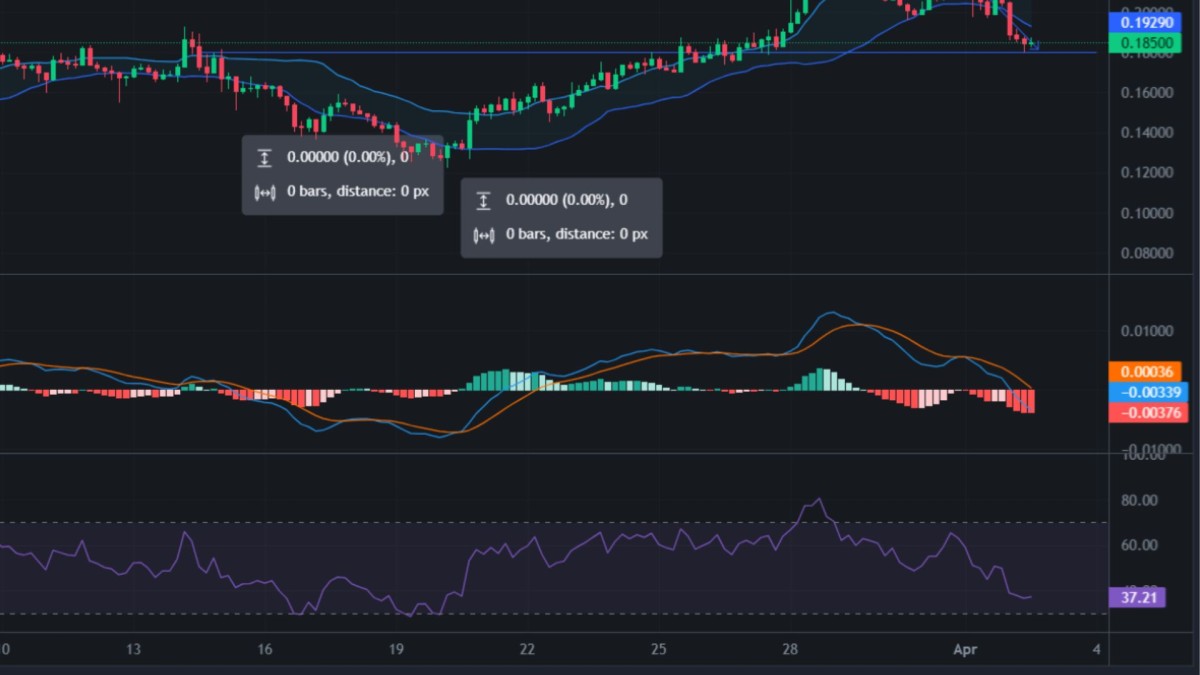
DOGE/USD 1-day price chart; Tradingview
The Relative Strength Index (RSI) is at an elevated level of 36.13, suggesting the asset is quietly oversold. This indicates that a price correction or consolidation may be possible soon as the market adjusts to this heightened selling activity.
Additionally, the Bollinger Bands offer further guidance. The upper Bollinger Band, acting as a resistance level, is identified at $ 0.2140. This suggests that the current price has reached a level where it may face resistance from further downward movement. Conversely, the lower Bollinger Band is a support level at $ 0.19270, providing a potential price floor for the asset in a downturn.
Considering these technical analysis parameters, traders should exercise caution due to the overbought conditions indicated by the RSI. Furthermore, the resistance level provided by the upper Bollinger Band may result in a temporary halt or reversal of the recent bullish trend.
As for a Dogecoin prices prediction from 2024 to 2033, it’s crucial to understand that cryptocurrency price forecasting is highly speculative and subject to market sentiment, adoption, technological developments, and external events. It’s advisable to approach long-term predictions cautiously and conduct thorough research or consult with financial experts before making investment decisions.
What to expect from Dogecoin price analysis?
Dogecoin being among the fluctuating in prices in crypto market, has greatly been affected by the trends of the cryptocurrency market. With RSI of between 36 to 70 greatly show the coin is in neutral level as the crypto whalers still revolutionize the crypto market.
On the other hand, the lower Bollinger Band support level at $ 0.1488 provides a buffer against significant downside movement in the crypto market, offering a potential price floor in case of a progressive downturn. Traders are urged to closely monitor these key levels and adjust their strategies accordingly to navigate the expected market fluctuations effectively. While bullish momentum is evident, careful risk management is essential to capitalize on potential market opportunities while mitigating potential losses.
As for a Doge price prediction from 2024 to 2033, it’s crucial to understand that cryptocurrency price forecasting is highly speculative and subject to market sentiment, adoption, technological developments, and external events. It’s advisable to approach long-term predictions cautiously and conduct own research or consult with financial experts before making investment decisions. To partake investment advice is very crucial in this volatile crypto market.
Is Dogecoin a Good Investment?
Dogecoin, the beloved cryptocurrency born out of a meme, has garnered significant attention in the crypto sphere. With its light-hearted branding and enthusiastic community, Dogecoin offers a unique investment opportunity. Despite its origins as a joke, Doge has gained traction as a legitimate digital currency, with numerous merchants and online platforms accepting it as a form of payment. The Doge blockchain boasts a robust infrastructure that supports swift and low-cost transactions, making it an attractive option for various use cases.
Moreover, Dogecoin’s widespread adoption has propelled its user base to millions worldwide. With its growing popularity, the Doge token facilitates transactions and fosters engagement within its ecosystem. Many investors view Dogecoin favorably, considering its long-term growth and utility potential. This is cheered by positive sentiment of Dogecoin prices. Our Cryptopolitan Price Prediction section will explore the factors driving Dogecoin’s value appreciation in the years ahead.
Dogecoin Recent News
DOGE surges to two-year high amidst on-chain milestones
Dogecoin being one of the listed major cryptos, has recently faced the pressure of the price fall affected by other major cryptos such as Ethereum and Bitcoin ETFs valuations. The rely of crypto asset trends by most investors has affected the price curve of Dogecoin to hold the price surge as of year 2024. However, for how long this will last is unpresented as the investors are still comprehending the market trend. This comes as a positive sentiment has dogecoin still maintains its resistance level of 0.1514 since March 5th 2024.
The price of Dogecoin is expected to rise behold the predicted price surpassing its current resistance level of 0.20021. This will be resulted by the market correction taking place form other major crypto coins as the revolutionize the market. Investors are keenly watching the incoming macro data and spot ETF inflows as a gauge of how demand for digital assets continues to evolve. This hold as correction of price in major crypto assets and Dogecoin is no of exception.
The year 2024 begun with an impressive surge of transaction fees of 739% which reflecting bull run trend of 2021. As the DOGE rally gains momentum, market analysts remain vigilant for potential signs of sustainability amid mixed on-chain signals. Therefore the price of DOGE has seen a remarkable increase of 25% in the past 24 hours, reaching a new all-time high of $0.50.
Dogecoin Price Forecast by Cryptopolitan 2024-2033
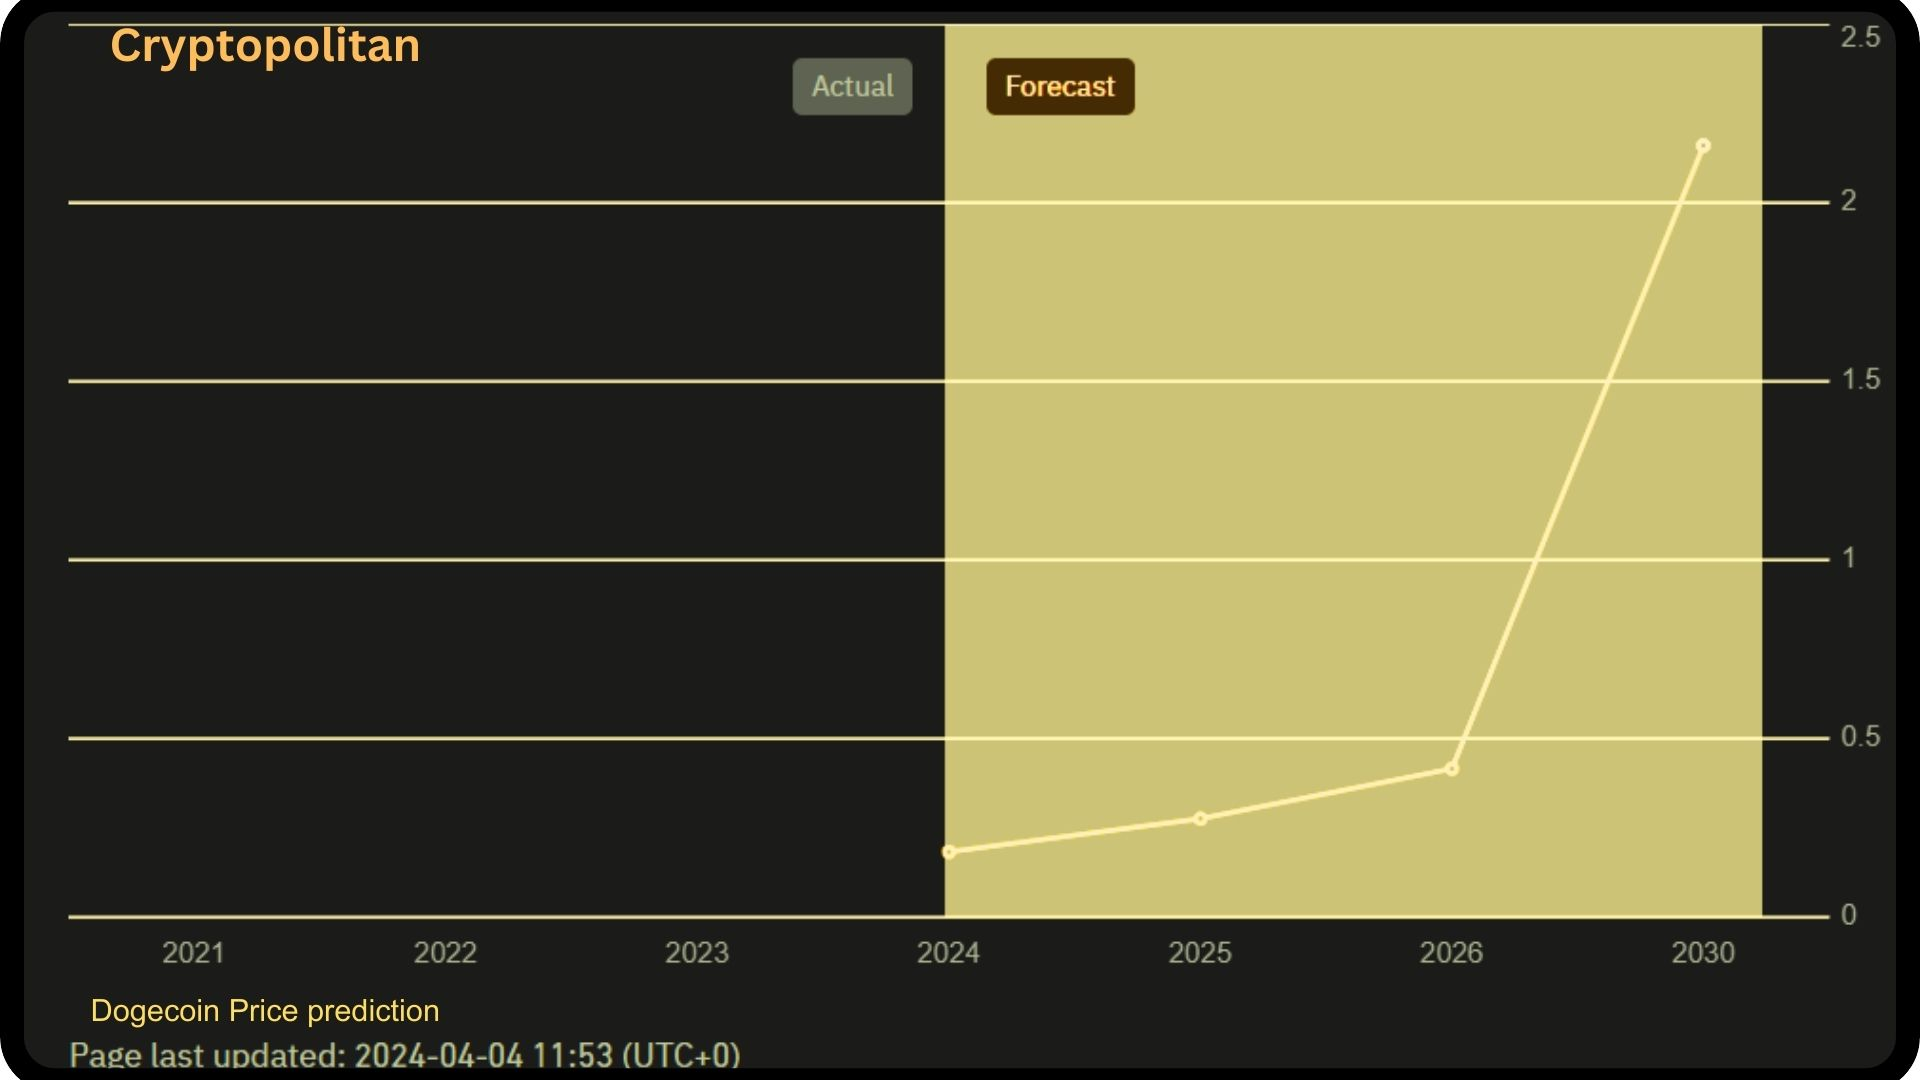
| Year | Minimum($) | Average($) | Maximum($) |
| 2024 | 0.126 | 0.1412 | 0.2314 |
| 2025 | 0.25 | 0.26 | 0.29 |
| 2026 | 0.38 | 0.39 | 0.44 |
| 2027 | 0.55 | 0.58 | 0.67 |
| 2028 | 0.4851 | 0.4985 | 0.5738 |
| 2029 | 0.73 | 0.75 | 0.85 |
| 2030 | 1.04 | 1.07 | 1.28 |
| 2031 | 1.52 | 1.56 | 1.78 |
| 2032 | 2.14 | 2.20 | 2.56 |
| 2033 | 3.17 | 3.26 | 3.77 |
By following our Dogecoin price forecast in the cryptocurrency market, it will help in making best decisions on when to buy Doge as we provide historical data, current prices and dogecoin forecast following best market trends, news, on-chainmarket analysis. Dogecoin being a meme coin has taken the trends of cryptocurrency market building reliable doge community to leverage the risk associated with cryptocurrency prices.
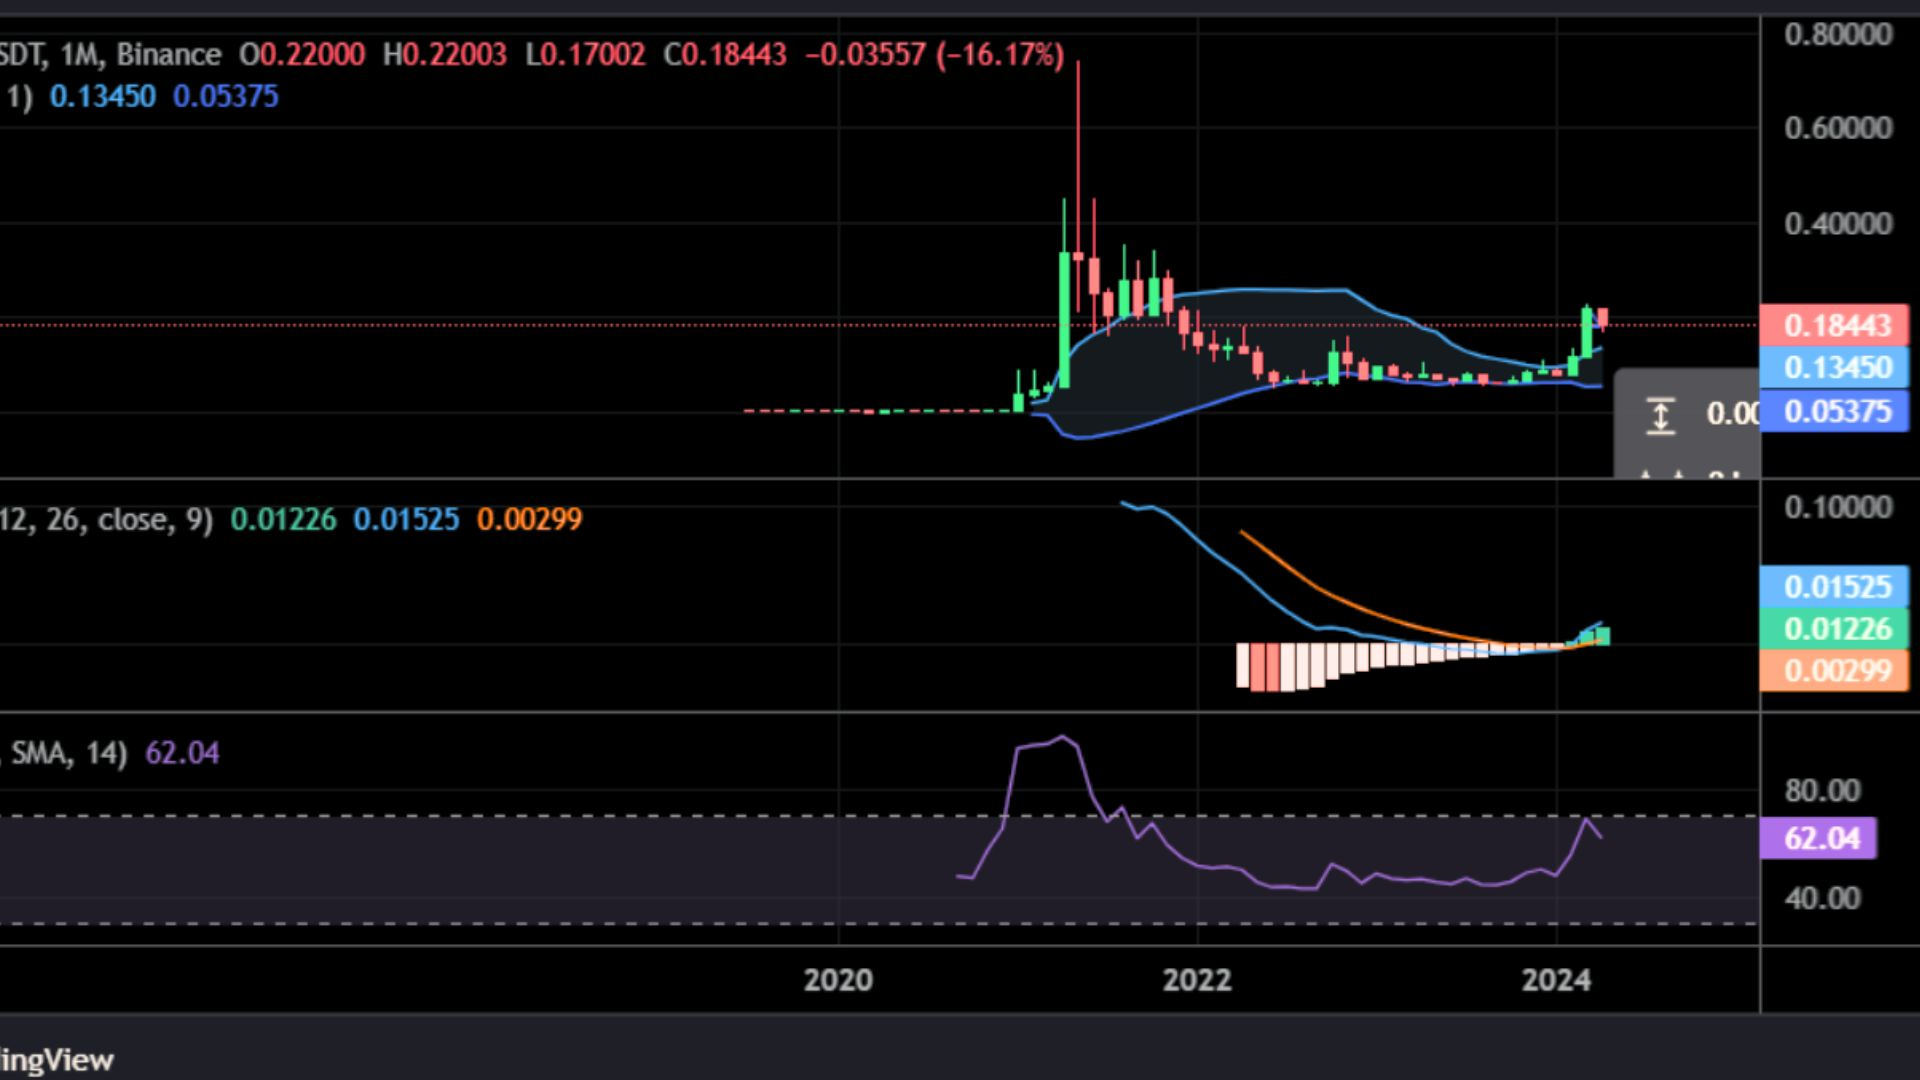
Dogecoin Price Prediction 2024
Dogecoin may surge in price to a maximum price of $ 0.2314 trading with an average price of $0.1412 by the end of the year 2024. The minimum trading price of the coin is $0.126
Dogecoin Price Prediction 2025
According to our Dogecoin price forecast for 2025, Dogecoin’s price is expected to reach a maximum price of $0.29,trading at an average price of $0.26 with a minimum of $0.25.
Dogecoin Price Prediction 2026
According to our Dogecoin forecast for 2026, Dogecoin’s value will reach a maximum price of $0.44, trading at an average price of $0.39 and with a minimum of $0.38. This show a promising future of Dogecoin
Dogecoin Price Prediction 2027
According to our Dogecoin price prediction for 2027, Dogecoin might be trading at a maximum price of $0.67, average price of $0.58 and a minimum price of $0.55. If Dogecoin continues to pursue interoperability, the network might see an increase in developers and investors, driving prices to the projected levels.
Dogecoin Price Prediction 2028
According to our price prediction for most cryptocurrencies, Dogecoin is expected to trade at an average price of $0.84, minimum price of $0.81 and maximum price of $0.97 by the end of 2028 respectively.
Dogecoin Price Prediction 2029
Our Dogecoin price prediction for 2029 is a maximum price of $0.85. Our analysts project an average price forecast of $0.75 and a minimum price of $0.73 by the end of 2029.
Dogecoin Price Prediction 2030
Based on our Dogecoin price prediction for 2030, Dogecoin will have a maximum market value of $2.04 and a minimum price of $1.67. Investors could also expect an average price of $1.75.
Dogecoin Price Prediction 2031
According to our Dogecoin price prediction for 2031, the value of this cryptocurrency is expected to increase to a maximum of $2.92 by that year. Based on our price analysis, Dogecoin’s expected minimum and average price will be $2.31 and $2.5, respectively.
Dogecoin Price Prediction 2032
According to our Dogecoin price prediction 2032, Dogecoin may reach a maximum of $4.0 and an average price of $3.37. The lowest possible price is predicted to be $3.14.
Dogecoin Price Prediction 2033
Based on our Dogecoin price forecast for 2033 indicates that the coin might reach a maximum trading price of $4.44, a minimum market price of $3.42, and an average price of $3.67.
Dogecoin Price History
2013
2013 is marked as the beginning of Dogecoin price history as that the year was launched in the market. Dogecoin’s growth was slow in the beginning but over the years it has faced drastic changes. The $3.5 million market capitalization was not worth the market’s attention. However, within a few months, it began its upward trajectory and grew exponentially.
The start of Dogecoin’s price was beyond its prediction as it surged from $0 to $0.0004 in the first days of trading. Since then Dogecoin prices expected to surge more as it was a good investment.
2014
The second-year Dogecoin prediction was disappointing as Dogecoin hit new lows and felt the pain of a market-wide downturn. Also, it faced immense competition from new coins, including Stellar, Neo, and Monero.
2015
Jackson Palmer, the co-founder of Dogecoin, quit Doge, which didn’t bode well for the coin. The year saw much negative press about Dogecoin, and many analysts predicted its death.
2018
The year 2018 was bearish for cryptocurrencies, and Doge was no different. The altcoins went down significantly in a few months.
The recovery saw the Dogecoin trade near the $0.017 level, but bullish Dogecoin predictions were short-lived as the price touched a low of $0.002 and remained there for an extended period.
2020
Dogecoin traded in a strict range of $0.002 to $0.005 for most of the year. It gained steam at the end of 2020 when Bitcoin touched new highs.
2021
In January, the Dogecoin price chart saw green candles across the chart as the month ended with the price live at 0.037 USD. In just a few days, the Dogecoin price managed a 692.14% price surge, while in April 2021, Dogecoin rose by 527.6%.
Dogecoin’s price finally fell by 22% in June, and the price declined by more than 18% in July. Recent Dogecoin price predictions show that the coin’s market price has risen after Elon’s tweets.
This Dogecoin (DOGE) price currently is $0.2 as the market value of the coin experiences a surge today. In September, Doge’s price fell by more than 26%, although, recently, we have witnessed that AMC will start to accept Dogecoin for payments.
According to the Dogecoin community, the Dogecoin network is perfect for transactions. Hence, Dogecoin projections for 2021 show that one should expect abrupt Dogecoin market changes in the short term as the price journey and abrupt price changes continue beyond 2021 as Bitcoin’s price rally continues.
Compared to prices at the start of the year, DOGE has gained massive profits in 2021, over 3100% in 2021.
2022
In 2022, Dogecoin began bearishly. During that time, the bulls struggled to sustain a breakout above the $0.20 level. In the current 4-hour chart, the Dogecoin technical analysis shows that the cryptocurrency market trades above the 50-day MA but slightly below the 100-day MA. The coin price broke out of its upper Bollinger band, with resistance at $0.135. Until it breaks the resistance, it may return to the support at $0.126 in the next few days. Doge is still trading in the green zone, and it has been up by 0.61% in the last 24 hours.
2023
In 2023, Dogecoin exhibited significant fluctuations and notable influences. The year began with Dogecoin trading around $0.08, maintaining a steady position in the crypto market as the 10th-ranked cryptocurrency by market capitalization. During the year, Dogecoin experienced a series of ups and downs, reflective of the volatile nature of the crypto market. A key moment occurred when Elon Musk completed a $44 billion deal to acquire Twitter, which led to a nearly 100% surge in Dogecoin’s price. Musk has been a vocal supporter of Dogecoin, often referring to it as the “People’s Coin.”
This surge was also fueled by speculations that Musk might integrate Dogecoin into Twitter’s operations, especially following his announcement about a paid subscription model for Twitter’s blue tick verification. Over the year, Dogecoin saw a 60% rise from its October value of around $0.05, driven by bullish market momentum and investor sentiment. Despite periods of correction and a four-week-long downward trend, Dogecoin’s price remained resilient, bolstered by positive investor sentiment and its growing reputation as a viable asset in the cryptocurrency market.
More on Dogecoin price analysis
Following the introduction of the spot Bitcoin Exchange Traded Fund (ETF), the digital currency market experienced a moderate contraction, and Dogecoin (DOGE) emerged as the front runner in this decline, registering a 1.80% dip to $0.08479 over the last 24 hours. Concerns escalate as the trading volume takes a notable hit, plummeting by 27% to $609,330,772, suggesting potential challenges for Doge price.
Interestingly, the memecoin sector, encompassing Dogecoin and Shiba Inu, exhibits signs of recovery, surpassing previous setbacks. This resurgence is attributed to substantial investor accumulation, as highlighted by on-chain data. It’s essential to note that while Doge price faces challenges, the broader cryptocurrency market landscape continues to evolve, presenting varied opportunities and trends across different assets.

Dogecoin’s 2024 Price Forecast: Navigating Expectations Amidst Market Dynamics
Market Overview
As Bitcoin inches closer to the $70,000 mark, the crypto landscape is rife with optimism, particularly within the altcoin sector. Dogecoin (DOGE), renowned for its meme coin status and a market cap of $11.26 billion, is positioned to capitalize on the broader market recovery. However, recent price dynamics hint at a potential delay in significant upward momentum, raising questions about its viability and future prospects.
Influential factors and speculations
Elon Musk’s influence remains a significant factor in Doge price trajectory. The recent surge in Dogecoin’s price followed Musk’s $44-billion deal to take over Twitter, coupled with his continuous support and advocacy for Dogecoin as the “People’s Coin.” Speculations about Dogecoin’s integration into Twitter’s functionality have fueled investor sentiment and contributed to recent Doge price spikes. This has heavily influenced the current market sentiment of Dogecoin
Influencer verdict and future integration
Influencers within the crypto community express varying opinions on Dogecoin’s future. Some, like Matt Wallace and That Martini Guy, foresee Dogecoin breaking above the $1 mark. Musk’s announcements, including the potential integration of Dogecoin with Twitter, have strengthened these speculations. However, cautious optimism is advised, considering the volatile nature of the cryptocurrency market.
How do you mine Dogecoin?
Dogecoin mining differs from Bitcoin’s Proof-of-Work protocol in several ways, one of which is by using Scrypt technology. The altcoin also has a block time of 1 minute, and the total supply is uncapped, which means there is no limit to the number of Dogecoin that can be mined. You can mine Dogecoin either solo or by joining a mining pool.
With a GPU, a Doge miner can mine the coin on Windows, Mac, or Linux. As of 2014, you can also mine Litecoin in the same process of mining Dogecoin as the processes were merged.
What can Dogecoin be used for?
Dogecoin has been used primarily as a tipping system on Reddit and Twitter to reward creating or sharing quality content. You can get tipped Dogecoin by participating in a community that uses it or get your Dogecoin from a Dogecoin faucet.
A Dogecoin Faucet is a website that will give you a small amount of Dogecoin for free as an introduction to the coin so that you can begin interacting in Dogecoin communities.
How can you buy Dogecoin?
You can buy Dogecoin or sell at any exchange offering, store it on an exchange or in a wallet, and tip it in any community that accepts Dogecoin. Click on our market pairs tab for this cryptocurrency’s latest list of exchanges and trading pairs.
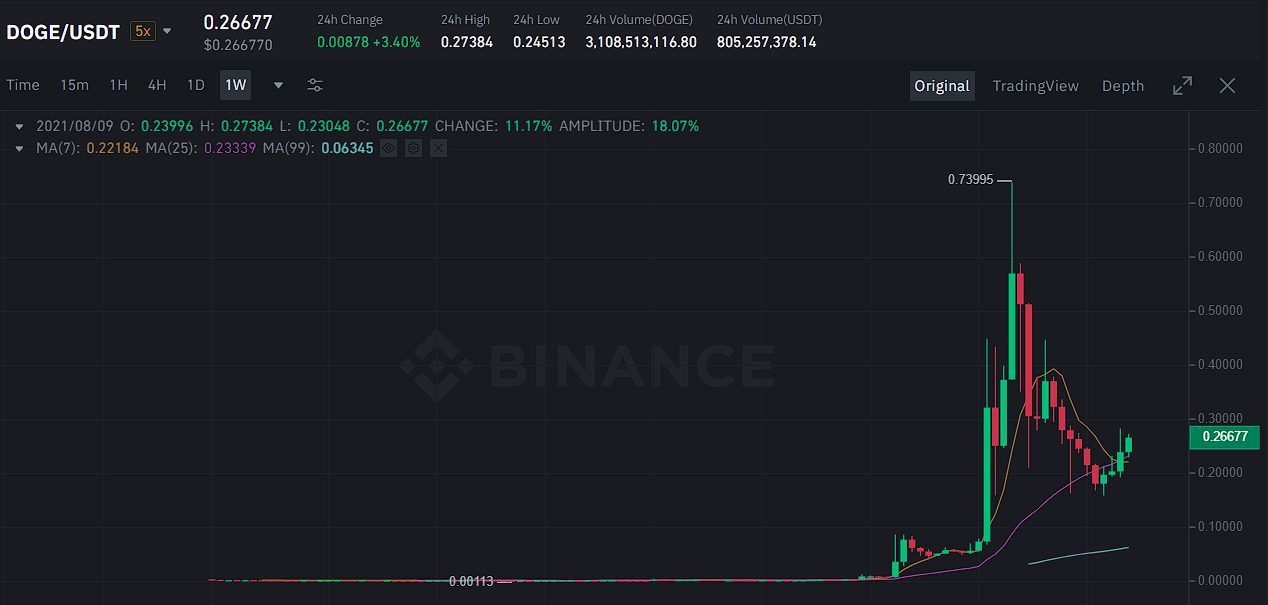
DOGE/USDT on Binance
Two hundred part-time developers and an army of internet admirers support DOGE’s operations. Many look like Ross Nicoll, a fundamental contributor who works for free to keep an ever-expanding system running smoothly. There aren’t enough resources to create proprietary code, which is why so much of its code is copied from other coins. Dogecoin’s tens of thousands of social media followers are a good example: They regularly beg the currency’s developers to limit the supply.

Dogecoin’s price will rise to $10 if investors do more than buy the currency and tweet about it. Improvements may only be made with the support of a generous donor.
Several high-profile backers have already expressed interest in the currency. Elon Musk said sometime back that his SpaceX company would launch a penny to the moon. By forming a “Dogecoin Foundation,” he may have a greater effect on the future of cryptocurrency. So far, he’s blamed the “Dogecoin Whale” for everything. Instead of hounding developers, regular investors might aid by making a financial contribution. There is a potential that Dogecoin might rise to $10 if the community comes together one day.
Conclusion
Dogecoin (DOGE) has surged to a two-year high, exceeding $0.17, driven by a substantial increase in new wallet addresses and a remarkable uptick in on-chain fees. The surge is reminiscent of the 2021 bull run, with transaction fees soaring by an impressive 739% since the start of 2024. Notably, DOGE has surpassed the milestone of 6 million wallet addresses, a significant increase from its previous all-time high in May 2024.
As the bullish momentum continues, technical analyses reveal an oversold condition with an RSI of 36.13 while the upper Bollinger Band at $0.2011 acts as a resistance level, caution is advised for potential corrections or consolidations.
Note that Doge market experience high volatility and traders should closely monitor these key levels and adjust their strategies to navigate potential market fluctuations effectively.


