- Bitcoin price remains choppy
- Bears are in control as long as prices oscillate below $11,000
- Immediate bear target is at $10,000
- Bulls building momentum in the hourly chart.
Bitcoin price prediction: Current price overview
The Bitcoin price is firm. After last week’s slides, bulls appear to be back in contention after a strong close of the week.
At the time of writing, the BTC price is changing hands at $10,680. It is down from intra-day highs of $10,759 and up from lows of $10,640.
At spot levels, bulls are in contention against the USD—at equilibrium in the last 24 hours. Notably, it remains flat versus ETH, a coin which also seems to be snapping back to bullish after last week’s fears.
Regardless of today’s trend, bears are in control in the immediate term. From a top-down approach, bulls may be in control.
However, for trend continuation, a sharp close above $11,000 and $11,200 complete with high trading volumes, unwinding losses of Sep 3 could be a breather for optimistic bulls.
Bitcoin price movement in the last 24 hours

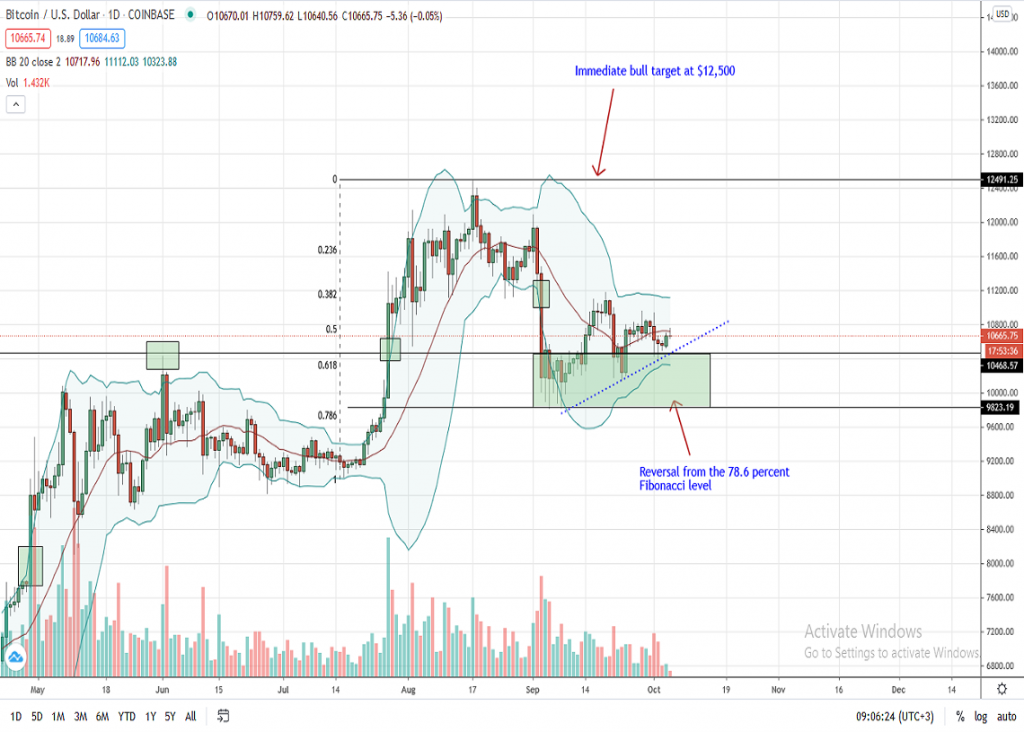
The Bitcoin price remains choppy. Although prices have marginally recovered, wiping out losses of Oct 3, bears dominate as aforementioned.
Ideally, a snap-back to trend will be if the Bitcoin price rally to above $11,000. This largely depends on the confirmation of the double bull bar reversal pattern of Sep 23 and 24.
Noticeably, trading volumes have been decent. As such, traders could be positioning themselves either for a rally that will take prices above $11,000–a round number, or a liquidation below $10,500 and even the $10,000 psychological number.
In either case, a definite trend will be established once a break above or below the current consolidation.
Odds of a retest of $9,800 will increase if bears force Bitcoin prices below the primary support trend line while a moonshot to $12,500 will be in the offing once bulls overcome the strong liquidation zone of $11,000 and $11,200.
Bitcoin price movement in the last hour

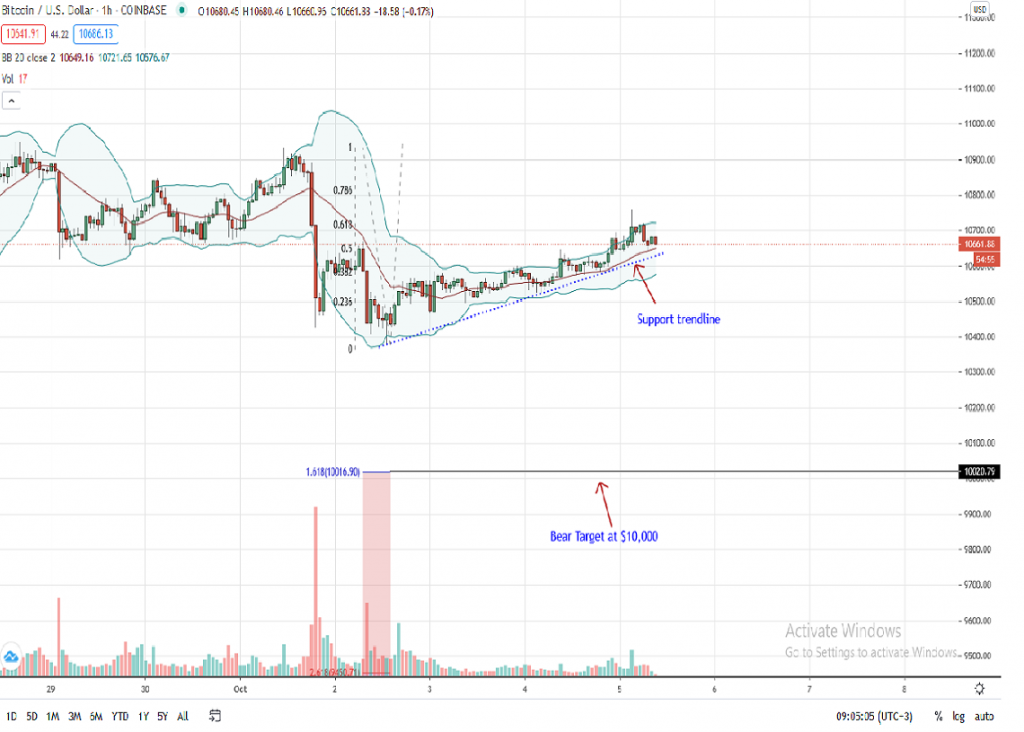
Reflective of price recovery in the daily chart, Bitcoin bulls dominate proceedings in the hourly chart. Specifically, the BTC price is up against both the USD and ETH as momentum builds up. Bullish bars are now banding along the upper BB suggesting a possible trend continuation.
Nonetheless, a firm break out demands a clear cut above $11,000 in the immediate term. Possible resistance could be found between $10,700 and $10,800 marking the Fibonacci retracement level of Oct 1 and 2 trade range.
A sharp reversal from spot levels below the main support trend line could see BTC prices fall to last week’s low of around $10,400, or $10,000, the 168.2 percent Fibonacci extension level.
Bitcoin price prediction: conclusion
Bitcoin price action is printing hints of recovery. Regardless, prices remain choppy and remain in consolidation.
For trend continuation, bears must overcome the strong sell walls between $8,800 and $10,300. Conversely, bulls will be in control if they manage to shake off liquidation levels of $11,000 and $11,300.
[the_ad id=”48512″]


