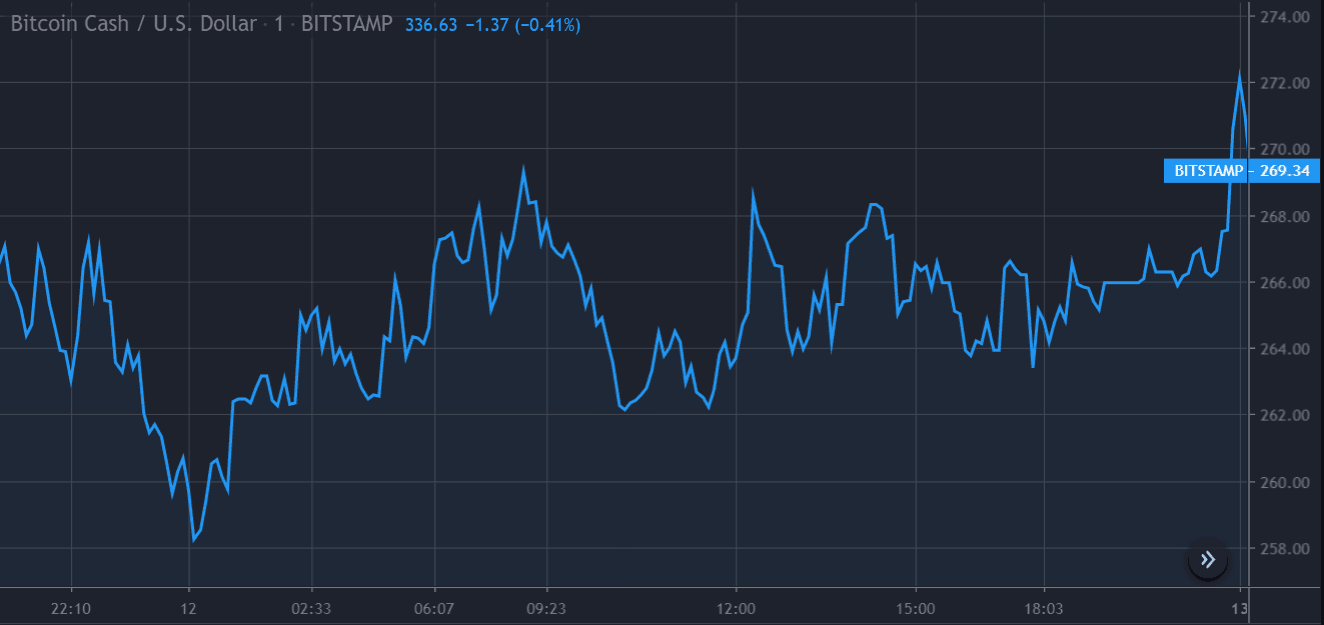
Bitcoin Cash price line exhibits a ruffled set of price movements all over the 1-Day price analysis for January 12 to reach a trading price of $269 US Dollars.
1-Day Bitcoin Cash Price Analysis (12 January)

After starting the day with a price of $258.20, the cryptocurrency moved the price line towards the $268.00 mark while exhibiting a discontinuous incline. By 09:23 GMT, the cryptocurrency turned its graph downwards and reached $262.06 by 10:10 GMT. The coin showed disheveled price movements until noon, after which it peaked above the $268.00 mark, and began trade between the $264.00 and $268.00 marks. The price line converged towards the $266.00 mark by 21:21 GMT and remained there until at 23:26 GMT when the price line saw an abrupt rise above the $272.00 mark.
The trading pair has a day’s high and closing value of 272.34 US Dollars.
Moving Average Convergence Divergence (MACD)

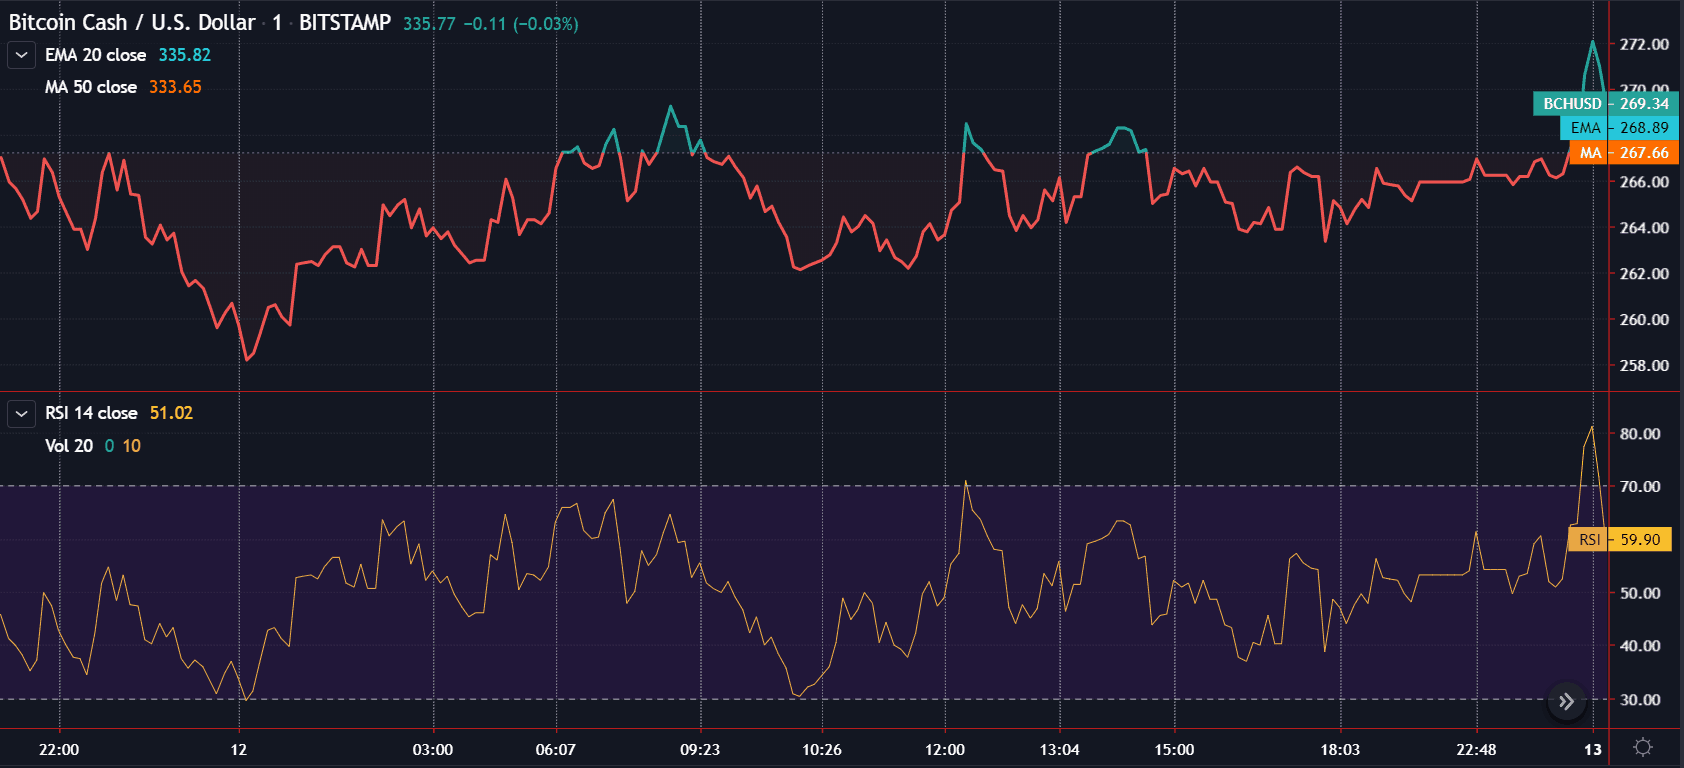
Bitcoin Cash Price Chart by TradingView
The Relative Strength Index (RSI) traced a path similar to the trading pair’s price line, where it stayed between levels 30 and 70 for all of January 12, until it rose to be just above level 80 by the end of the day. The RSI also closed the day on the same day’s high.
Featured Image Background by Dane Deaner.


