Uniswap Price Prediction 2024-2033
- Uniswap Price Prediction 2024 – up to $18.19
- Uniswap Price Prediction 2027 – up to $20.15
- Uniswap Price Prediction 2030 – up to $93.85
- Uniswap Price Prediction 2033 – up to $291.68
For anyone considering the switch from centralized finance (CeFi) to decentralized finance (DeFi), here’s a thought: Why do we constantly update the Uniswap Price Prediction? The fight is on for the survival of the fittest crypto project, and we need to keep you informed despite social media maneuvers by certain quarters!
How much is UNI worth today?
The current Uniswap price stands at $7.77, having seen a trading volume of $131,947,736 in the past 24 hours. With a market capitalization of $4,652,071,701 and a market rank of 27, it demonstrates an decrease of 3.44% over the last 24 hours.
Uniswap Price Analysis: Downtrend results in loss below $7.683 low
TL;DR Breakdown
- Uniswap price analysis confirms a downtrend.
- Coin value has dropped down to $7.683.
- Strong support is being provided at $5.346.
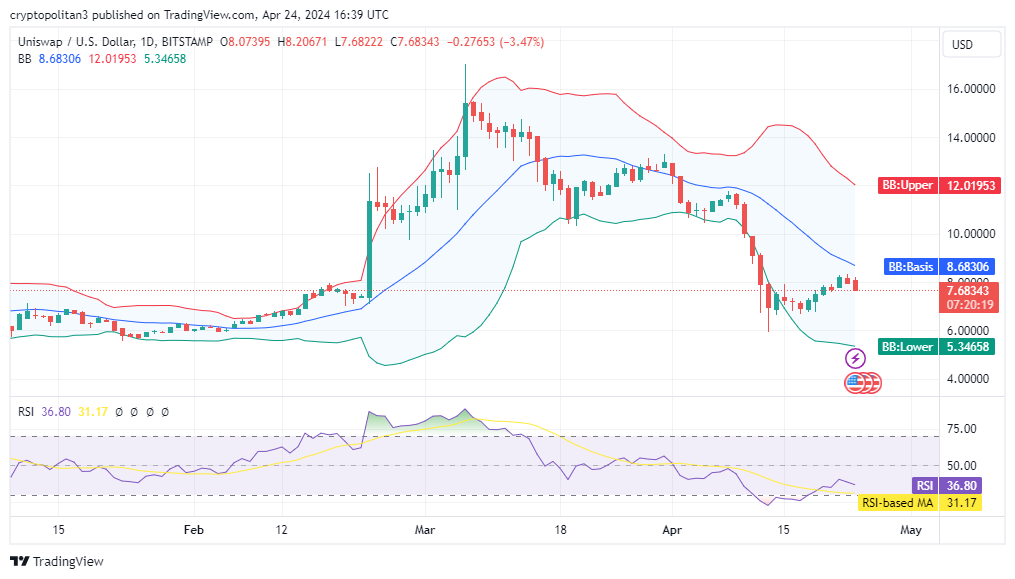
The latest one-day and four-hour Uniswap price analysis for 24 April 2024 indicates signs of a downtrend. Although the past week proved favorable for the bulls, today the bears seem to be on the leading side. Because of the growing downtrend during the last 24-hours, the cryptocurrency value has dropped down to $7.683 low.
Uniswap price analysis on a daily time frame: Bears strike back as UNI descends to $7.683
The latest one-day Uniswap price analysis depicts a highly bearish scenario regarding the ongoing market events. The bears remained on the winning end since yesterday as a continual downside has been recorded. In the past 24-hours, a further bearish wave hit the market as UNI/USD value depreciated below $7.693 marker. Because of the earlier ascent, the Moving Average (MA) value has stepped up to $7.592 as well.

The volatility is rising which is a bearish signal for the coming future. Because of the rising volatility, the upper extreme of the Bollinger bands indicator has moved to $7.683. Whereby, the lower extreme of the Bollinger bands indicator has switched to $5.346 extreme. The Relative Strength Index (RSI) indicator confirms the bearish trend as its overall value has been reduced to 36.80.
price analysis on the 4-hour chart: Upturn leads to revival above $7.683 high
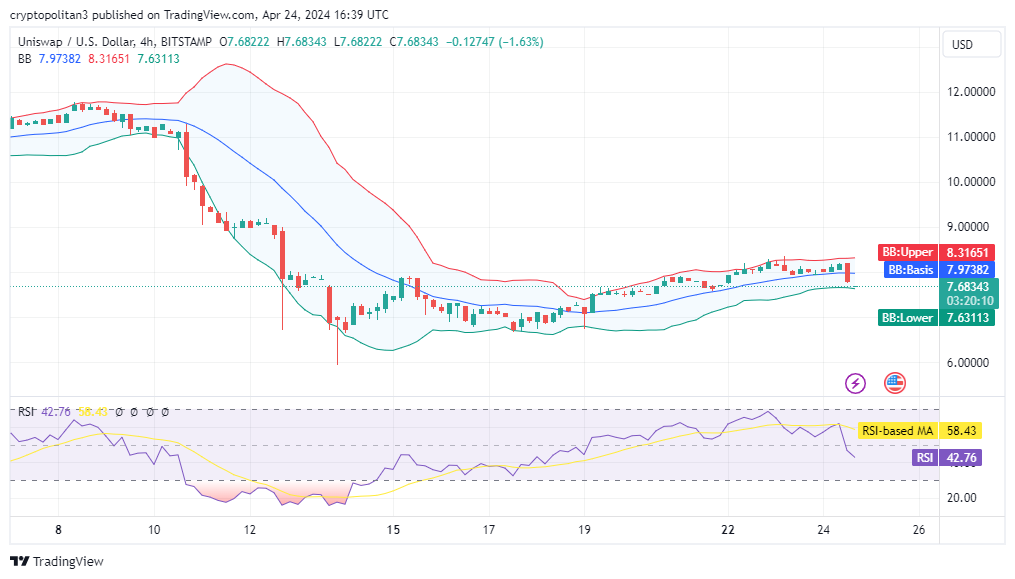
The latest four-hour Uniswap price analysis predicts an increasing trend for the cryptocurrency. Although the earlier hours remained towards the bearish side, currently the market trend is highly bullish. Because of the unexpected upturn during the last four hours, the cryptocurrency value has upgraded to $7.683 high. Side by side, the Moving Average value has been reduced to $7.988 low.

The volatility seems to be on the increasing side which is a bearish signal for the approaching hours. Because of the rising volatility, the upper extreme of the Bollinger bands indicator has switched to $8.316. Whereas, the lower extreme of the Bollinger bands indicator has moved to $7.631 end. The RSI graph displays a descending curve but its overall value has improved up to 42.76.
What to expect from Uniswap price analysis next?
The latest one-day and four-hour Uniswap price analysis confirms a declining trend for the cryptocurrency. Because of the decreasing price movement during the past 24-hours, the cryptocurrency value has deteriorated to $7.683 low. On the opposite hand, the four-hour price analysis remained favorable for the cryptocurrency buyers.
Is Uniswap a Good Investment?
Uniswap’s future is promising, marked by the recent launch of Uniswap V3, introducing features like concentrated liquidity and flexible fees, showcasing its commitment to innovation in decentralized trading. Positioned as a beacon in the growing DeFi landscape, Uniswap’s reputation and broad user base position it for substantial growth, especially with increasing interest from institutional investors. However, sustainability depends on its ability to adapt to user needs, pioneer user-centric innovations, and navigate the evolving regulatory landscape. Agility and foresight are crucial for Uniswap’s continued success in the dynamic DeFi space. Our Uniswap price forecast section provides analysis on the profitability of the coin in the coming years.
Recent News/Opinions on the Uniswap Network
Uniswap Allocates $300K for v4 Development and Liquidity Growth. Decentralized exchange Uniswap is directing a substantial $300,000 grant towards the development of its version 4 (v4) platform, with a two-year timeframe and an emphasis on targeting long-tail assets and small capitalization tokens. Despite the prevalence of v2 and v3, Uniswap aims to enhance its market presence by addressing user preferences through improved user interface and functionalities in v4. The grant’s ambitious key performance indicators include capturing 5% of Uniswap’s total value locked (TVL), approximately $150 million, within a year. With a total value locked of $4.43 billion and innovative features planned for v4, including on-chain limit orders and auto-compounded liquidity provider fees, Uniswap aims to reinforce its leadership in the decentralized exchange market, attracting both users and liquidity providers.
Pushd (PUSHD): Uniswap-Linked Decentralized Marketplace. In the current crypto market resurgence, with Solana (SOL) and Uniswap (UNI) seeing significant gains, emerging projects like Pushd (PUSHD) are gaining attention. Positioned as a decentralized online marketplace, Pushd aims to disrupt e-commerce by reducing fees and streamlining transactions through decentralization. Priced at $0.035 during its early presale, Pushd is drawing interest as a potential investment. Notably, Pushd aligns itself with the recent success of Uniswap (UNI) and leverages its first-mover advantage by eliminating traditional KYC processes in online trading. As with any crypto investment, careful research and risk assessment are crucial in this dynamic market.
Crypto Highlights: UNI and FIL Surge Amid Developments. Recent weeks have seen significant developments in the crypto market, particularly for Uniswap (UNI) and Filecoin (FIL). Uniswap’s NFT marketplace launch led to a temporary surge in UNI’s price, with analysts predicting continued growth. Filecoin’s integration with SushiSwap initially boosted FIL’s price, despite a subsequent correction; however, analysts foresee an upward trend due to an expanded user base. These developments highlight the dynamic nature of the cryptocurrency market and the diverse factors influencing token prices.
Bots cover up to 90% of Uniswap trading value according to the latest analysis as done by Glassnode. The human traders investing in Uniswap have receded to a minute percentile of 7% and 28%. Almost 90% of UNI/USD trading value is being supported by bots from the preceding support of 80%.
Uniswap Labs introduced UniswapX— an innovative decentralized protocol enabling permissionless trading across Automated Market Makers (AMMs) and various liquidity sources, designed with an open-source license (GPL). Expect enhanced liquidity, improved pricing, protection against Miner Extractable Value (MEV), and gas-free swapping for users as the platform evolves.
Uniswap Labs introduces hooks, which function as powerful plugins allowing developers to inject code at critical stages in a pool’s lifecycle, such as pre or post swaps. This groundbreaking feature empowers developers to leverage Uniswap’s liquidity and security infrastructure, enabling them to design pools with unique functionalities. By exposing tradeoffs in Uniswap v3, hooks provide developers with the autonomy to make informed decisions and integrate custom features into the core pool contract, fostering further innovation in the ecosystem.
Uniswap Price Predictions for 2024-2033
Price Predictions By Cryptopolitan
| Year | Minimum ($) | Average ($) | Maximum ($) |
| 2024 | 8.55 | 8.79 | 18.19 |
| 2025 | 12.18 | 12.53 | 20.15 |
| 2026 | 17.58 | 18.21 | 21.11 |
| 2027 | 25.73 | 26.46 | 30.89 |
| 2028 | 36.39 | 37.71 | 44.50 |
| 2029 | 53.98 | 55.87 | 63.22 |
| 2030 | 76.04 | 78.83 | 93.85 |
| 2031 | 109.49 | 113.43 | 133.76 |
| 2032 | 166.79 | 171.32 | 189.96 |
| 2033 | 239.69 | 246.55 | 291.68 |
Uniswap Price Prediction 2024
In 2024, the anticipated minimum value of Uniswap is $8.55. The price may peak at $18.19, with an average trading price of $8.79 throughout the year.
Uniswap Price Prediction 2025
The 2025 forecast suggests a minimum price of $12.18 for Uniswap. It might reach a high of $20.15, averaging around $12.53.
UNI Price Forecast for 2026
For 2026, Uniswap is projected to have a minimum price of $17.58. The price could soar up to $21.11, with an average of $18.21.
Uniswap (UNI) Price Prediction 2027
In 2027, Uniswap’s price is anticipated to hit a minimum of $25.73. The maximum price might reach $30.89, with an average trading value of $26.46.
Uniswap Price Prediction 2028
The 2028 forecast for Uniswap predicts a minimum price of $36.39 and a maximum of $44.50, with an average price of $37.71.
Uniswap Price Prediction 2029
Uniswap’s price in 2029 is expected to start at a minimum of $53.98 and could climb to $63.22, averaging at $55.87.
Uniswap (UNI) Price Prediction 2030
For 2030, the lowest forecasted price for Uniswap is $76.04, potentially rising to a high of $93.85, with an average of $78.83.
Uniswap Price Forecast 2031
The predicted minimum price for Uniswap in 2031 is $109.49, with a potential maximum of $133.76 and an average price of $113.43.
Uniswap (UNI) Price Prediction 2032
In 2032, Uniswap is predicted to have a minimum value of $166.79 and could reach up to $189.96, with an average trading price of $171.32.
Uniswap Price Prediction 2033
For 2033, Uniswap is forecasted to reach a minimum of $239.69, with a potential peak at $291.68 and an average price of $246.55.
Uniswap Price Prediction By Coincodex
According to the current Uniswap price prediction by Coincodex, Uniswap’s price is expected to decline by -6.18%, reaching $12.13 by March 10, 2024. Coincodex’s technical indicators suggest a bullish sentiment, while the Fear & Greed Index indicates 90 (Extreme Greed). Over the past 30 days, Uniswap has seen 17/30 (57%) green days with a price volatility of 26.23%.
Coincodex forecasts suggest it is an opportune moment to invest in Uniswap. Historical data on Uniswap’s price movements and BTC halving cycles inform a prediction that the lowest Uniswap price in 2025 could be around $11.50. Furthermore, Uniswap’s price is anticipated to peak at $27.22 in the following year.
Uniswap Price Prediction By DigitalCoinPrice
Digital Coin Price suggests that there is a potential for Uniswap to surpass the $34.57 mark and secure its position in the market by the end of 2025. The forecast indicates that the lowest price for Uniswap will range between $28.56 and $34.57, with a more probable stabilization at approximately $32.98 by the end of 2025.
Despite the volatile nature of Uniswap’s value and concerns over its environmental impact due to energy consumption, billionaire venture capitalist Tim Draper remains firm in his forecast, expecting Uniswap to hit $34.57 by the conclusion of 2025 or in early 2026, as reported by Digital Coin Price.
Uniswap Price Predictions By CryptoPredictions.com
According to CryptoPredictions.com’s UNI price prediction, Uniswap is forecasted to commence in April 2024 with an opening price of $9.332 and conclude the month at $11.347. Throughout April, the highest projected price for UNI is $11.816, while the lowest anticipated price is $8.035.
UNI Overview
To clarify the various facets of Uniswap, especially for those new to the platform, it’s important to understand its key components. Uniswap Labs is the company responsible for developing both the Uniswap protocol and its web interface. The protocol itself is a suite of persistent, non-upgradable smart contracts on the Ethereum blockchain that together form an automated market maker. This allows for peer-to-peer market making and the swapping of ERC-20 tokens.
To interact with this protocol, users can utilize the Uniswap Interface, a user-friendly web interface designed for this purpose. However, it’s worth noting that this interface is just one of many ways to engage with the Uniswap protocol. Additionally, the platform has a governance system, known as Uniswap Governance, which is enabled by the UNI token and oversees the rules and future development of the Uniswap Protocol.
Uniswap Price History
Although the decentralized exchange (dex) has been around since 2018, it wasn’t until 2020 that the Uniswap cryptocurrency token came into existence. In the first year of its release, it had an initial price of just $3.00. However, because of the ferocious hype surrounding it, Uniswap price change increased to $7.00 by 19 September 2020, according to CoinMarketCap.
After the hype and excitement began to wind down, the price also began to fall, but it did not experience a drastic price change than other tokens, nor was its all-time low after the fact. Its all-time low was at $1.03 on 17 September 2020, before its price increase, according to CoinGecko.
Although, CoinMarketCap states its all-time low to be $0.4190 on that same day. It experienced an all-time high of $8.44 a day after it calmed down and declined. UNI’s price continued to decline as the months rolled by, although it never went below $2 before it again began to increase slowly, thanks to the 2020 bull run.
UNI finished the year 2020 with a price of $5.00. Since then, it has continued to increase, being on the verge of surpassing its former all-time high.
Uniswap operates on a decentralized P2P exchange automated market maker (AMM), away from conventional cryptocurrencies. Before we dig into the Uniswap price prediction, let us look at some of the unique features of Uniswap.
Being linked to Ethereum enabled as two smart contracts, Uniswap has a unique provision of liquidity providers (LPs). This unique feature of Uniswap acts as a significant catalyst in removing the hurdle concerning token mining. In a manner, it promotes transparency by eliminating intermediaries or permission.
Hence, digital assets are linked as pairs instead of individual cryptocurrencies. As a decentralized protocol for automated liquidity provision on Ethereum, Uniswap took the entire crypto space by surprise during the pandemic; Uniswap decided to launch this token UNI on 17 September 2020.
More on the Uniswap Network
Is it a good time to invest in Uniswap?
The new year 2023 has been quite positive for the big cryptos, with Bitcoin trading above $20k for the first time since November 2022. Uniswap has had a similar trajectory and could see more gains in the coming weeks and months. Besides, UniSwap is undoubtedly a credible DEX among crypto investors, and they prefer UNI coins to invest in because of its market performance and good investment returns. This is not investment advice.
Who is the Uniswap Founder?
Uniswap was created on 2 November 2018 by Hayden Adams, a former mechanical engineer at Siemens. He informed his followers through Twitter that it is only a few weeks since the launch of the Uniswap v3, and it is already the highest volume DEX protocol on OxPolygon. He further noted that its price is only $45 million on TVL.
Uniswap (UNI) is one of the most prominent decentralized finance (DeFi) exchanges. The DeFi protocol was founded in 2018 by former mechanical engineer Hayden Adams. The Uniswap exchange functions as a 100% on-chain automated protocol market maker on the Ethereum blockchain. The AMM allows DeFi users to swap ether (ETH) for any ERC-20 token without intermediaries, solving many liquidity problems most exchanges face.
How does Uniswap work?
Uniswap pioneered the Automated Market Maker model, in which users supply Ethereum tokens to Uniswap “liquidity pools,” and algorithms set market prices based on supply and demand (as opposed to order books matching bids and asks from users on a centralized exchange like Coinbase).
By supplying tokens to Uniswap liquidity pools, users can earn rewards while enabling peer-to-peer trading. Users supply tokens to liquidity pools, trade tokens, or even create and list their own tokens (using Ethereum’s ERC-20 token protocol). There are currently hundreds of tokens on Uniswap, and many popular trading pairs are stablecoins like USDC.
Some of the potential advantages of decentralized exchanges like Uniswap include the following:
- Self-governing: Funds are never transferred to any third party or are generally subject to counterparty risk (i.e., trusting your assets with a custodian) because both parties are trading directly from their own wallets.
- Global and permissionless: There is no concept of borders or restrictions on who can trade. Anyone with a smartphone and an internet connection can participate.
- Ease-of-use and pseudonymity: No account signup or personal details are required.
Uniswap Smart Contracts
Uniswap is just a bunch of smart contracts that work together to make a decentralized exchange. Smart contracts are uploaded to the blockchain, and since it’s on the blockchain, the code has the same immutable, decentralized, and borderless capabilities as cryptocurrencies. Smart contracts can transfer money autonomously based on the parameters in the code, allowing for highly efficient financial services.
Investors send their cryptocurrency or coin funds to a Uniswap smart contract to earn interest on their holdings; these investors are referred to as liquidity providers. The smart contracts that hold their cryptocurrency are called liquidity pools.
Liquidity providers are necessary for Uniswap to operate, as it’s how they can provide liquidity to trade on the platform. Instead of ordering books, the smart contract calculates the price of each cryptocurrency market asset. This is how a Uniswap smart contract works.
Why do people trust UNI?
People have become aware that one can not turn a billionaire in the short term or long term when one invests wisely in crypto. Hence they buy tokens based on the coin’s long-term actual performance. This is all the more reason for you to be in UNI for the long term, not the short-term gains.
Why is UNI keeping steady despite the bear market?
The credit goes to the faith investors have reposed in the asset. At the same time, it is an excellent reason that UNI is listed on the exchange to show excellent performance. This triggers investor response and shows a great deal of motivational sentiment—no wonder the token shows a constant up-rise consequently. Our perfectly optimized content goes here!

Uniswap is just a bunch of smart contracts that work together to make a decentralized exchange. Smart contracts are uploaded to the blockchain, and since it’s on the blockchain, the code has the same immutable, decentralized, and borderless capabilities as cryptocurrencies. Smart contracts can transfer money autonomously based on the parameters in the code, allowing for highly efficient financial services.
Investors send their cryptocurrency or coin funds to a Uniswap smart contract to earn interest on their holdings; these investors are referred to as liquidity providers. The smart contracts that hold their cryptocurrency are called liquidity pools.
Liquidity providers are necessary for Uniswap to operate, as it’s how they can provide liquidity to trade on the platform. Instead of ordering books, the smart contract calculates the price of each cryptocurrency market asset. This is how a Uniswap smart contract works.
How to reduce price impact on UNI
- Change the Uniswap Exchange Version. Choose among the Uniswap versions, V1 (old version) and V2 new version V3. On the bottom navigation bar, you will select V1 as the version you want to use to transact the swap. You will check that you understand the disclaimer and click on continue with V1 for the transaction.
- Break down transactions and reduce the number of purchases. The price impact mechanism is problematic for big transactions. This problem can be solved by reducing the number of assets for trade and buying or selling the desired amount of transactions.
- Changing the price slippage tolerance. Due to excessive price fluctuations and the lengthy process of registering a buy or sell transaction in decentralized exchanges, an increase in price slippage helps to complete the transaction.
Also Read:
- Uniswap price analysis: UNI/USD rises to $7.07 after a massive bullish run
- Staking on Uniswap for Passive Income
- Extreme crypto fear is a good buying opportunity?
- All Your Uniswap v3 Liquidity Farming Calculations Are Dead Wrong! Here’s Why
Conclusion
Uniswap’s Version 3 (v3) was launched on Boba Network after receiving approval from the Uniswap DAO. The proposal, which received support from ConsenSys and FranklinDAO, was voted on by the DAO community, with a majority voting in favor of the deployment.
Once the deployment is completed, Uniswap will have the chance to expand its user base by incorporating members from the Boba Network ecosystem, thereby significantly increasing the decentralized exchange’s total value locked and transaction volume. As a result, it may soon push the Uniswap token’s price above crucial resistance levels.
The decentralized finance (DeFi) sector has been one of the most impacted by the current bearish trend. Uniswap is one of the tremendous DeFi platforms, and its native token, UNI, has been witnessing massive volatility in tandem with the wider crypto market. However, the price momentum has been brought to a stabilized zone following several integrations and developments to the network, keeping users glued to the platform. Looking at its roadmap, Uniswap may become the most dominating and used DeFi platform in the next few years as the team is ambitious about accomplishing its project’s goal.
The ongoing developments of the Uniswap platform have attracted a wide range of investors and crypto analysts to produce their viewpoints on future price movements. Uniswap provides excellent hope to the crypto community as the platform offers developers advanced tools to build innovative decentralized applications.
Forecasters provide mixed predictions about the UNI token’s future prices as the bullish forecast suggests a value of over $122 by 2030, whereas the bearish prediction lies near the $20 price barrier. A famous crypto analyst, Mr. Legend Crypto, predicts that the UNI token will surpass its previous highs and pave its way for a bullish move up to $105!
Uniswap will begin recovering in 2023 as the crypto market recovers from the crypto winter. It is impossible to tell when Uniswap will hit bottom, but it is undoubtedly undervalued and will be profitable in the coming years. Despite not sustaining its pricing beyond a honeymoon period, the Uniswap protocol has proven useful for early adopters. Analysts, however, are a little more cautious moving forward since the Uniswap protocol’s success is crucial. Consider the reasons for the bullish price:
- Uniswap has become the largest and most dominating decentralized exchange protocol on the Ethereum network, implementing an open-source infrastructure with an automated liquidity protocol integration. The Uniswap DEX offers users a free listing of their tokens and a quick swap between tokens without registration.
- Uniswap Exchange is extremely safe, as it operates as a decentralized exchange and liquidity pool and is built on Ethereum, meaning it has the same security as the Ethereum blockchain. Since it is decentralized, there is no central server to hack and gain access to users’ funds.
- Uniswap is also famous for its commitment to growth. Not too long ago, its community members voted to create a Uniswap Foundation, focusing on improving community governance and distributing grants to several projects in the Uniswap ecosystem. Also, WEB3 advancements will be a significant fuel; however, unfavorable legislation and market crashes might derail the positive performance of Uniswap.
Please be advised that all predictions for UNI cryptocurrency prices are extremely speculative and do not represent sound financial advice. Any significant investment demands thorough investigation and advice from knowledgeable professionals. Always use caution when trading, and never risk more money than you can afford to lose. Doing your own research is highly advised when investing.


