- Bitcoin trend is touching the $19,000 mark as bulls near exhaustion
- BTC price is repeatedly rejected form $19,000 high as traders exercise caution
- Overbought technical indicators are signalling a reversal is on the cards

Uncertain Bitcoin trend sparks fear among bullish investors
The current Bitcoin trend is unable to break $19,000 resistance. BTC is consolidating near the $18,100 mark for a second consecutive day. The zig-zag action has the made the traders nervous who are moving ahead cautiously, keeping in mind the red technical signs.
The daily timeframe charts are deeply in overbought territory. The pair is facing considerable selling pressure near the annual high of $18,965. Bulls will have to muster serious liquidity to surpass $19,000 resistance and achieve the next all-time highs on the weekly charts. The BTC/USD pair needs a healthy correction if it wants to move forward.
Bitcoin price movement in the last 24 hours undergoes consolidation before next bull run
The long-to-short ratio on the crypto exchanges reflects how Bitcoin behaves on the volume front. It shows that BTC traders have pocketed gains and are now exploring their next moves. The net short positions are beginning to pile up significantly after the pair crossed $18,000. However, substantial short positions capable of damaging the price are not seen yet.
Once again, on-chain metrics shows traders are cautious, but they are not overly bearish yet. They are gauging the market sentiment before taking a different stand. A FOMO was observed among top BTC traders when the price touched $17,500. The same group had reduced its net long exposure when the pair struggled past the $18,500 level. The data shows how the top traders are waiting for clear signals to re-enter the market.
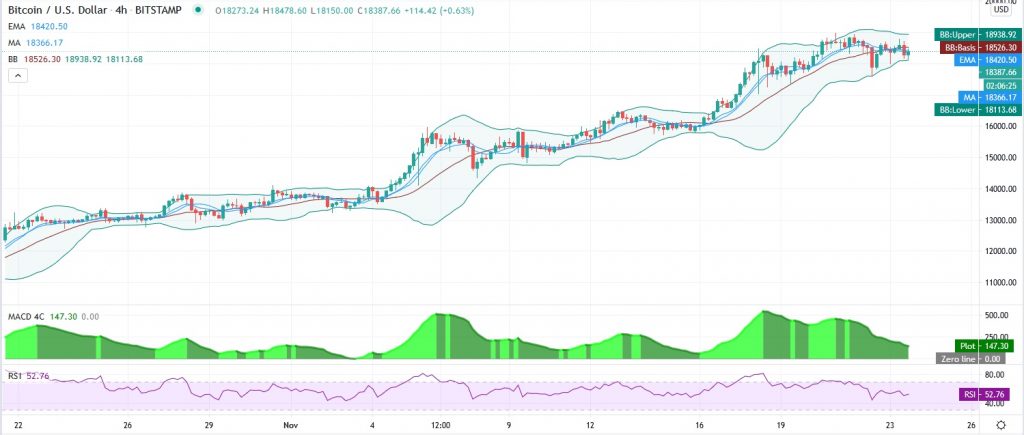
BTC/USD 4-hour price chart – Narrow price range awaits a breakthrough

While traders wait on the sidelines before going long, the futures shows that participants are willing to churn out even 20 percent annualized to maintain leveraged positions. Such is the confidence among bullish investors that they are taking 20 percent risk on futures positions. Naturally, the same belief is seen in the hourly Bitcoin trend.
The extreme optimism can be seen in the BTC price movement, which is unwilling to go below narrowing Bollinger Bands. Even cascading sell orders on the hourly timeframes are not able to bring the price down. The RSI has come down marginally from overbought readings. Also, the MACD is set to touch the neutral zone. This means that the Bitcoin trend is set to chart a new course, at least on the hourly front.
The lack of conviction is leading to a zig-zag pattern on the charts. The price is moving entirely between the upper and lower ends of the Bollinger Bands. Additionally, the rising wedge pattern is another precursor to mild correction due for Bitcoin trend.
To correct or not to correct – BTC bulls face a dilemma
On-chain data shows that many investors sit on the sidelines as they avoid going long on such elevated price levels. The tone down of FOMO in retail investors also signals that the bull run is nearing exhaustion. A sharp pullback may materialize, and if it happens, it will turn out to be healthy for the bullish Bitcoin trend.
In the last two months, Bitcoin has not corrected more than 5 percent. The cryptocurrency has risen by more than 84 percent in the past ten weeks, and it is now stretching the overbought technical indicators. The unstoppable bull run makes participants nervous about a sharp pullback that can take down multiple support levels in case selling intensifies.
But critics will argue whether substantial price decline is always necessary? In extended bull runs that go on for weeks, the price can remain elevated without caring about overbought technical indicators. Here, the price breaks through successive higher resistances without any meaningful decline. Mature assets can undergo healthy bull runs before settling near higher highs to mark new pivot points. The nominal annualized premium of futures contracts indicates how the BTC/USD pair is safe even at overbought levels.
Bitcoin trend to remain hazy on the hourly timeframes
On the hourly timeframe, the BTC/USD faces considerable resistance at the $18,645 level. The $17,430 is emerging as a critical support region. Bulls will defend the pair first at $17,430. In case the sell-off extends, the pair can test lower supports at the $16,750 level.
The first support at hourly charts remains t the $18,490 level, which has held well for the past few corrections. The 5-day EMA also lies near this level. The Bollinger Bands are getting narrower, which means that Bitcoin trend will soon witness a breakout. The bullish pennant pattern near the $17,600 support level will be an essential pivot point to observe a turnaround post price correction.
Disclaimer. The information provided is not trading advice. Cryptopolitan.com holds no liability for any investments made based on the information provided on this page. We strongly recommend independent research and/or consultation with a qualified professional before making any investment decisions.


