The Golden Ratio is a mathematical formula that can be found in nature, architecture, and art. It’s also been applied to the world of cryptocurrencies, providing an interesting and powerful way to evaluate potential investments.
The Golden Ratio has been used for centuries in art, architecture, and design, and is often referred to as the “Divine Proportion” due to its presence in many sacred works. It’s also known as the Fibonacci Sequence after Leonardo Fibonacci, who wrote about it extensively in his book Liber Abaci.
In this article, we’ll explore how the Golden Ratio works and why it has become so popular with crypto traders.
What Is The Golden Ratio?

The Golden Ratio is a number derived from dividing a line into two parts so that the longer part divided by the smaller part is equal to the whole length divided by the longer part.
The ratio is expressed as Phi (φ) and generally equals 1.6180339887498948482… This number is special because it appears throughout nature in everything from the spiral pattern of a nautilus shell to the shape of a hurricane.
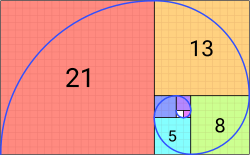
The Golden ratio is a concept deeply rooted in mathematics, calculated precisely to 1.618 when derived from the Fibonacci sequence – a set of progressively increasing numbers originally conceptualized by Leonardo Fibonacci.
Within this sequence, each successive number is the sum of the two previous numbers: 13 = 5 + 8, 21 = 8 + 13, 34 = 13 + 21, and so on. What’s especially intriguing about this equation is that when considering any two successive numbers in the sequence, their ratio is always 1.618.
When expressed as percentages, this ratio has become quite useful for the analysis of cryptocurrencies, particularly in relation to four key techniques: retracements, arcs, fans, and time zones.
Techniques leveraging the Golden ratio provide crypto traders with wider context around certain market movements as they act as predictive measures which enable users to anticipate price changes more effectively.
How is the Golden Ratio used in crypto analysis?
The Golden Ratio provides an interesting way to evaluate potential investments by providing traders with insight into trends and price movements that are otherwise unseen.
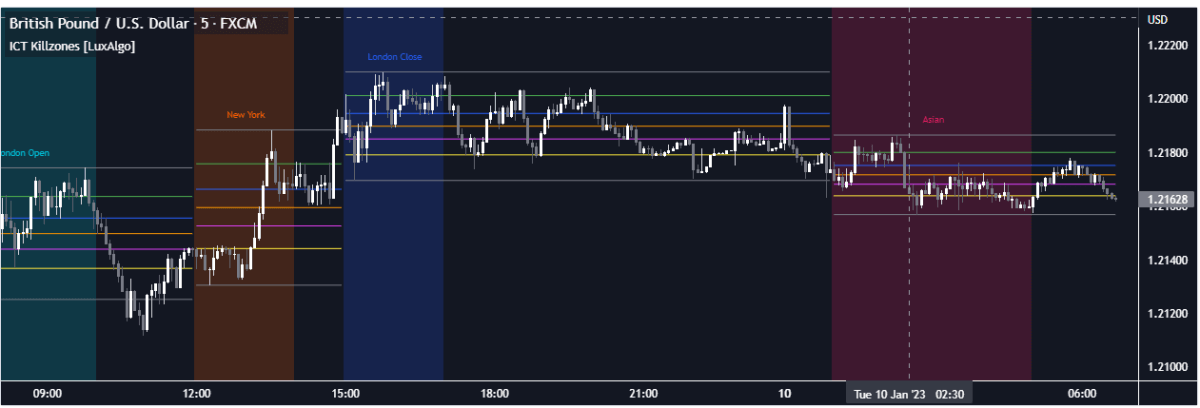
By using the Golden Ratio, traders can identify support and resistance levels for a particular asset by plotting it against the Fibonacci Sequence. These sequences help traders determine when to buy or sell assets based on their own risk appetite. They also provide an indication of how far a price may move over a given period of time.
Another way in which the Golden Ratio is used in crypto is through Elliott Wave Theory. This theory suggests that markets move in waves, with each wave being identified using the Fibonacci Sequence. By studying these waves, investors can gain insight into potential turning points for a particular asset and make more informed trading decisions.
Golden Ratio technical analysis

The Golden Ratio, a concept of notable importance in technical analysis, translates into three key retracement levels at 38.2 percent, 50 percent, and 61.8 percent. These retracement levels act as guideposts of sorts for the movement of crypto prices, allowing analysts to take a closer look at potential entry and exit points.
However, when conditions require further precision, additional multiples can be employed; the 23.6 percent, 161.8 percent, and 423 percent retracements can prove to be quite beneficial in this pursuit.
If needed, other multiples from the Fibonacci sequence may also be used to fine-tune projections for the crypto movement and help develop a more accurate perspective on investment decisions.
Golden Ratio retracement
When gaining an understanding of the financial market, retracement levels of 38.20 percent, 50 percent, and 61.80 percent play an important role in determining key support and resistance positions.
This phenomenon works by creating horizontal lines on daily, weekly, and monthly charts that are plotted acknowledging the high and low points of a trend – thereby assisting traders with locating buying/selling momentum.
These levels have become increasingly appreciated among market cultivators trying to better comprehend the fluctuations within this ever-changing landscape. A sharp focus on these offered points can help form a more clarified perspective with regard to administering dependable strategies.
Golden Ratio Arcs
Plotting support and resistance levels with Arcs is a helpful technique for analyzing market trends. In this approach, the highs and lows are connected by semi-circular shapes that allow us to consider three various percentages: 38.2%, 50%, and 61.8%.
The shape of the circle widens in response to a significant price increase, thus providing an indication that prices may follow similar patterns when testing support or resistance. This method of plotting gives greater clarity on the strength or weaknesses of certain movements, allowing us to make more precise forecasts regarding future market activity.
Golden Ratio time zones
Time Zones are a powerful tool for analyzing prices, as they allow one to identify recurring price movements over a much longer period of time than most other methods.
This is especially useful in eliminating sudden and drastic volatility, as it indicates a certain steadiness in the asset’s trajectory.
These zones are marked by vertical lines according to the golden ratio, which theoretically serves as an ideal marker when forecasting future events.
As such, this technique provides investors with key insights into the crypto’s movement, ensuring more accurate and reliable decisions when trading.
Golden Ratio multiplier
The Golden Ratio Multiplier is an algorithmic tool for predicting movements in cryptocurrency markets. It analyses the adoption curve and market cycles of a crypto asset over medium to long-term time frames, using multiplications of the 350-day moving average (350DMA) to identify areas of potential resistance to price movements.
Through the rigorous application of this methodology, it has been consistently successful at pinpointing intracycle highs and major market cycle highs, providing advanced analysis capabilities to crypto traders and investors.
Trading psychology
The Fibonacci sequence is a popular phenomenon in technical analysis as it helps to identify support and resistance levels, contributing to an overall conviction in trading decisions. By combining this with other technical indicators, investors gain insight into the markets and identify better entry and exit points for their investments.
Through examining candlestick patterns with reference to the Fibonacci ratios, crucial cues can be gleaned even in trending markets.
By observing volatility around the identified support and resistance levels generated by the Fibonacci sequence while monitoring volumes, investors are able to properly gauge entry and exit points with a medium-term vision.
Risks of using the Golden Ratio trading strategy in crypto
Figures derived from this phenomenon are only estimates of what could possibly happen in the future.
Due to their popularity among traders and investors, these points often become self-fulfilling prophecies – resulting in more false signals than actual profitable trades. As such, traders must be especially careful when relying on this technique for analyzing market trends.
Depending solely on the Golden ratio for entry/exit points may lead to missed opportunities as prices can behave differently at times than predicted by these ratios. Therefore, it is always important to remain cautious and diversify investment strategies when engaging with crypto markets.
Conclusion
The Fibonacci sequence serves as an invaluable tool for technical analysis in crypto markets. By plotting support and resistance levels with Arcs and Time Zones, we are able to gain an edge when assessing market volatility.
By combining this technique with other indicators, traders are able to make more accurate decisions on optimal entry/exit points of investments. However, due to its popularity, one must remain mindful of the risks associated with relying solely on the Golden Ratio – always diversifying strategies and staying cautious when analyzing markets.


