Ethereum Price Prediction 2024-2033
- Ethereum Price Prediction 2024 – up to $4,853
- Ethereum Price Prediction 2027 – up to $13,536
- Ethereum Price Prediction 2030 – up to $42,373
- Ethereum Price Prediction 2033 – up to $135,505
“The Merge did not change anything for holders/users.” Is that a fact? Crypto prices are unlikely to see a major recovery without new or returning investors bringing cash back into the market. Unless the retail people enter the market, Ethereum won’t strongly blast above ATH. Maybe something sparks retail, though, like Coinbase, NFT marketplace, etc. There is also much wealth out there in the hands of whales.
How Much Is Ethereum Worth?
Today’s Ethereum price is $3,167, with a 24-hour trading volume of $12,612,053,972. Ethereum is up 1.02% in the last 24 hours. The current CoinMarketCap ranking is 2, with a live market cap of $370,859,856,997. It has a circulating supply of 120,070,408 ETH coins, and the max. Supply is not available.
Ethereum Price Analysis: ETH price sees volatility
- Ethereum displays bearish trends on the 1-day chart, with prices nearing the lower Bollinger Band, suggesting potentially oversold conditions.
- The 4-hour chart shows volatility and a struggle to break through upper resistance levels, with the MACD indicating continued bearish momentum.
- Overall, ETH is at a critical point of consolidation, with indicators on both timeframes suggesting a wait-and-see approach for a confirmed direction.
Ethereum 1-day Price Chart: Ethereum Tests Lower Bollinger Band
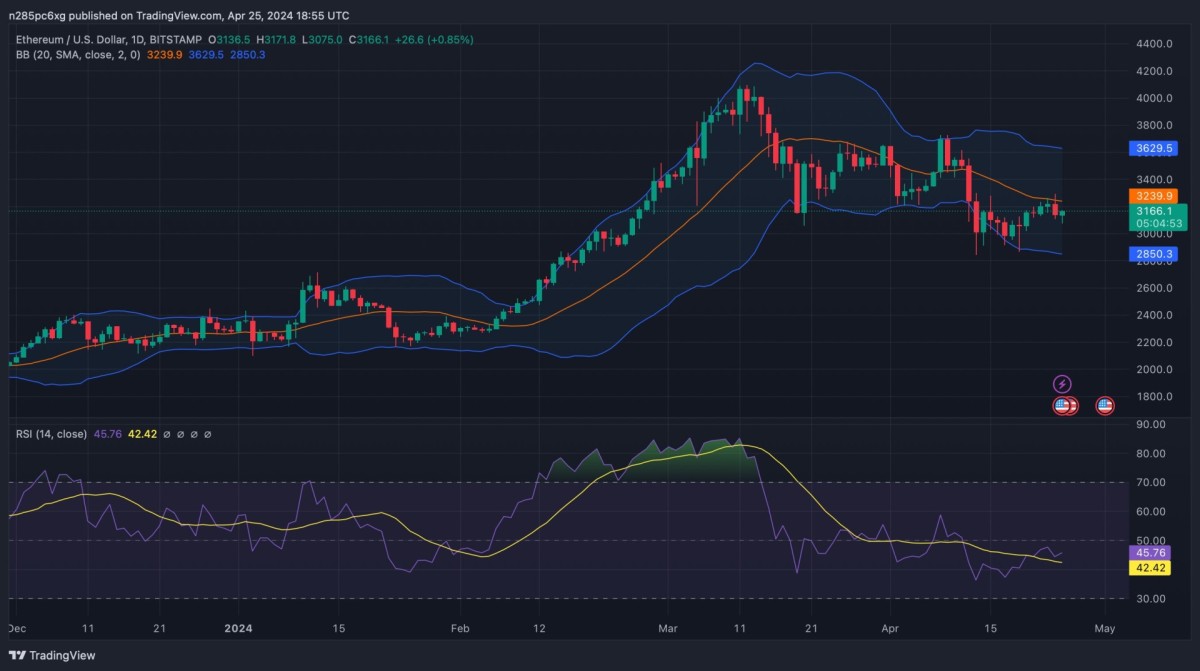
ETH/USD 1-day price chart By TradingView
In the 1-day chart for Ethereum (ETH), price action has experienced a downtrend, highlighted by a sequence of lower highs and lower lows, pressing the price toward the lower boundary of the Bollinger Bands. This movement suggests a bearish sentiment in the market. However, a recent modest uptick is observed, hinting at a potential pause or reversal of the downward trajectory. The price is currently consolidating around the $3,100 level, indicating a pivotal point where the market is deciding its next move. This consolidation phase follows a period of selling pressure, leaving investors watching for signs of either a rebound or a continuation of the downtrend.
Ethereum 4-hour Price Analysis: Ethereum Sees Volatility on the 4-Hour Chart with a Focus on MACD Signals
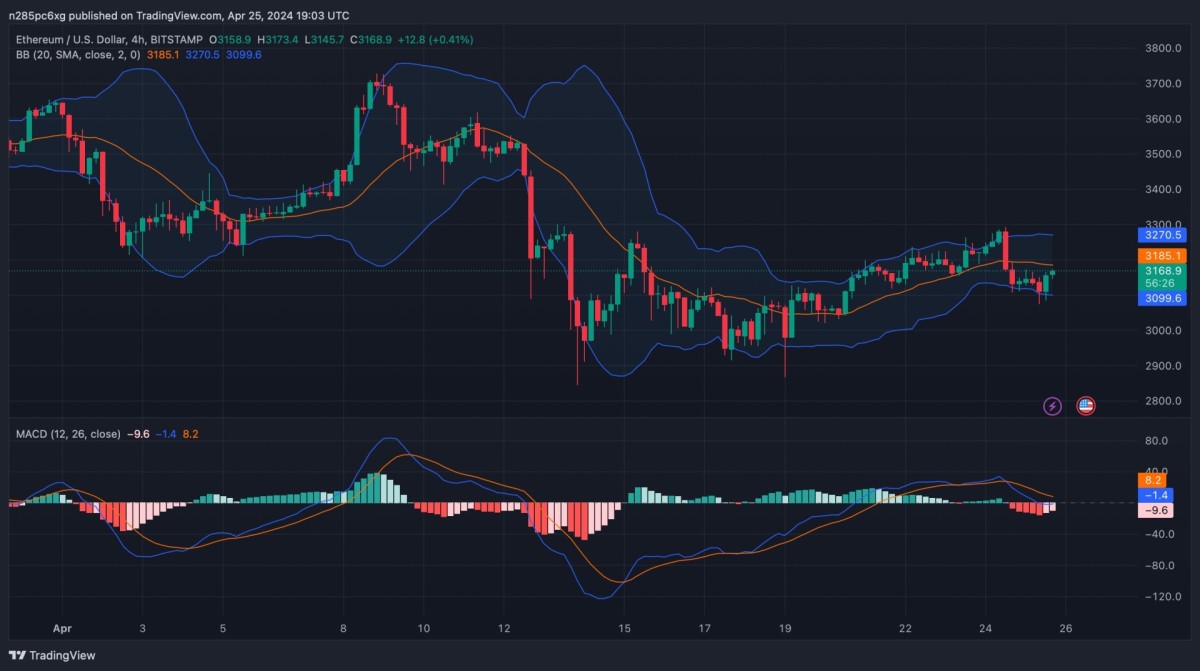
ETH/USD 4-hour price chart By TradingView
On the 4-hour chart, Ethereum (ETH) shows a price consolidating around the middle Bollinger Band with a recent spike that touched the upper band before retreating, indicating volatility and potential resistance. The MACD is below the signal line and negative, which typically signifies bearish momentum. However, the histogram suggests this bearish momentum may be waning as the bars are becoming less negative. The recent price correction could find support near the lower Bollinger Band around $3,100, a level where the market has previously shown buying interest. Investors might look for the MACD to cross above the signal line for bullish confirmation.
Ethereum Price Analysis Conclusion
Ethereum’s price action across both the 1-day and 4-hour charts suggests a phase of consolidation with a recent history of bearish momentum. While the 1-day chart indicates a tentative hold near the lower Bollinger Band, hinting at possible oversold conditions, the 4-hour chart shows volatility and resistance at higher levels, with the MACD reinforcing the need for cautious optimism among traders. Both timeframes suggest a critical juncture; the 1-day chart points to a longer-term bearish trend, and the 4-hour chart signals short-term selling pressure, leaving the market at a crossroads awaiting a clearer directional signal.
Is Ethereum a good investment?
Ethereum is the leading platform for smart contracts and decentralized applications, fostering a robust development ecosystem. The anticipated upgrade to Ethereum 2.0 could significantly improve its scalability and reduce environmental impact through a transition from proof-of-work to proof-of-stake consensus. These developments could increase its attractiveness to investors seeking exposure to innovative blockchain technologies. However, the volatile nature of cryptocurrency markets and the emergence of competing blockchains mean that risk factors remain.
Our price prediction shows if this coin will gain value in the next few years.
Ethereum Recent News/Opinions
In recent weeks, Ethereum (ETH) has proven to be a lucrative asset in the cryptocurrency market, recording a 21% increase in value. This uptrend followed a significant retreat from its earlier surge past the $4,000 mark. Currently, Ethereum maintains a position above the $3,400 support level, with its market indicators hinting at an increasing standoff between buying and selling forces.
The 10-day exponential moving average for Ethereum is positioned at $3,574, hinting that the asset might currently be in an overbought state. Moreover, a relative strength index (RSI) of 50.2 indicates a balanced force between buyers and sellers, suggesting a potential stalemate in the market dynamics.
Ethereum’s Dencun Upgrade Brings Substantial Fee Reductions to Layer 2s
Ethereum’s recent Dencun update has proven to be a boon for users of Layer 2 networks, leading to significantly lower transaction fees across the board. Following the upgrade, Layer 2 solutions that have adopted the innovative use of blobs witnessed a remarkable decline in their average transaction costs.
This development arrives as a result of the upgrade’s introduction of blobs as an alternative transaction type for Layer 2 networks when interacting with the Ethereum blockchain. This method, distinct from the conventional calldata approach, paves the way for direct reductions in transaction fees.
Particularly in the Optimism ecosystem, which spans platforms like OP Mainnet, Base, and Zora, along with others such as zkSync and Starknet, the decrease in transaction fees has been pronounced.
$0.04 for an in-app swap on Argent X 🥹
— Argent – Starknet Wallet (@argentHQ) March 13, 2024
a couple of days ago, it was $6.82.
congratulations @Starknet, low fees are back! pic.twitter.com/K500eNDh42
Starknet, for example, saw a dramatic fee reduction, with Argent, a leading wallet service on the network, reporting that the cost for a swap transaction dropped to $0.04, a stark contrast to the $6.8 observed shortly before the Dencun update.
In contrast, Arbitrum One, the most popular Layer 2 network, has not yet adopted the enhancements from the Dencun upgrade. However, it is anticipated that blob support will be integrated through its upcoming ArbOS upgrade, further expanding the positive impact of Dencun on the Ethereum ecosystem.
Ethereum Price Predictions 2024-2033
Ethereum Price Forecast by Cryptopolitan
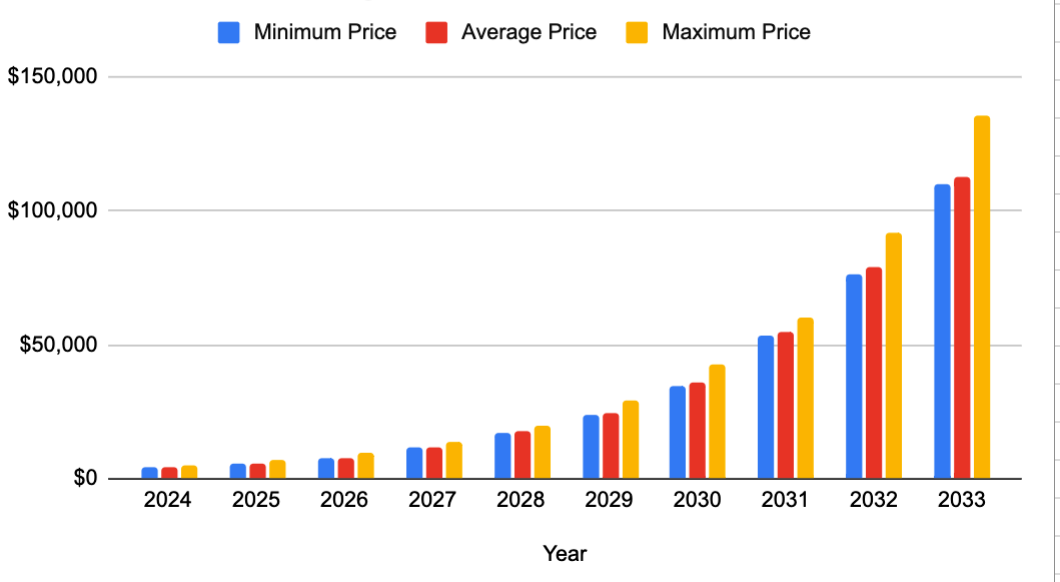
| Year | Minimum Price | Average Price | Maximum Price |
| 2024 | $4,055 | $4,186 | $4,853 |
| 2025 | $5,626 | $5,793 | $7,047 |
| 2026 | $7,786 | $8,018 | $9,739 |
| 2027 | $11,675 | $11,995 | $13,526 |
| 2028 | $17,168 | $17,768 | $20,091 |
| 2029 | $24,124 | $24,834 | $29,303 |
| 2030 | $34,497 | $35,738 | $42,373 |
| 2031 | $53,085 | $54,515 | $60,160 |
| 2032 | $76,478 | $79,204 | $91,892 |
| 2033 | $109,716 | $112,884 | $135,505 |
Ethereum Price Prediction 2024
By 2024, the Ethereum market is expected to witness significant growth. As our Ethereum price prediction indicates, the minimum price traded is projected to be $4,055, a notable increase from last year. The average price of Ethereum is expected to settle at $4,186. Given the ongoing Ethereum ecosystem advancements in combination with the favorable market dynamics, the maximum price of Ethereum may reach $4,853 by the end of the year.
Ethereum Price Prediction 2025
By 2025, Ethereum’s trajectory is expected to keep moving upward. A minimum price of about $5,626 is anticipated, which means confidence is still low and the market expands. An average trading price may be somewhere in the region of $5,793. By the end of the year, with the development of the blockchain technologies and the rise of adoption, the maximum price of Ethereum could hit around $7,047.
Ethereum Price Prediction 2026
The 2026 outlook is promising for Ethereum. The minimum price is expected to grow up to $7,786 due to technological advancements and larger market adoption. The weighted average of $8,018 indicates consolidation. In the year, Ethereum would most likely hit a maximum price of $9,739, which will be due to favorable market trends and tech advancements.
Ethereum Price Prediction 2027
The year 2027 is expected to be the year of Ethereum. The minimum trade value is targeted at $11,675, which signals a strong bullish market sentiment. Ethereum could be priced at an average of $11,995. Assuming continued progress and adoption, the maximum value of Ethereum within the year could even reach $13,526.
Ethereum Price Prediction 2028
2028 will be a bullish year for Ethereum. The lowest price would be an estimated $17,168 while the average trading value is expected to be $17,768. Ethereum maximum price in 2028 is expected to reach an impressive $20,091, possibly fueled by further development of Ethereum’s platform and the overall crypto market dynamics.
Ethereum Price Prediction 2029
The year 2029 projects Ethereum’s continued rise. The smallest amount that the price is expected to be is $24,124. The mean value will settle around $24,834 more or less. A hypothetical maximum value of $29,303 can be attained, signaling rising investor confidence and technological development in the blockchain industry.
Ethereum Price Prediction 2030
For 2030, the forecast assumes an upward positive dynamic for Ethereum. The lowest value is to be about $34,497. The expected trading price is around $35,738. The top price could potentially surge up to $42,373 driven by major events in the Ethereum ecosystem and broader crypto market patterns.
Ethereum Price Prediction 2031
The next frontier for Ethereum is predicted to be in 2031. The lowest price is estimated to be $53.085, and the average price is anticipated to be about $54.515. The highest value of Ethereum could hit $60,160 maybe because of some groundbreaking development and the growing usage of blockchain technology on a global scale.
Ethereum Price Prediction 2032
In 2032, Ethereum is anticipated to remain on a healthy growth path. The minimum price is estimated to be $76,478, and the average price is expected to* $79,204. The cap price can hit the striking amount of $91892, which indicates the ongoing success and innovation in the ETH network.
Ethereum Price Prediction 2033
Ethereum’s growth will remain strong in 2033. The minimum price is forecast to be an astonishing $109,716. In reality, the mean Ethereum price should be about $112,884 and the maximum price could increase to an astounding $135,505, revealing the possibility of Ethereum platform to further grow and develop.
Ethereum Price Prediction by Wallet Investor
Wallet Investor predicts that Ethereum is not soo good long-term investment. According to them, Ethereum will be worth $3338.381 in one year. They predict the coin will devalue by 26.235% in five years.
Ethereum Price Prediction by CryptoPredictions
According to CryptoPredictions, Ethereum will have a maximum trading price of $3,763 by the end of 2024. However, the coin’s lowest trading price is expected to be $2,558, while its average trading price is expected to be $3,010 by then.
The ETH coin is predicted to have a maximum price of $3,420 by 2026, a minimum of $2,326, and an average of $2,736.
CryptoPredictions also predicts that Ethereum will have a maximum price of $4,459 by 2028. The coin’s average trading price is expected to be $3,567, with a minimum price of $2,726.
Ethereum Price Prediction by Digital Coin Price
Digital Coin Price is bullish on Ethereum. Their forecast predicts the coin will be worth a maximum of $7,228 by the end of 2024. The coin’s average trading price by then is expected to be $6,950, while its minimum price is expected to be $2,984.
By 2027, ETH is expected to have a maximum price of $15,108 and a minimum price of $12,790. The coin’s average trading price is expected to be $15,034.
Furthermore, Digital Coin Price predicts that Ethereum will have a maximum price of $24,606 and a minimum price of $22,429 by 2030. The coin’s average trading price by then is expected to be $23,389.
According to Digital Coin Price, Ethereum is expected to have a maximum price of $64,644 by 2033. By then, they predict that the coin will have a minimum price of $62,365, with an average trading price of $63,787.
Ethereum Price Prediction by CoinCodex
CoinCodex predicts that Ethereum is a good long-term investment. They predict the coin will be worth $5,2681 in one year.
Based on the historical price movements of Ethereum, the yearly high of Ethereum price prediction for 2030 is estimated at $12,223. Meanwhile, the price of Ethereum is predicted to reach an annual low of $6,684 by 2030.
Ethereum price prediction by industry experts
Popular crypto influencer Ben Armstrong is bullish on the price of Ethereum in 2024. He predicts that if Spot ETFs get approved mid-cycle in 2024, he expects ETH to reach an all-time high of $33,000.
Ethereum price prediction by industry experts
Popular crypto influencer Ben Armstrong is bullish on the price of Ethereum in 2024. He predicts that if Spot ETFs get approved mid-cycle in 2024, he expects ETH to reach an all-time high of $33,000.
Currency Overview
| Cryptocurency: Ethereum | Ticker Symbol: ETH |
| Price: $3,326 | Cryptocurrency: Ethereum |
| Circulating Supply: 120,068,226 ETH | Trading Volume: $3,46B |
| All-time high: $4,891.70 | All-time low: $0.4209 |
Ethereum Price History
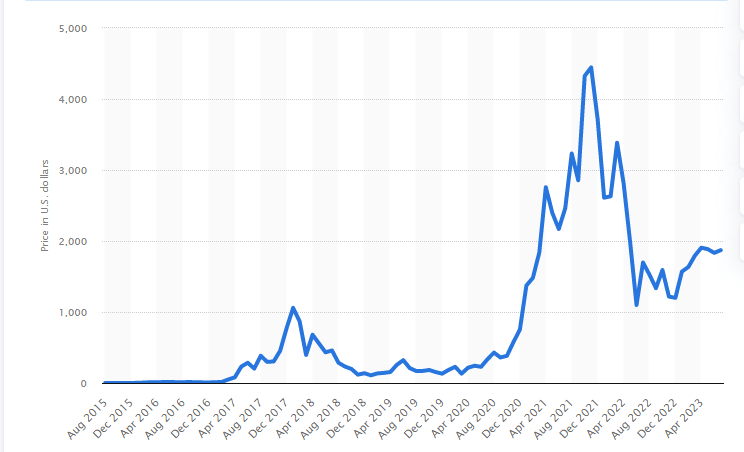
Ethereum’s price history suggests that crypto was worth significantly less in 2022 than in late 2021, although nowhere near the lowest price recorded. Much like Bitcoin (BTC), the price of ETH went up in 2021 but for different reasons altogether: Ethereum, for instance, hit the news when a digital art piece was sold as the world’s most expensive NFT for over 38,000 ETH – or 69.3 million U.S. dollars. Unlike Bitcoin – of which the price growth was fueled by the IPO of the U.S.’ biggest crypto trader Coinbase – the rally on Ethereum came from technological developments
More on the Ethereum Network
Ethereum Milestones
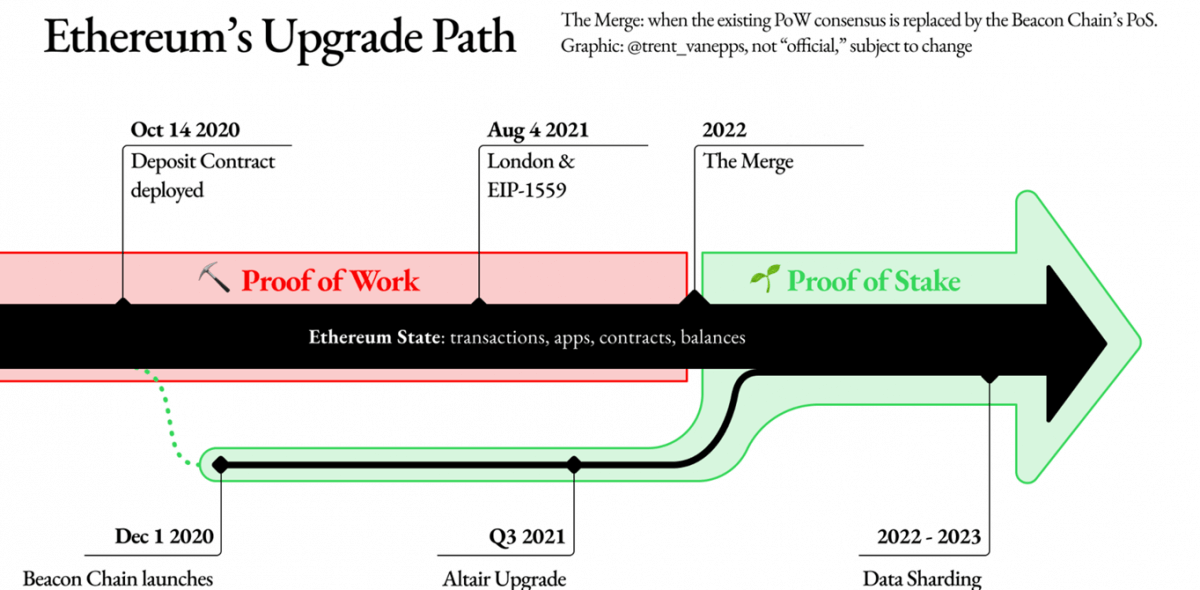
Burning Ethereum is September’s event and frazzled many nerves who do not understand the burning process. The Ethereum network experienced a significant upgrade on August 5, 2021, which led to massive Ethereum burning.
It is called the London Hard Fork, and the latest upgrade was about five Ethereum Improvement Proposals (EIPs). These include EIP 1559, which aims to boost cryptocurrency mining and increase the speed of Ethereum-based network users.
Ethereum Merge
The Merge refers to the joining of the original execution layer of Ethereum with its new proof-of-stake consensus layer, the Beacon Chain. The Merge eliminated the need for energy-intensive mining and enabled the network to be secured using staked Ethereum. It is an exciting step in realizing the Ethereum vision—more scalability, security, and sustainability.
Initially, the Beacon Chain shipped separately from Mainnet. Ethereum Mainnet – with all its accounts, balances, Smart contracts, and blockchain state – continued to be secured by proof-of-work (POW), even while the Beacon Chain ran in parallel using proof-of-stake (POS). The Merge was when these two protocols finally came together, and POS permanently replaced POW.
Ethereum is a spaceship that launched before it was ready for an interstellar voyage. The community built a new engine and a hardened hull with the Beacon Chain. The upgrade merged the new, more efficient engine into the existing ship.
Merging with Mainnet
On 15 September 2022, the Beacon chain successfully merged with the Ethereum mainnet completing Ethereum’s transition to proof-of-stake consensus, officially putting ETH miners out of work and reducing energy consumption by ~99.95%.
POW secured Ethereum Mainnet from Genesis until The Merge. POW allowed the Ethereum blockchain we’re all used to come into existence in July 2015 with all its familiar features—transactions, smart contracts, accounts, NFTs, ERC protocols, etc.
Throughout Ethereum’s history, developers prepared for an eventual transition away from POW to POS. On 1 December 2020, the Beacon Chain was created as a separate blockchain to Mainnet, running in parallel.
The Beacon Chain was not initially processing Mainnet transactions. It reached a consensus on its state by agreeing on active validators and account balances. After extensive testing with validators, it became time for the Beacon Chain to reach a consensus on real-world data leading to Merge. The Beacon Chain became the consensus engine for all network data, including execution layer transactions and account balances.
Proof-of-stake validators adopted the role of miners and are now responsible for processing the validity of all transactions and proposing blocks.
No transaction history was lost in The Merge. The Merge also included the entire transactional history of Ethereum.
Eth and its ERC derivative users do not need to do anything with your funds or wallet to account for The Merge. ETH is ETH. There is no such thing as “old ETH”/”new ETH” or “ETH1″/”ETH2.0,” and wallets work the same after the upgrade.
The Merge and Sharding
Initially, the plan was to work on sharding before The Merge to address Eth scalability issues. However, with the boom of robust layer 2 scaling solutions, the priority shifted to swapping POW to POS first.
Sharding is the next major upgrade planned on the Ethereum mainnet. Considering the rise and success of layer 2 technologies to scale, sharding plans have shifted to finding the most optimal way to distribute the burden of storing compressed call data to allow exponential growth in network capacity.
Sharding would be impossible without the first transition to POS.
What’s Ethereum Triple Halving?
The miners producing blocks on Ethereum are receiving approximately 14,000 new ETH per day. The chain’s inflation rate is somewhere around 4.5% annually and has no fixed supply, unlike Bitcoin.
The POW chain was shut off forever and replaced with a more efficient POS chain. Instead of miners, validators (stakers) will receive ~1,400 new ETH per day. The chain’s inflation rate was projected to drop to 0.5% annually, just 10% as much as today!
That’s cool, what about gas fees? Two things.
One is an upgrade from last August, EIP1559. All base fees are burned. Since then about 3% of the annual supply of ETH has been burned. With EIP1559 and the POS merge the total issuance will be around -2.5% per year. Ethereum will become deflationary.
And two… Contrary to popular belief POS will not reduce gas fees. It’s only meant to reduce the amount of new ETH being created. Gas fees will likely rise to uncomfortable levels and maintain until sharding potentially ~6 years out.
Welcome to Rollup-Centric Ethereum
Rollups reduce gas fees by 100-1000x essentially by rolling 100-1000 transactions into one single transaction. Some with the ability to use a mix of on and off-chain data computation.
The more congested the network is, the cheaper it becomes since there are more people to split the one gas fee with, opposite of what we have today.
But the greater concern is whether the current Ethereum Price Prediction algorithms will hold with the new structure. How will the projected Merge affect $ETH prices? Some of the ETH/USD price surges have been attributed to the general market trend reversal spurred by the slowing pace of inflation, but a great deal of outperformance is related to the Merge.
Ethereum Virtual Machine
The EIP 1559 upgrade considered the criticism faced by Ethereum for the rising transaction costs and network congestion by introducing the latest Ethereum burning method that simplified the process. Since the EIP 1559 upgrade, more than 300,000 Ethereum coins worth over $1 billion have been burned or taken out of circulation.
While speculators forecast that Bitcoin will be a store of value, supply and demand indicators reveal that Ethereum will likely morph into a world computer with the help of the Ethereum Virtual Machine.
Ethereum price predictions are essential for every investor looking to try his luck in the crypto industry. After the recent introduction of the network upgrade, Ethereum experienced a resurgence in demand and price action due to its value which could be expanded with NFT and DeFi spaces alongside its status as the ‘first-mover’ in the world of blockchain.
The most recent news item around Ethereum and EIP 1559 is a research paper published by students at Peking University, which Ethereum founder Vitalik Buterin applauded.
Excellent paper by some researchers at Peking University and Duke University on the consequences of EIP 1559. Particularly appreciate the confirmation that EIP 1559 has greatly decreased average waiting times for transactions.https://t.co/2rvzx93Yar pic.twitter.com/nPtnAJNle9
— vitalik.eth (@VitalikButerin) January 17, 2022
Also, it was revealed recently that the after-effects of the London upgrade have already kicked in as the network 36 percent of newly issued Ethereum in just about two days.
Liquidity Depth of Ethereum
The liquidity depth of Ethereum and what developers have in mind to resolve scalability make Ethereum a topic of discussion across social media platforms.
There are Ethereum speculators angling to clip volatility and profit, but there are actual Ethereum holders and believers amid them.
Following the “DeFi Summer 2020″, it became painfully obvious that Ethereum could not scale, making it expedient to migrate from PoW to PoS consensus mechanism. Instead of miners, PoS relies on ETH stakers to validate transactions. That’s cleaner, faster, more scalable, and cheaper.
ETH’s Fundamental Analysis
Decentralized Applications (DApps) and Smart Contracts may be built on Ethereum’s open-ended, blockchain-based, public software platform. The usage of smart contracts eliminates the need for a third-party middleman. In a nutshell, smart contracts have well-specified terms and procedures in place to enforce them.
In contrast to conventional contracts, smart contracts are written in code that a computer can execute, eliminating the possibility of ambiguity. The smart contract code is performed on the Ethereum network, a single decentralized computer. As a result, all participating computers will agree on the outcomes of all smart contracts on the Ethereum network.
It is common for traditional software to depend on a central authority for data storage and processing. This necessitates faith in centralized power. Using smart contracts on the Ethereum network, decentralized applications (DApps) may be created. Data may be stored in smart contracts. The Ethereum network ensures that the smart contract code carries out all data activities. In other words, the data is safe and secure without the need for a single trusted source of information.
Ethereum Mining
Developers require Ethereum to build and execute apps on the Ethereum network. Payments for transaction fees and computational services may be made using Ethereum, a cryptocurrency.
Users may transmit Ethereum to other users using smart contracts, and developers can design arrangements that receive, keep, and transfer Ethereum. The Ethereum network uses mining to create Ethereum by validating transactional data. “Miners” are the people who do this validation.
Ethereum is given to miners that successfully validate a series of transactions. Miners adhere to a set of cryptographic principles that ensure the whole network’s stability, security, and safety. A digital public ledger known as blockchain records and verifies Ethereum transactions.
How do you get Ethereum?
Ethereum may be obtained in a variety of methods:
- ETH may be acquired on an exchange by using fiat cash.
- Exchanges that provide a BTC-ETH pair may trade ETH for Bitcoin.
- In certain cases, you may get it as a gift from someone else.
- There are two ways to get it: As a miner, either by joining a mining pool or acquiring a cloud mining contract
You may buy the cryptocurrency on Binance, OKEx, Mandala Exchange, CoinTiger, and Huobi Global are presently the leading cryptocurrency exchanges for trading Ethereum.
Ethereum Network History (2015-2022)
2014 – 2016
By August 2014, Ethereum had raised $18.4 million via an initial coin offering. They completed their test net, Olympic, in May 2015 and went live two months later in July 2015 with Frontier. But the first actual “stable” Ethereum was Homestead which was activated roughly a year later, in March 2016.
Because of developers’ forecasts and a prediction of a future shaped by the pure utility, a noteworthy development in Ethereum’s history is the DAO hack of June 2016. 15% of the network’s flexible total supply was siphoned on that day because of an Ethereum vulnerability exploit. This theft depressed ETH’s price but soon after, the price recovered, performing spectacularly over the years.
Because of a difference in ideology-and whether the best course of action was to recover stolen coins through a change in consensus, or hard fork, formed Ethereum Classic.
2017 – 2019
Code-improvement-wise, there has been a significant milestone. The first was Homestead, but it wasn’t until 2017 that Byzantium was activated.
Later Constantinople and Saint Petersburg saw the hardening of Ethereum miner rewards, the introduction of code that reduces the cost of smart contracting, and other features.
At the same time, the Ethereum network transits to Ethereum 2.0, whose game end, Serenity, could cement Ethereum as a leader in smart contracting and dApp deployment.
Most of these features were implemented a year later, in 2018, with blockchain technology.
Underpinning Ethereum is a decentralized open-source node system built or derived on some bits of Bitcoin’s source code.
The critical distinction is introducing a Turing complete virtual machine and smart contracts that enable code execution once certain on-chain conditions are met between the two transacting parties.
Because of smart contracts, the development world hasn’t been the same. An Ethereum smart contract is nothing more than a piece of self-executing code that, once executed, is irreversible, open, and immutable.
Like Bitcoin, Ethereum runs on its blockchain and has its native currency, Ethereum (ETH), and Solidity’s programming language. While Ethereum tokens comply with different standards, ERC-20, ERC-1155, or ERC-721-Non-Fungible Tokens (NFT), all fees are paid in Ethereum (ETH).
2019 – 2021
Ethereum ushered in new financing models in initial coin offerings, ICOs, immutable dApps, and most recently, decentralized finance (DeFi).
DeFi democratizes finance, is open, and owners of Ethereum can borrow in exchange for a stable coin or earn interest when they lend out their stash.
Even though Ethereum is a success and Ether-a digital currency valuable, it faces a scalability challenge because of too much use. The Proof-of-Work (POW) consensus model, Vitalik Buterin claims, is energy-intensive.
Combined with other factors, it could be hard to make Ethereum forecasts. There are several Ethereum proposals forwarded to resolve this.
EIP-1559 London hard fork has been deployed on the testnet, and now, there is a release of Ethereum 2.0, which will change the network forever.
The consensus is that the Ethereum network will shift from a Proof-of-Work to a Proof-of-Stake consensus model, which supporters say is energy-efficient secure.
2021-2023
In 2021-2023, Ethereum witnessed notable developments, primarily the transition to Ethereum 2.0, involving significant shifts like the move from proof-of-work to proof-of-stake (PoS), drastically reducing energy usage and enhancing transaction throughput.
This transition, known as “The Merge,” was a critical milestone in Ethereum’s roadmap, targeting greater scalability, security, and sustainability. Ethereum also saw growth in decentralized finance (DeFi) and non-fungible tokens (NFTs), with continuous improvements in smart contract functionalities and Layer 2 scaling solutions like Optimism and Arbitrum. These advancements reinforced Ethereum’s ecosystem, improving efficiency and user experience.
Additional revenue streams from staking
One Ethereum reached its maximum price in April-May; everything changed. It became the center of attraction for many DeFi projects, but the exorbitant transaction fee.
People had to pay an average price of $120 for completing their transactions, while Ethereum’s projected growth was estimated to blow off the charts. The rates got so high that projects started switching over to the TRON chain.
But after the London hard fork was implemented successfully on the Ropsten testnet. The EIP-1559 was a much-awaited improvement in the network. The advancement towards ETH 2.0 caused higher fees in April-May but went down as the traffic from TRON shifted back to Ethereum.
Conclusion
Experts have thoroughly examined Ethereum’s performance since its inception. Based on its solid fundamentals and potential, we also believe that Ethereum will remain relevant. The constant upgrades and growth of Ethereum suggest that 2024 and beyond will be promising for this technology. As more people gain confidence in blockchain solutions, Ethereum is poised to soar to new heights. Investors who hold onto ETH for the long term will likely see positive returns. However it is essential to do your own research before investing in cryptocurrencies.
Read more on our resources to make an informed decision. Or if you have ETH, maybe our resources on wallets will be helpful.


