Ether price rose by almost one percent to touch a high of $407.00 after a brief rally from yesterday’s lows. However, the price has been in a consolidation phase for the past few hours and hovering just around the $400 level.

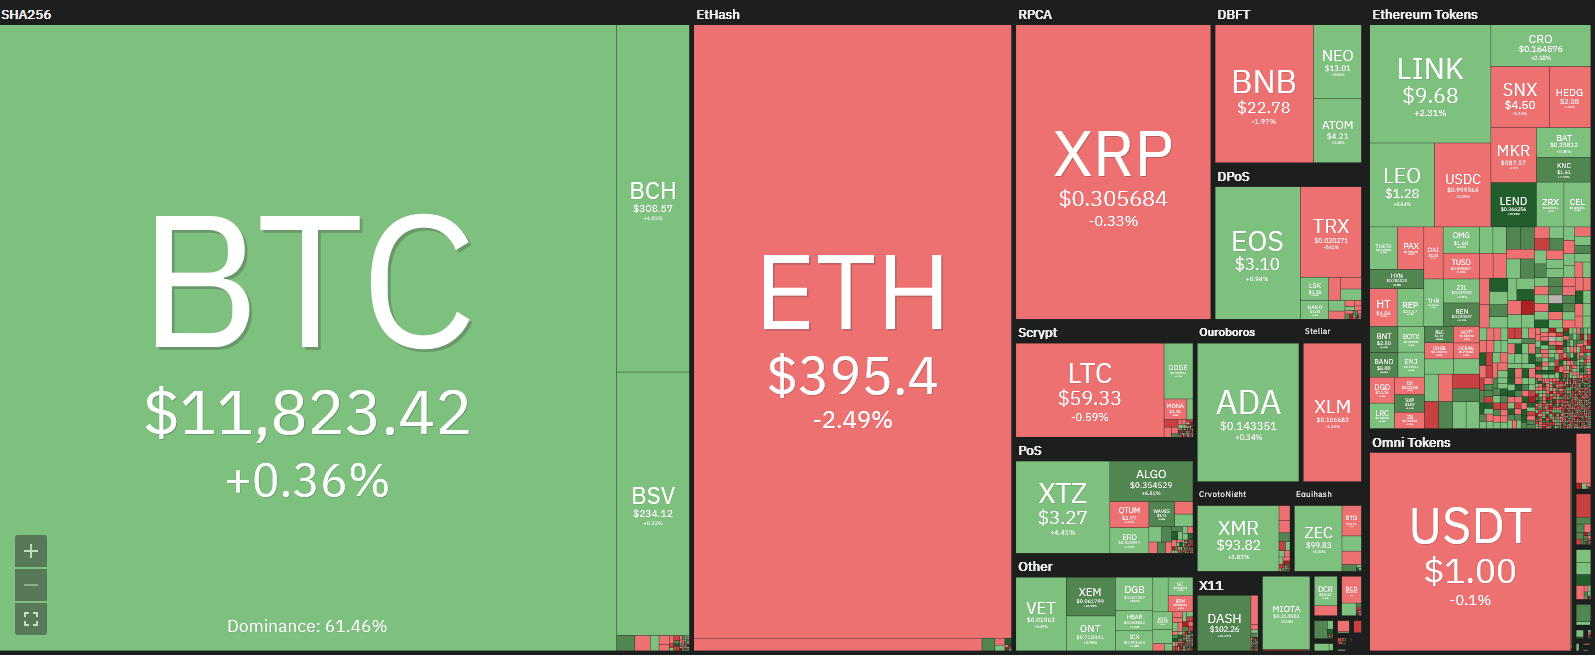
Ether price heatmap chart by Coin360
The reverse in the Ether price is a direct result of profit booking at higher levels. Most altcoins are hovering at their yearly highs, and every pair is experiencing profit booking to some extent. Bulls want to lock in some profit and wait for the dust to settle before they can begin the next rally upwards.
What’s interesting in Ether price action is that it briefly broke the $401.00 resistance. It goes on to show that bulls still have some stamina left before any considerable setback can happen. Technical indicators are displaying a neutral stance with a positive bias.
Ether price set to break out of the sideways movement
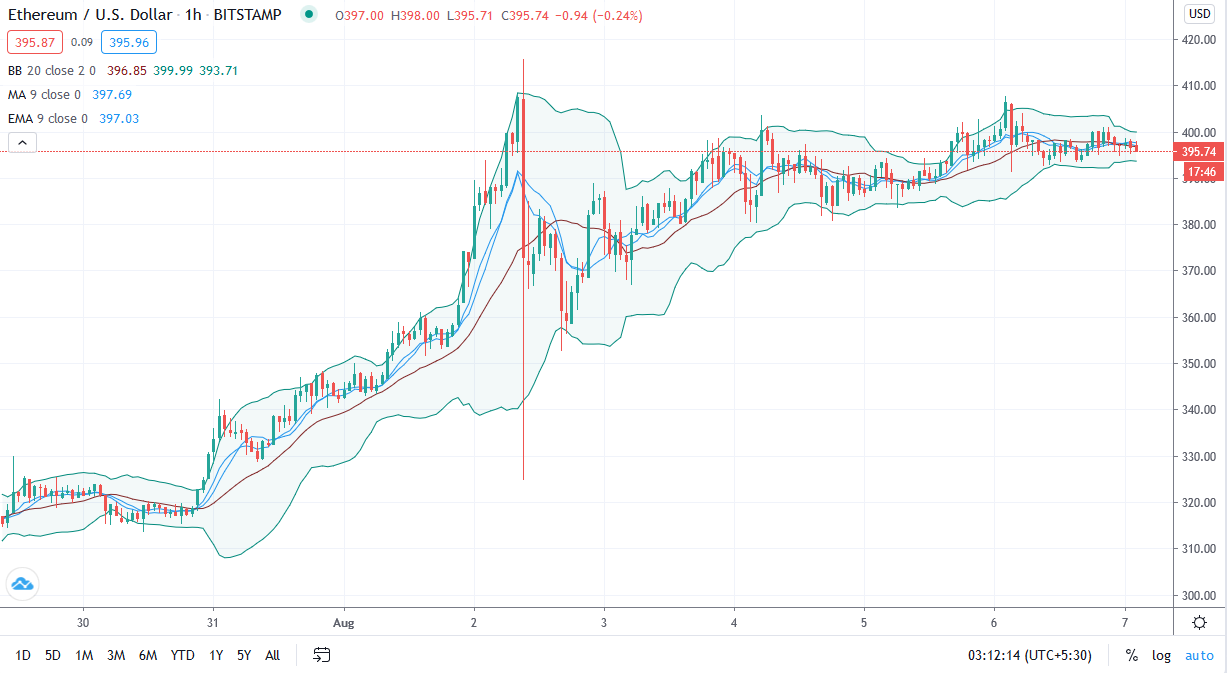
Ether price remains firmly above the crucial support at $368.00. The pair have regularly bounced back from this support as bulls used every dip as an opportunity to buy more. However, both the support and resistance levels are not tested in a confident manner to clear the picture as to where the price intends to move forward.

Ether price chart by TradingView
Once the current consolidation phase ends, Ether price must breach the $400 mark to clear the hurdles for a bullish move upward. Such a move would warrant support from the broader crypto market as a whole. Barring any negative news, the technical indicators point that a strong move upwards can start in the next few hours.
However, a fall from the current price levels would bring into play the vital support at $379.00. any extended sell-off will be kept in check by the $368.00 support, which is the 38.2% Fibonacci support level.
Technicals are indicating a bullish move soon
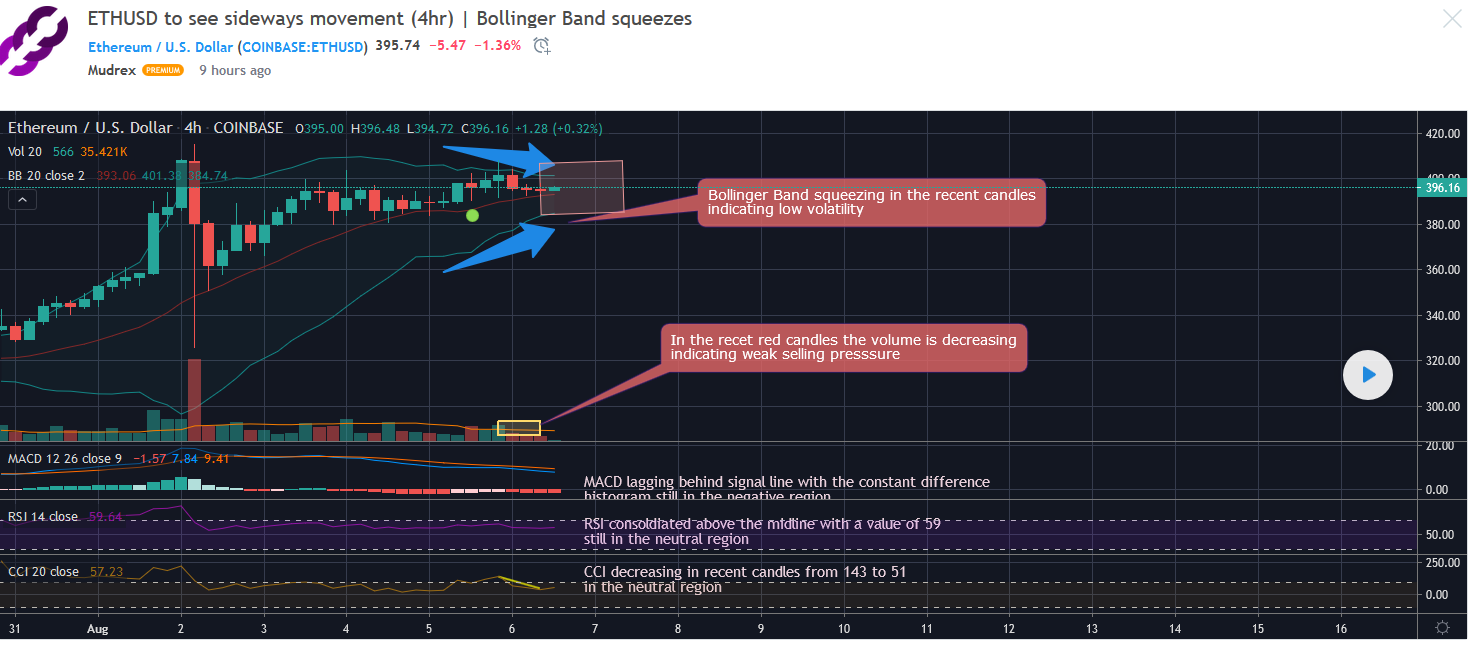
Price volatility is increasing, and so is the volume. The rejection of $408 resistance means that bulls are playing a waiting game and consolidating at lower levels. The Bollinger Bands are showing a squeeze with an increase in volume – meaning either bull or bear move can start in the next few hours.

Ether price chart by TradingView
As trader Mudrex points out that the Bollinger bands are squeezing on the hourly charts and will give way soon. The sideways movement will also pose a threat to the support level downwards since it reflects the indecisive participants. Other major technical indicators, including RSI and Oscillator, are showing a neutral stance. Ichimoku Cloud is also turning neutral with an upward bias on the hourly charts.
Disclaimer: The information provided is not trading advice but an informative analysis of the price movement. Cryptopolitan.com holds no liability towards any investments based on the information provided on this page.


