


- Blockstream CEO Adam Back says Bitcoin’s 200-week moving average signals a long-term bullish outlook, with the $43,000 level no longer a realistic consideration.
- Bitcoin briefly dipped below $90,000 but surged back to $94,000 on Monday.
- Analysts suggest BTC is in a “sell area,” but key resistance levels like $96,000 and the Fibonacci Level at 0.786 could signal a bullish breakout.
According to Blockstream CEO Adam Back, Bitcoin’s (BTC) price may never dip below $43,000 again. Speaking on the market’s recent movements, Back pointed to Bitcoin’s 200-week moving average (WMA) now residing above the $43K price level. Historically, the 200 WMA has been regarded as a strong support level, with the cryptocurrency rarely falling beneath it, even in the most extreme bear situations.
Bitcoin had a rough start to the week, falling below $90,000 briefly on Monday, its lowest point since late November 2024. However, the support breakdown proved short-lived.
By the close of the day, BTC had surged back to $94,000, leaving behind a “long-legged Doji candle” on the chart. This candle formation signals a break in the downtrend price movement. While sellers initially pushed prices lower, buyers eventually regained control, creating a potential signal of a bottom.
Long-term trend points toward bullish sentiment
Despite the volatility of the past few days, the 200 WMA identified by Adam Back signals a long-term bullish outlook. Bitcoin’s price has remained above this level in recent years, marking key support levels that typically correspond to “generational bottoms.”
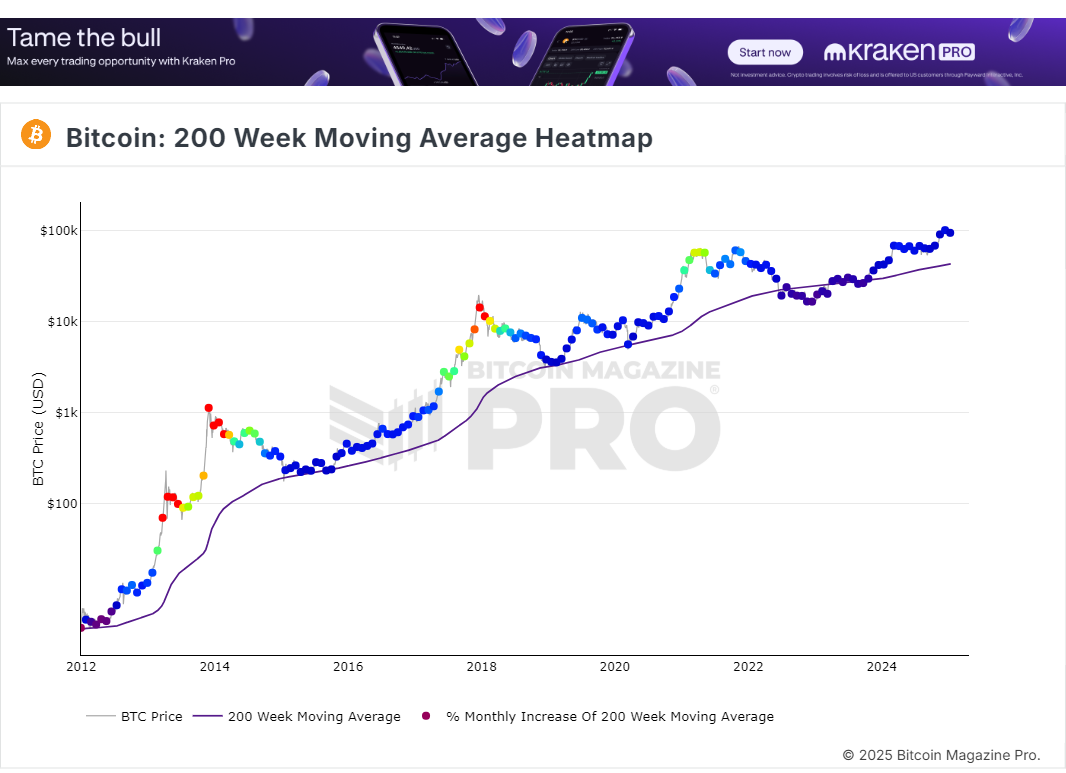
There have been very few instances of a BTC sell-off dipping its price below the 200 WMA. An example is on March 12, 2020, when the crypto shed more than 39% of its value, mimicking the US equities market downtrend that was affected by the novel COVID-19 virus.
When Bitcoin trades consistently above this moving average, it often suggests an upward trend, while a dip below points to bearish conditions.
In a reply to Blockstream’s Adam X post, Coindesk analyst James Van Straten added that the realized price, or the average cost of all Bitcoin coins, is just below the 200 WMA.
Realized price (average cost basis of all coins – $41.4k) is just below the 200WMA.
— James Van Straten (@btcjvs) January 13, 2025
Similar to 2017 and 2021 once this gets firmly above the 200WMA, bull market begins. pic.twitter.com/usiqkU1Gfu
He believes that if the realized price levels peak at the moving average indicator, a new bull market will begin, as seen in 2017 and 2021.
Bitcoin’s steady decline signals market correction continuation
Over the past month, Bitcoin has faced a steady decline, forming a descending parallel channel after hitting an all-time high of $108,364 on December 17, 2024. Descending channels are typically associated with corrective movements, and analysts generally expect a breakout once the pattern concludes.
At the start of last week, Bitcoin’s price formed a lower high, reinforcing the resistance trend line of the channel. The same day, the cryptocurrency created a bearish engulfing candlestick, confirming the start of a short-term downward trend.
Due to #Bitcoin‘s lack of a weekly bearish engulfing candle-close last week, I wouldn’t be surprised if $BTC ends up blasting up through 96-98k resistance at the 4H 200MA, and targets at least 104k, despite that 89k liquidity grab yesterday. Just a hunch based on past traps..NFA pic.twitter.com/mcFfEjeopB
— Cyberspace2140📉📈 (@cyberspace2140) January 14, 2025
The initial sell-off occurred as investors adjusted expectations for Federal Reserve rate cuts. Following a better-than-expected jobs report on Friday, discussions around potential rate hikes weighed heavily on market sentiment, causing prices to fall.
As Bitcoin dropped below the key support zone of $90,000 to $93,000, it briefly tested lower levels, even as major US stock indices dipped lower.
The downtrend continued on January 13, bringing Bitcoin to a low of $89,614, marking its lowest price since November 17, 2024. However, the cryptocurrency regained some ground later that day, closing slightly higher with a long lower wick candle, indicating potential bullish momentum.
Traders eyeing key levels
The current BTC market sentiment remains cautiously optimistic despite the crypto’s price corrections since the start of the year. Analysts on social media noted that Bitcoin is currently trading in a “sell area,” suggesting that traders should wait for a breakout before taking long positions.
They have also pointed out that BTC is trading around the 0.786 Fibonacci Level, which is a crucial resistance point for a potential move on the upside.
Others suggest that Bitcoin has successfully broken through the $96,000 resistance level. The relative strength index (RSI) is rising rapidly, which could indicate increasing upward momentum if Bitcoin maintains its position above this threshold.
At press time, BTC is changing hands at $96,600, experiencing a 5% uptick in the last 24 hours even though it has dropped 4.7% from levels reached seven days ago.
Don’t just read crypto news. Understand it. Subscribe to our newsletter. It's free.
Disclaimer. The information provided is not trading advice. Cryptopolitan.com holds no liability for any investments made based on the information provided on this page. We strongly recommend independent research and/or consultation with a qualified professional before making any investment decisions.

Florence Muchai
Florence has been covering for the past 6 years crypto, gaming, tech, and AI news. Her Computer Studies at Meru University of Science and Technology and Disaster Management and International Diplomacy at MMUST amply equip her with language, observation and technical skills. Florence has worked at VAP Group and as an editor for several crypto media houses.


