


Best crypto insights delivered straight to your inbox.
Bitcoin BTC price may find a new high above $9000 in 2019


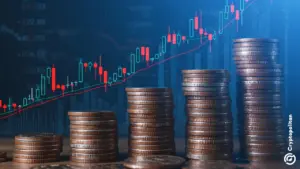
btc price analysis 2june
The price of Bitcoin had slightly declined and lost eleven hundred dollars ($1100). It has achieved eight thousand dollars ($8,000) and this level served as strong support for Bitcoin.
The price has surged now to eighty-five hundred dollars ($8500) and it shows the resilience of coin to maintain its position.

Since May 8 the coin did not show any stability and was constantly fluctuating. The technical indicator RSI shows negative divergence for BTC.
The current support level is found to be 67-68. The oscillator is indicating bullish patterns and surging tendencies for BTC.
The likeable area for support is above 73 levels. Following results were revealed: Bitcoin Market cap value to be around one hundred and fifty -two billion dollars ($152.8bn) and Bitcoin dominance above fifty-five percent (55.9%).

The analysis of 1-day and 4-hour chart revealed the crossing of support of $8500 level and the anticipated next resistance can be around nine thousand dollars ($9,000).
The higher zone lies around ninety-three hundred dollars ($9300) and the lower zone is around eighty-five hundred dollars ($8500).
Further below zones can reach to seventy-six hundred dollars ($7600) and even to seven thousand dollars ($7,000)
The BitFinex shows the short position at 20.7KBTC and the Trading volume is below the average level of volume. The surge in the price after the bearish trends of the past week was followed by lower volume that means the low number of buyers.
The smartest crypto minds already read our newsletter. Want in? Join them.
Aroosa Nadeem
A media graduate and passionate media person Aroosa has a knack for digital media journalism and outreach. She has contributed content to different digital media publishers in a variety of areas including technology, health and finance.


CRASH COURSE
- Which cryptocurrencies can make you money
- How to boost your security with a wallet (and which ones are actually worth using)
- Little-known investment strategies that the pros use
- How to get started investing in crypto (which exchanges to use, the best crypto to buy etc)