
Polkadot price analysis trades in a bullish trend today. The Bearish trend started the day at $5.22 and has since seen a rise in the price of DOT. It peaked at around $5.30, where it is now acting as a resistance. At the time of writing, DOT is trading at $5.27, representing an increase of 0.82% over the past 24 hours.
Polkadot price analysis 1-day chart: Bulls rally above the $5.20 level
The 24-hour chart for Polkadot price analysis shows the price of DOT is rising. In the past few hours, as the price of Polkadot has risen from $5.20 to the current $5.27 level, bulls have managed to break past the resistance at $5.20 and are now looking to push toward the next resistance level of $5.30. However, if bears manage to take control of the market, the price could fall back and test the $5.18 support level.
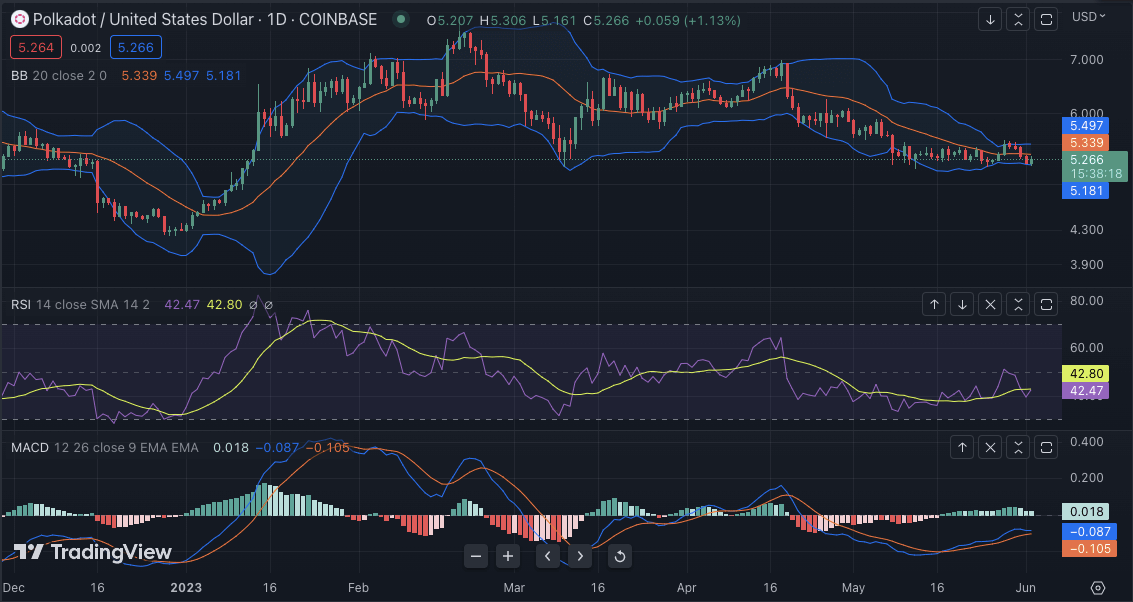
The MACD shows that market sentiment is currently bullish as it has crossed from negative territory into positive territory. The RSI indicator is also in line with this analysis as it is currently at 42.47 which indicates that the momentum behind Polkadot is currently bullish. The Bollinger bands are also expanding, confirming that the market is currently in a bullish trend. The market is near the upper band at $5.49, while the lower band is currently at $5.18.
Polkadot price analysis 4-hour chart: Green candles rise as bulls gain strength
The hourly chart for Polkadot price analysis shows that the DOT/USD pair has formed a bullish flag pattern, a continuation pattern. The breakout from this pattern suggests that the bulls are in control of the market and that prices may continue to rise in the near term. The green candles on the chart indicate that buyers have gained strength and are pushing the price higher.
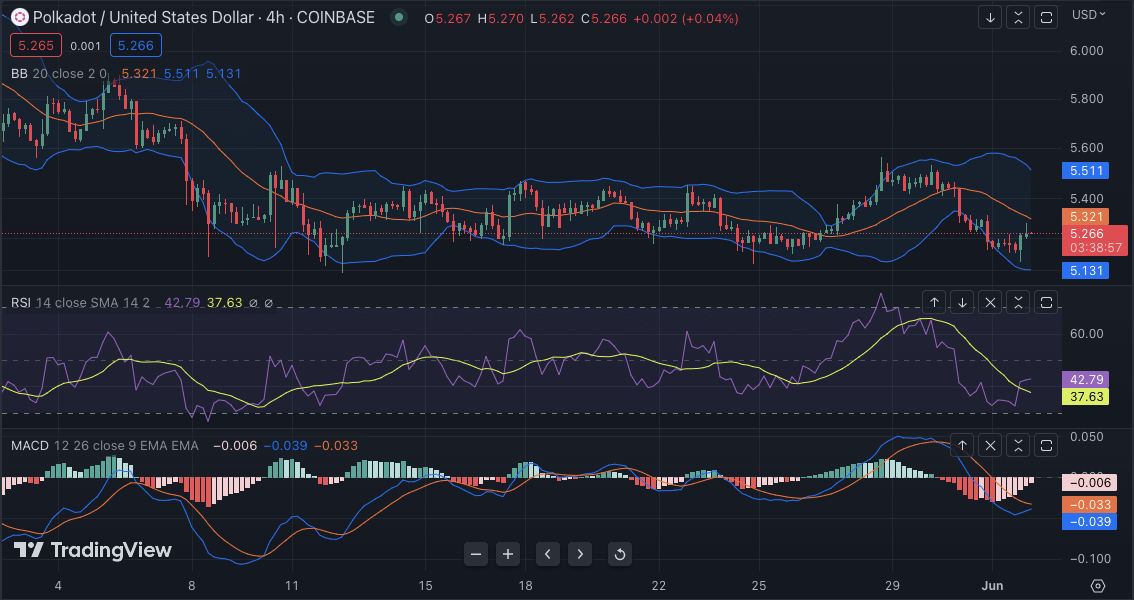
The moving average convergence divergence (MACD) indicator suggests that bullish momentum is increasing as the MACD line has crossed above the signal line. The relative strength index (RSI) is currently at 42.79, indicating that the market is in neutral territory. The Bollinger bands suggest that the market is volatile and that prices may continue to move higher. The Upper Bollinger band is currently at $5.511, which can act as a resistance, while the lower Bollinger band is at $5.13, which can act as a support.
Polkadot price analysis conclusion
Overall, Polkadot price analysis suggests that there could be a potential breakout from the current bullish trend in the near future. The current market sentiment is indicating that bulls are in control of the market, and prices may continue to rise in the short term. However, if bears take control of the market, prices could fall back and test important support levels.